136
DEVELOPING A MATHEMATICAL MODEL FOR PREDICTION OF
ALUMUNIUM 3003 ALLOY USING RESPONSE SURFACE
METHODOLOGY-AN OPTIMIZATION TECHNIQUE
N. Sadanandam,
Assistant Professor Coimbatore Institute of Engineering And Technology [email protected]
S.Pradeepkumar,
Assistant Professor Coimbatore Institute of Engineering And Technology
R.Venkatramanan,
Assistant Professor Coimbatore Institute of Engineering And Technology
R.Renugadevi,
Assistant Professor Coimbatore Institute of Engineering And Technology
Abstract
In this study a series of tests were conducted in order to investigate the machinability evaluation of Alumunium 3003 in the turning process. The factors investigated were spindle speed, feed rate and depth of cut. The parameters that affect the turning operation are vibration, tool wear, surface roughness etc. Among this surface roughness is an important factor that affects the quality in manufacturing process. The main objective of this paper is to predict the surface roughness on Al 3003, by optimizing the input parameters such as spindle speed (α), feed rate (β) and depth of cut (γ) by using carbide tool. A second order mathematical model is developed using regression technique and optimization is carried out using Box-Behnken of response surface methodology. The experimental results indicate that the proposed mathematical models suggested could adequately describe the performance indicators within the limits of the factors that are being investigated. The spindle speed is the most significant factor that influences the surface roughness and. However, there are other factors that provide secondary contributions to the performance indicators. Therefore, this study attempts the application of response surface methodology to find the optimal solution of the cutting conditions for giving the minimum value of surface roughness using Response surface methodology.
Key words: CNC, Depth of cut, feed rate, Optimization, RSM, Spindle speed, Surface roughness
I. Introduction
The response surface methodology (RSM) is a procedure able to determine a relationship between independent input process parameters and output data (process response). This procedure includes six steps . These are, define the independent input variables and the desired output responses, adopt an experimental design plan, perform regression analysis with the quadratic model of RSM, calculate the statistical analysis of variance (ANOVA) for the independent input variables in order to find parameters which significantly affect the response, determine the situation of the quadratic model of RSM and decide whether the model of RSM needs screening variables or not and finally, optimize, conduct confirmation experiment and verify the predicted performance characteristics. (Jenn- Hamdi, 2011).
the prediction of machining parameters that improve the quality of surface finish. The surface roughness is one of the important properties of work piece quality in the CNC (Computer Numerical Control) turning process. An effective approach of optimization
techniques genetic algorithm (GA) and response
surfacemethodology (RSM) was implemented to investigate the effect of the cutting parameters such as cutting speed,
feed rate, and depth of cut on the surface roughness. (zeelan basha, 2013).
Aluminium and its alloys are the most versatile and acceptable engineering materials because of their unique characteristics such as high strength-to-weight ratio, more resistance to corrosion, high thermal and electrical
conductivity, nontoxicity, reflectivity, and ease of
formability and machinability. They have become the world's second most used metal after steel. The principal uses of aluminium and its alloys are in aerospace components, automobile components, electrical appliances,
consumer durables, portable tools, etc. (Amit, 2011). The effects of cutting speed, feed rate, work piece hardness
137 roughness as dependent output variable. On the basis of training data set, different models for surface roughness were developed by genetic programming (M. Brezocnik, 2004). Accuracy of the best model was proved with the testing data. It was established that the surface roughness is most influenced by the feed rate, whereas the vibrations increase the prediction accuracy.
In this research work, the present study is focused on delimiting accurately the working parameters’ domain of turning. Also, the effect of process Parameters on the surface roughness for different values has been investigated. Moreover, this work treats the effect of spindle speed, feed rate and depth of cut on surface roughness in turning of Al 3003 with carbide tool using the RSM. Optimum cutting conditions with respect to the surface roughness parameters with the help of response optimization technique are proposed
II. METHODOLOGY Development of design matrix
Recording the responses
Development of mathematical model
Checking the adequacy of model
Analyzing and prediction
Figure- 1 Methodology flow chart
III. EXPERIMENTATION METHODOLOGY A. ALUMUNIUM WORK PIECE
3003 aluminum alloy is an alloy in the wrought aluminum-manganese family. It can be cold worked to produce tempers with a higher strength but a lower ductility. Like most other aluminum-manganese alloys, 3003 is a general-purpose alloy with moderate strength, good workability, and good corrosion resistance.. The (table 1) below shows the chemical composition of aluminium 3003. (Standard Handbook for Mechanical Engineers)
Table 1 chemical composition for Al 3003
Weight (%) 3003
Al Bal
Si 0.6
Fe 0.7
Cu 0.05-0.20
Zn 0.10
B.MACHINING TOOL
Carbide Inserts for Turning Aluminium Grade AK10 (K10 Uncoated Micro–Grain Carbide Ground with Polished Surface) Main application are Aluminium, Copper
Alloys, Plastics and Abrasive Materials, extended
application – finishing Stainless AK10 Carbide Inserts for Turning Ground and Polished for Aluminium Uni-tip was used for turning shown fig.2.
Figure- 2 Cutting tool AK10 carbide insert
C.EXPERIMENTAL SET UP AND PROCESS
PARAMTERS
The experimental work was divided into two series:
The main aim of the first experiments series was the determination of the turning domain and the quantification of surface roughness evolution. This was carried out through facing operation with continuously varying cutting parameters.
The purpose behind the second experiments series was to investigate the effects of cutting parameters on surface roughness, then to establish a correlation between them using the response surface methodology (RSM).Machining process was carried out in CNC lathe. The measurements of average surface roughness (Ra) were taken on surface roughness Tester SJ-210P.Three measurements of surface roughness were obtained at different surface of machined work piece and average value is used in the further analysis
D. SURFACE ROUGHNESS TESTER SJ-210
Roughness plays an important role in determining how a real object will interact with its environment. Rough surfaces
usually wear more quickly and have
138 Figure- 3 Surface roughness Tester SJ-210P
E.CNC LATHE
Computer Numerical Control (CNC) is one in which the functions and motions of a machine tool are controlled by
means of a prepared program containing coded
alphanumeric data. CNC can control the motions of the workpiece or tool, the input parameters such as feed, depth of cut, speed, and the functions such as turning spindle on/off, turning coolant on/off. (Figure 4) shown below along with specification.
Figure- 4 CNC XL Turning Lathe
Specification:
Control system-Fanuc emulated Spindle power-1.5Hp
Spindle speed-100 to 3500 rpm Max. Turning dia-34mm Rapid traverse rate-1.4m/min
F.COMBINATION OF PARAMETERS AND THEIR LEVELS
In order to investigate the influence of machining parameters on surface roughness, three principal machining parameters, including the spindle speed (α), feed rate (β), depth of cut (γ)), were specified as machining parameters. In this study, these machining parameters were chosen as the independent input variables.
The desired responses were the surface roughness and the surface finish which are assumed to be affected by the above three principal machining
In this experimental analysis the parameters has been conducted in three levels -1, 0, 1 shown in table 2
Table 2 Combination of Parameters and their levels
G. EXPERIMENTAL VALUES 1) Machining parameters
x- spindle speed (rpm) y- Feed rate (mm/min) z- Depth of cut (mm)
2) Responses
R -surface roughness Ra (μm)
Table 3 Actual machining parameters
H.ANOVA
Analysis of variance (ANOVA) tests the hypothesis that the means of two or more populations are equal. ANOVAs assess the importance of one or more factors by comparing the response variable means at the different factor levels. The null hypothesis states that all population means are equal while the alternative hypothesis states that at least one is different. The ANOVA of the actual values are given in
figure 5. Significant at 95% confidence level
Machining parameter
Units Levels
-1 0 1
Spindle Speed rpm 1200 1700 2200
Feed Rate mm/min 0.08 0.1 0.12
Depth of Cut mm 0.4 0.6 0.8
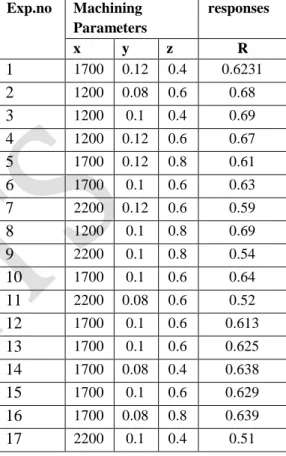
Exp.no Machining Parameters
responses
x y z R
1
1700 0.12 0.4 0.62312
1200 0.08 0.6 0.683
1200 0.1 0.4 0.694
1200 0.12 0.6 0.675
1700 0.12 0.8 0.616
1700 0.1 0.6 0.637
2200 0.12 0.6 0.598
1200 0.1 0.8 0.699
2200 0.1 0.8 0.5410
1700 0.1 0.6 0.6411
2200 0.08 0.6 0.5212
1700 0.1 0.6 0.61313
1700 0.1 0.6 0.62514
1700 0.08 0.4 0.63815
1700 0.1 0.6 0.62916
1700 0.08 0.8 0.639139 Figure- 5 Analysis of Variance
I. MATHEMATICAL MODEL
Regression equations were formed using values of the coefficients of the polynomials .A statistical software design expert 10.1 was used to calculate the values of these coefficients. The second order mathematical model is developed using the experimental values and responses by neglecting the insignificant coefficients to predict the surface roughness to improve the surface finish.
The regression equation for Surface Roughness Ra (Y) is R=+1.09121-1.67010E-004* spindle speed
-4.67687* feed rate+0.082438* depth of cut +2.00000E-003* spindle speed * feed rate
+7.50000E-005* spindle speed * depth of cut-0.88125* feed rate * depth of cut-6.48500E-008* spindle speed2+9.53125* feed rate2-0.092188* depth of cut
V.RESULTS AND DISCUSSIONS Interaction effect of spindle speed
The interaction and direct effect of spindle speed on surface roughness is discussed below.
Design-Expert® Software Factor Coding: Actual R1
Design points above predicted value Design points below predicted value
0.69
0.51
X1 = A: spindle speed X2 = B: feed rate Actual Factor C: depth of cut = 0.6
0.08 0.09 0.1 0.11 0.12 1200 1400 1600 1800 2000 2200 0.5 0.55 0.6 0.65 0.7 0.75 R1
A: spindle speed B: feed rate
Fig. 6, 7 Surface interaction dimensional views and direct effect views of spindle speed over surface roughness.
Fig.6, 7 shows the interaction and direct effect of spindle speed on surface roughness. The above interaction figure evidenced that the spindle speed on the surface roughness of turning process has a significant effect. As the spindle speed increases from 1200 rpm to 2200 rpm the surface roughness value is reduced from 0.68 to 0.58 µm, the conclusion can also be verified from the ANOVA.
Interaction effect of feed rate
The interaction and direct effect of spindle speed on surface roughness is discussed below.
Design-Expert® Software Factor Coding: Actual R1
Design points above predicted value
Design points below predicted value
0.69
0.51
X1 = A: spindle speed X2 = B: feed rate
Actual Factor C: depth of cut = 0.6
0.08 0.09 0.1 0.11 0.12 1200 1400 1600 1800 2000 2200
0.45 0.5 0.55 0.6 0.65 0.7 0.75 R1
A: spindle speed
B: feed rate
Fig.8, 9 Surface interaction and direct dimensional views and direct effect views of feed over surface roughness Fig.8, 9 shows the interaction and direct effect of feed rate on surface roughness. The above interaction figure evidenced that the feed rate on the surface roughness of turning process has a significant effect. From the Fig.8 it has been concluded that higher feed rate increases the surface roughness whereas lower feed rate also increases the surface roughness. To obtain the quality surface of Ra between 0.615 and 0.625 feed rate between 0.09-0.11 should be preferred.
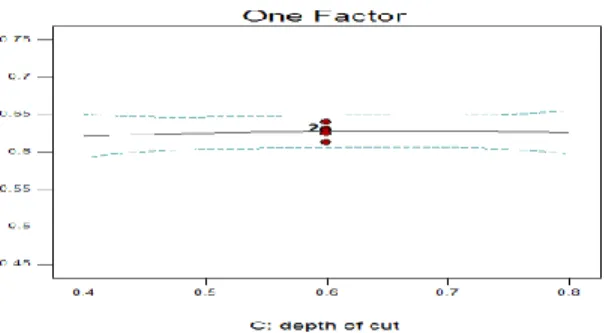
Interaction effect of Depth of cut
The interaction and direct effect of depth of cut on surface roughness is discussed below.
Design-Expert® Software Factor Coding: Actual R1
Design points above predicted value
Design points below predicted value
0.69
0.51
X1 = A: spindle speed X2 = C: depth of cut
Actual Factor B: feed rate = 0.1
0.4 0.5 0.6 0.7 0.8
1200 1400 1600 1800 2000 2200 0.45 0.5 0.55 0.6 0.65 0.7 0.75 R1
A: spindle speed
140 Fig.10, 11 Surface interaction and direct dimensional views and direct effect views of spindle speed and depth of cut over surface roughness
Fig.10, 11 shows the interaction and direct effect of depth of cut on surface roughness. The above interaction figure evidenced that depth of cut on the surface roughness of turning process has a significant effect. From the Fig.10 it has been concluded that the the increase in depth of cut (0.5 to 0.8 mm) has a significant effect on surface roughness increases (0.625-0.645µm)) whereas the decrease in depth of cut (0.4 to 0.5 mm) reduces on surface roughness (0.625 to 0.630µm).The conclusion can also be verified from the ANOVA
Prediction Vs Actual
Fig. 4 revealed that they have no obvious pattern and
Unusual structure. This implies that the models proposed are adequate and there is no reason to suspect any violation of the independence or constant variation assumption
Fig.5. Prediction Vs Actual
VII.CONCLUSION
This investigation of this research attempts the application of response surface methodology to find the optimal solution of the cutting conditions such as spindle speed (rpm), feed rate (mm/min) and depth of cut (mm) for giving the minimum value of surface roughness using design
of experiment concept. The following conclusions are
obtained by analysis of work are,
The obtained experimental data can be used to predict the surface roughness 'Ra' by developing the regression model using DoE
The spindle speed on surface roughness of turning process has a significant effect. As the spindle speed increases from 1200 rpm to 2200 rpm the
surface roughness value is reduced from 0.68 to 0.58 µm and good surface roughness was obtained. The change in feed rate has significant
effects on surface roughness as higher feed rate increases the surface roughness whereas lower feed rate also increases the surface roughness. To obtain the quality surface of Ra between 0.615 and 0.625 feed rate should be preferred between 0.09-0.11 mm/min.
The increase in depth of cut (0.5 to 0.8 mm) has a significant effect on surface roughness increases (0.625-0.645µm)) whereas the decrease in depth of cut (0.4 to 0.5 mm) reduces on surface roughness (0.625 to 0.630µm).
VII.REFERENCES
[1] Hamdi, A., Mohamed, A.(2011). Analysis of surface roughness and cutting force components in hard turning with CBN tool: Prediction model and cutting conditions optimization. Measurement: 344- 354. [2] Anil, G., Hari, S., Aman,A.(2010).Taguchi-fuzzy multi output optimization (MOO) in high speed CNC turningof AISI P-20 tool steel.Expert Systems with Applications:.6822-6828.
[3] Amit, S., Vinod, Y.(2011) .Modeling and optimization of cut quality during pulsed laser cutting of thin Al-alloy sheet for straight profile. Optics & Laser Technology: 159-168.
[4] Zeelan Basha N, ―Determining the Effect of Cutting Parameters on Surface Roughness Using Genetic Algorithm‖ Science, Technology and Arts Research Journal, pp.98-101, 2013.
[5] Marks' Standard Handbook for Mechanical Engineers, 8th Ed., McGraw Hill, pp. 6-50 to 6-57
[6] Ilhan , A., Mehmet, Ç.(2010).Modeling and prediction of surface roughness in turning operations using artificial neural network and multiple regression method.Expert Systems with Applications:.5826-5832.
[7] Aman Aggarwal ―Optimizing power consumption for CNC turned parts using response surface methodology and Taguchi’s technique—A comparative analysis‖journal of materials processing technology 2 0 0 ( 2 0 0 8 ) 373–384.
[8] P.V.S. Suresh ―A genetic algorithmic approach for optimization of surface roughness prediction model‖ International Journal of Machine Tools & Manufacture 42 (2002) 675–680.
[9] N. Zeelan Basha, ―Optimization of CNC Turning Process Parameters on ALUMINIUM 6061 Using Genetic Algorithm‖, International Journal of Innovative Science and Modern Engineering, pp.43-46, 2013. M. Brezocnik, M. Kovacic, M. Ficko, ―Prediction of surface roughness with Genetic programming‖,Journal of Materials Processing Technology, 2004,pp.28-36
[10] MaciejGrzendaa, Andres Bustillo, ‖The evolutionary development of roughness prediction models‖, Applied Soft Computing (2012), pp.1-10.
[11] S.S.K. Deepak, ―Applications of Different Optimization Methods for Metal Cutting Operation‖–A Review, Research Journal of Engineering Sciences,Vol. 1(3), Sept.2012,pp. 52-58
[12] HamdiAouici, Mohamed AthmaneYallese, KamelChaoui, TarekMabroukic, Jean-François Rigal, ―Analysis of surface roughness and cutting force components in hard turning with CBN tool‖, Prediction model and cutting conditions Optimization, Measurement 45 (2012),pp.344–353.
141 [14] SuleymanNeseli,SuleymanYaldız, Erol Turkes,‖
Optimization of tool geometry parameters for turning operations based on the response surface methodology‖, Measurement 44 2011, pp. 580–587.
[15] Chen Lu, ―Study on prediction of surface quality in machining process‖, journal of materials processing technology, 24 November 2007, pp.439-45`
[16] K.Saravanakumar, M.R.Pratheesh Kumar, Dr.A.K.ShaikDawood, ―Optimization of CNC Turning Process Parameters on INCONEL 718 Using Genetic Algorithm‖, IRACST – Engineering Science and Technology: An International Journal (ESTIJ)Vol.2, No.4, August 2012,pp.532-537