222
INFLUENCE OF POTASSIUM FERTILIZATION ON SHOOT GROWTH
AND MATURITY INDICATORS OF
CV. SAUVIGNON BLANC (VITIS VINIFERA L.)
NEBOJŠA MARKOVIĆ1, ZORAN ATANACKOVIĆ1
,
1 Faculty of Agriculture Belgrade University, Nemanjina 6, 11080 Belgrade-Zemun, Serbia (e-mail:
Key words: potassium, shoot growth, shoot maturity, Sauvignon Blanc
ABSTRACT
Research were carried out at vineyard on Experimental station “Radmilovac” on Faculty of Agriculture in Zemun on cv. Sauvignon blanc. In experiment was used potassium fertilazier in following treatments: control (without fertilization) and treatments with fertilizer were it used doses of 50, 100 and 150 kg K2O/ha. During the first research
year, the largest shoots growth (99.3 cm) was recorded with application of 150 kg K2O/ha
doses and the lowest in control treatment (74.7 cm). Shoots maturity was more favorable with increasing doses of potassium fertilizer in relation to the control treatment. In the second year, continued the same trend where again the largest increase was recorded in treatments with the highest dose and the lowest increase of 12.2% was recorded in control. In the third year of treatment with 100 and 150 kg K2O/ha realized the largest
increase with differences of 16.5% and 28.3% compared to control. The highest degree of shoots maturity was achieved with a dose of 150 kg K2O/ha (95.06%), slightly lower in the
treatment with 100 kg K2O/ha (86.07%) and the lowest in control (87.30%).
INTRODUCTION
Potassium play a very important role in grapevine nutrition and metabolism. According to quantity in plant tissues potassium is located just behind nitrogen. It is known that vine needs for potassium is large. Potassium play an important role in osmotic and ionic balance, electrochemical processes in the cell, neutralizing excess of organic acid, synthesis and metabolism of proteins and carbohydrates, cell division, photosynthesis, regulation of osmotic pressure in the cell, opening and closing stomata and play very important role in shoots maturation and adequate preparation of vine for dormancy period
(Jackson, 2008). Potassium is asimilated in the form of K+ ions and transported to higer
plant parts through phloem. Potassium deficiencies is manifest by leaves chlorosis and edges of older internerval leaf parts and can be compensated with adequate application of potassium fertilizers. Potassium influence can also expressed on cluster size, yield and berries coloration (Bavaresco et al., 2010).
Potassium level in soil dependent on numerous factors that interact with each other. The most important is mineral content in soil, fertilization, humus content, pH, soil humidity, temperature, microbiological activity of root system etc. (Ličina, 2009).
Needs for potassium during growing season continuously increase. So, accumulation of potassium in leaves and shoots increased until august but increasing in grapes depends on the variety, is to mid august. Increasing dose of potassium fertilizer influenc increasing leaf mass and shoot length, which is reflected in level of mature shoots part (Markovic, 1998, 2012).
MATERIAL AND METHOD
223
block design where each treatment in the eighteen vines which are arranged in three replications with six vines. In experiment each year was applied potassium fertilizer in following treatments (we used 50% KCl): control (no fertilization) treatments with fertilizer
doses of 50, 100 and 150 kg K2O/ha. Nitrogen was allso added in amount of 30 kg N/ha
and phosphorus in amount 50 kg P2O5/ha. The shoot growing was measured from
intensive growth until shoot growth termination at autumn. Proportion of matured shoots was measured from moment of first signs of maturation at the base of the shoots.
RESULTS AND DISCUSSIONS
The shoot growth in the first, second and third year of research occur with different intensity. During the first year of research was the smallest shoot growth. Immediately after grafts planting, their growth was initially developed slower. From beginning of june to end of august was more intensively and after slow down again. Reason for slow growth in period may-june can be weather conditions that prevailed in period from planting to beginning shoots growing. In fact, in this period there are very high temperatures and practically no precipitations. Additionally late start of shoot growth in the first year after planting is caused by fact that it requires some time to establish contact with root system and soil and restoring function roots after planting.
Different doses of potassium expressed differences in shoots growth. The biggest
shoot increase (table 1) in the first year of research was at treatment with 150 kg/ha K2O
(99.3 cm) and the lowest at control (74.7 cm).
Table 1. Dynamics of shoots growth in the first year of research (cm)
Shoot length (cm)
Date Control 50 kg/ha K2O 100 kg/ha K2O 150 kg/ha K2O
26.V 8,1 7,4 7,3 9,8
9.VI 12,0 12,3 15,5 15,5
23.VI 14,9 17,6 18,4 21,1
8.VII 29,6 31,7 26,8 35,5
21.VII 44,0 44,6 41,6 47,0
29.VII 50,4 51,0 57,0 59,6
22.VIII 66,0 64,7 72,0 79,4
31.VIII 70,6 72,9 77,4 86,8
12.IX 71,7 73,3 81,5 94,2
22.IX 73,8 78,9 84,6 97,8
31.IX 74,7 81,6 85,4 99,3
Total shoot length
(%) 100 109,24 114,32 132,93
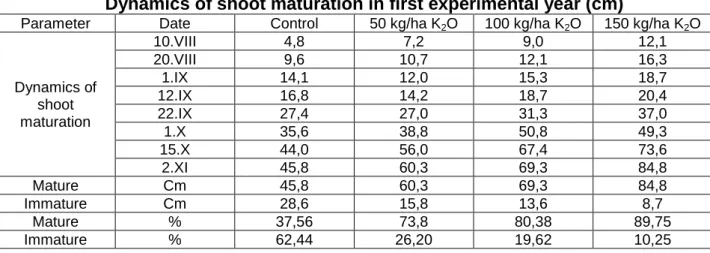
It was found that there was no significant difference in shoot growth between treatments. Beginning of shoot maturation in all experiment years was detected in mid august.
Table 2. Dynamics of shoot maturation in first experimental year (cm)
Parameter Date Control 50 kg/ha K2O 100 kg/ha K2O 150 kg/ha K2O
Dynamics of shoot maturation
10.VIII 4,8 7,2 9,0 12,1
20.VIII 9,6 10,7 12,1 16,3
1.IX 14,1 12,0 15,3 18,7
12.IX 16,8 14,2 18,7 20,4
22.IX 27,4 27,0 31,3 37,0
1.X 35,6 38,8 50,8 49,3
15.X 44,0 56,0 67,4 73,6
2.XI 45,8 60,3 69,3 84,8
Mature Cm 45,8 60,3 69,3 84,8
Immature Cm 28,6 15,8 13,6 8,7
Mature % 37,56 73,8 80,38 89,75
224
In tables 2 and 3 it can seen that is significant reduction in mature shoots part in
control compared with fertilization treatments with 50, 100 and 150 kg/ha K2O, which is in
correlation with the total shoot length. Based on this, we can say that in the control (no fertilizer treatment), maturity shoot was very weak, and that in all fertilizing treatments shoots maturity was very well.
Table 3. The significance of shoot maturation during the first year of research
Treatment Mean Control 50 kg/ha K2O 100 kg/ha K2O
150 kg/ha K2O 84,8 39,0** 24,5** 15,5**
100 kg/ha K2O 69,3 23,5** 9,00**
50 kg/ha K2O 60,3 14,5** LSD0,05=4,3286
Control 45,8 LSD0,01=5,8051
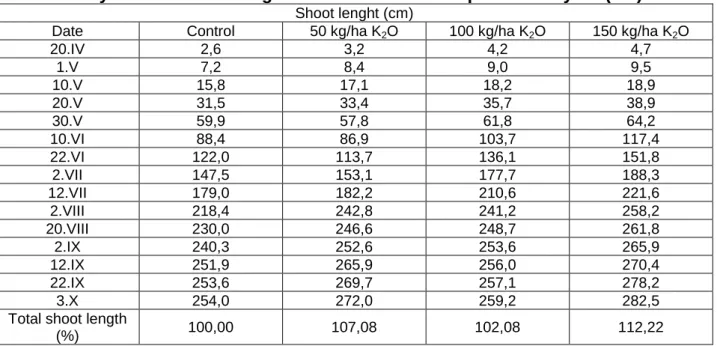
During the second year of research were conducted shoot growing was intensively from early may to late august and then slowed down until late september (table 4).
Table 4. Dynamics of shoots growth in the second experimental year (cm)
Shoot lenght (cm)
Date Control 50 kg/ha K2O 100 kg/ha K2O 150 kg/ha K2O
20.IV 2,6 3,2 4,2 4,7
1.V 7,2 8,4 9,0 9,5
10.V 15,8 17,1 18,2 18,9
20.V 31,5 33,4 35,7 38,9
30.V 59,9 57,8 61,8 64,2
10.VI 88,4 86,9 103,7 117,4
22.VI 122,0 113,7 136,1 151,8
2.VII 147,5 153,1 177,7 188,3
12.VII 179,0 182,2 210,6 221,6
2.VIII 218,4 242,8 241,2 258,2
20.VIII 230,0 246,6 248,7 261,8
2.IX 240,3 252,6 253,6 265,9
12.IX 251,9 265,9 256,0 270,4
22.IX 253,6 269,7 257,1 278,2
3.X 254,0 272,0 259,2 282,5
Total shoot length
(%) 100,00 107,08 102,08 112,22
The highest increase in shoot lenght was recorded in treatment with 150 kg/ha K2O
(282.5 cm) and the lowest in control treatment (254 cm), which was manifested also in the first research year. In relation to shoots length in control treatment, shoots in treatment
with 150 kg/ha K2O achieved bigger length for 12.2%.
225
Table 5. Dynamics of shoot maturation in second experimental year (cm)
Parameter Date Control 50 kg/ha K2O 100 kg/ha K2O 150 kg/ha K2O
Dynamics of shoot maturation
20. VII 3,5 5,8 5,0 5,3
1.VIII 11,6 15,8 14,1 15,0
15.VIII 27,7 33,3 28,6 31,4
1. IX 72,8 82,3 76,0 79,9
15. IX 121,3 142,4 126,5 153,6
2. X 182,5 200,3 189,1 210,6
15. X 200,7 230,2 205,6 220,3
1. XI 226,3 240,8 230,2 238,6
15. XI 230,8 246,5 238,4 241,3
Mature cm 230,8 246,5 238,4 241,3
Immature cm 24,0 23,5 26,3 31,9
Mature % 89,64 90,47 88,97 86,78
Immature % 10,36 9,53 11,03 13,22
From data from table 5 can be seen that level of shoots maturity in all treatments
was satisfactory. The smallest percent of mature part was in treatment with 150 kg/ha K2O
(86.78%), slightly higher in treatment with 100 kg/ha K2O and in control (88.97% and
89.64%) and the highest in treatment with 50 kg/ha K2O (90.47%).
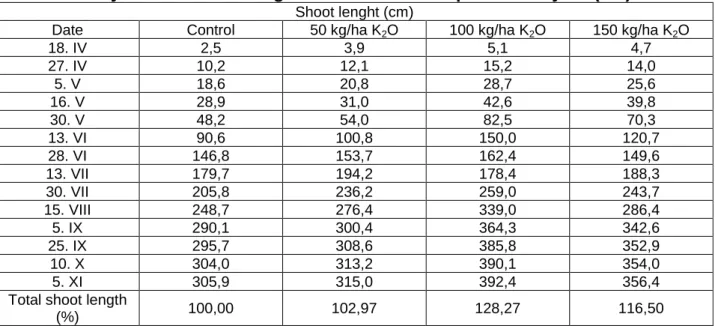
In the third year of research have been more expressed differences in shoots growth and maturation between treatments. Results are shown in table 6. The highest
shoots increase was in treatment with 100 kg/ha K2O and 150 kg/ha K2O with high
statistical significance compared to other treatments (table 7).
Table 6. Dynamics of shoots growth in the third experimental year (cm)
Shoot lenght (cm)
Date Control 50 kg/ha K2O 100 kg/ha K2O 150 kg/ha K2O
18. IV 2,5 3,9 5,1 4,7
27. IV 10,2 12,1 15,2 14,0
5. V 18,6 20,8 28,7 25,6
16. V 28,9 31,0 42,6 39,8
30. V 48,2 54,0 82,5 70,3
13. VI 90,6 100,8 150,0 120,7
28. VI 146,8 153,7 162,4 149,6
13. VII 179,7 194,2 178,4 188,3
30. VII 205,8 236,2 259,0 243,7
15. VIII 248,7 276,4 339,0 286,4
5. IX 290,1 300,4 364,3 342,6
25. IX 295,7 308,6 385,8 352,9
10. X 304,0 313,2 390,1 354,0
5. XI 305,9 315,0 392,4 356,4
Total shoot length
(%) 100,00 102,97 128,27 116,50
Differences compared to control range from 16.5 to 28.3%. Intense growth happened from early may to early September and then slowed down to october.
Table 7. The significance of shoot growing during the third year of research
Treatment Mean Control 50 kg/ha K2O 100 kg/ha K2O
150 kg/ha K2O 392,40 86,50** 77,40** 36,00**
100 kg/ha K2O 356,40 50,50** 41,40**
50 kg/ha K2O 315,00 9,10 LSD0,05=16,9728
226
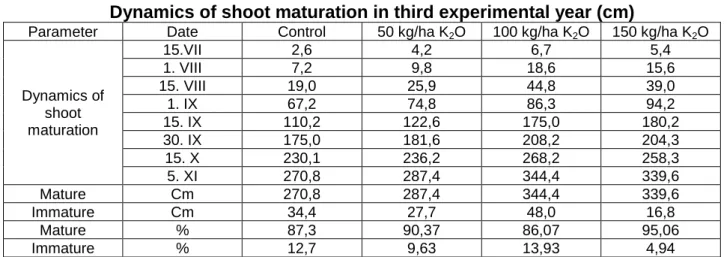
In the third year of research achieved the highest shoots length in comparison to vine age and the maximum length of matured shoots part. Analysis of variance (table 9) showed that control had a significantly smaller part of matured shoots in relation to
treatment with 50, 100 and 150 kg/ha K2O. These values are also in proportion to the total
length of shoots.
Table 8. Dynamics of shoot maturation in third experimental year (cm)
Parameter Date Control 50 kg/ha K2O 100 kg/ha K2O 150 kg/ha K2O
Dynamics of shoot maturation
15.VII 2,6 4,2 6,7 5,4
1. VIII 7,2 9,8 18,6 15,6
15. VIII 19,0 25,9 44,8 39,0
1. IX 67,2 74,8 86,3 94,2
15. IX 110,2 122,6 175,0 180,2
30. IX 175,0 181,6 208,2 204,3
15. X 230,1 236,2 268,2 258,3
5. XI 270,8 287,4 344,4 339,6
Mature Cm 270,8 287,4 344,4 339,6
Immature Cm 34,4 27,7 48,0 16,8
Mature % 87,3 90,37 86,07 95,06
Immature % 12,7 9,63 13,93 4,94
Observing percentage of shoots maturity can be noticed that it was somewhat lower
in the treatment with 100 kg/ha K2O in the control (below 90%), while in other treatments
over 90%. The highest degree of maturity was noticed in treatment with 150 kg/ha K2O
(table 8). The significance for matured shoots part are shown in table 9.
Table 9. The significance of shoot maturation during the third year of research
Treatment Mean Control 50 kg/ha K2O 100 kg/ha K2O
150 kg/ha K2O 344,4 73,6** 57,0** 4,8
100 kg/ha K2O 339,6 68,8** 52,2**
50 kg/ha K2O 287,4 16,6* LSD0,05=15,2083
Control 270,8 LSD0,01=20,3957
CONCLUSIONS
After research can be conducted the following conclusions:
• Growth of shoots in the first year was conducted to different intensity. Immediately after planting grafts increase initially developed in slow motion. From the beginning of june to end of august was carried much more intense and then slow down again. This dynamic growth is caused by the weather conditions that prevailed in the period from planting to the end of growing season and thus the grafts after planting;
• In the first year higher growth was achieved in treatment with 150 kg/ha K2O (99.3
cm) compared to the control (74.7 cm). Percent of matured shoots part was more favorable in treatments with increasing potassium doses compared to control;
• The biggest shoots growth in the second year of study was recorded in treatment
with 50 kg/ha K2O, and the lowest in control. Percent of shoot maturity was very good and
varied from 86.78% (treatment with 150 kg/ha K2O) to 90.4% (treatment with 50 kg/ha
K2O).
• In the third year have been more expressed differences in growth and shoots maturation between treatments. The highest increase was recorded in treatments with 100
and 150 kg/ha K2O, where differences compared with control range from 16.5 to 28.3%.
The highest degree of shoot maturity was achieved in the treatment with 150 kg/ha K2O
(95.06%), and slightly lower in treatment with 100 kg/ha K2O (86.07%) and control
227
ACKNOWLEDGEMENT
This paper was realized as a part of the project (TR 31063): Application of new genotypes and technological innovation in fruit and grape production financed by the Ministry of Education and Science of the Republic of Serbia within the framework of the technological project research for the period 2011-2014.
BIBLIOGRAPHY
1. Bavaresco, L., Gatti, M., Fregoni, M., 2010 - Nutritional Deficiencies. Methodologies and Results in Grapevine Research. Springer. pp. 165-191.
2. Jackson, R., 2008 - Wine science: principles and applications, Elsevier.
3. Ličina, V., 2009 -Agrohemija. Zavod za udžbenike i nastavna sredstva. Beograd. 4. Marković, N., 2012 - Tehnologija gajenja vinove loze. Zadužbina Svetog manastira
Hilandar i Poljoprivredni fakultet. Beograd.
5. Markovic, N., 1998 - Uticaj kalijumom ishrane na rastenje, rodnost i kvalitet grožđa