ENERGY CONSUMPTION GUIDE
Energy use in offices
■
OFFICE TYPE 1
Naturally ventilated
cellular
■
OFFICE TYPE 2
Naturally ventilated
open-plan
■
OFFICE TYPE 3
Air-conditioned
standard
■
OFFICE TYPE 4
Air-conditioned
prestige
1
INTRODUCTION 4
2
BACKGROUND
6
3
CHARACTERISTICS AFFECTING ENERGY COSTS
6
4
ARE YOUR ENERGY COSTS REASONABLE?
8
5
WHERE DOES THE ENERGY GO?
10
6
A CLOSER LOOK: SYSTEM AND COMPONENT BENCHMARKS
13
7
SUMMARY CHECKLISTS
16
APPENDIX A
18
APPENDIX B
20
GENERAL INFORMATION AND FURTHER READING
23
1 INTRODUCTION
This Guide is intended to raise awareness of the potential to improve the energy and environmental performance of offices, and to encourage positive management action. It describes four types of office buildings against which you can compare the performance of your own offices. It gives benchmarks for energy consumption, energy cost, and carbon dioxide (CO2) emissions, which are quoted in kilograms of carbon dioxide (kgCO2). It outlines technical and management measures to help reduce energy consumption and costs. As well as overall benchmarks, this Guide provides additional detail to assist diagnosis, analysis, technical and managerial improvements. In parallel with this Guide, an offices energy benchmarking tool will be available from Spring 2003 on the Action Energy website at
www.actionenergy.org.uk. This is derived from the same data as this Guide, but it will allow you to tailor the overall benchmarks to individual office buildings, rather than one of the four generic types.
STRUCTURE OF THE GUIDE
Although primarily written for technical consultants and facilities managers, the Guide should also be of interest to a range of building professionals, architects, owners and investors. The Guide starts by looking at broader energy issues and moves into progressively increasing detail. Summary checklists for all readers are shown in section 7, and specialist terminology is explained in appendix B.
WHAT ARE BENCHMARKS?
Building energy benchmarks provide representative values for common building types, against which you can compare your building’s actual performance. Comparison with simple benchmarks of annual energy use per square metre of floor area will permit
the standard of energy efficiency to be assessed and enable remedial action to be taken. More detailed benchmarks can help pinpoint problem areas within a building.
Although rounded for clarity, the benchmark values presented in this Guide are derived from surveys of a large number of occupied buildings and include all energy uses, not just building services. This Guide gives benchmarks for:
■ ‘Typical’energy consumption patterns, which are consistent with median values of data collected in the mid-1990s for the Department of the Environment, Transport and the Regions (DETR) from a broad range of occupied office buildings.
■ ‘Good practice’examples in which significantly lower energy consumption has been achieved using widely available and well-proven energy-efficient features and management practices. These examples fall within the lower quartile of the data collected. New designs should aim to improve upon the good practicebenchmarks.
Benchmarks are applied to: ■ buildings as a whole
■ environmental services, such as heating, lighting and air-conditioning, to typical comfort standards
■ components of those services, particularly the efficiency of lighting and air handling systems ■ office and computer equipment
■ typical hours of use.
Special facilities are also covered, particularly catering kitchens and computer rooms. These vary greatly depending on their size, and intensity and efficiency of use. Sub-metering of gas and electricity to these areas is always desirable.
RELEVANCE TO DESIGN
The benchmarks given here will be higher than most design estimates, which often assume essentially perfect performance and operation, and ignore some end uses and practices. The component benchmarks (page 13-15) will help in setting appropriate power ratings, hours of use etc. System and component efficiency information may also be of interest to designers and those who are briefing them, and to prospective tenants when assessing buildings and systems.
General Information Leaflet (GIL) 11 ‘Energy efficiency in offices. A review of 12 office case studies’ reviews some good practice buildings from the 1980s. New designs will often be able to improve upon
INTRODUCTION
Using the benchmarks
Appendix A describes how to calculate the performance of your building. Energy use in offices depends on the type and size of the building. For example, a prestigious headquarters office is likely to consume more energy per square metre than a small, local office. For this reason, the benchmarks presented in this Guide refer to four generic office types (below).
The benchmarks are most appropriate for managed buildings with floor areas of 1500 m2or more. They allow for actual hours of use including cleaning, weekend work and so on, and the wastage and inefficiency that inevitably occurs to some degree, even in the best regulated
environments.
1
3
4
2
naturally ventilated cellular naturally ventilated open-plan
Office fuel bills can range from about £4 to £30 per year per square metre of treated floor area (TFA), including Climate Change Levy (CCL), but excluding VAT. Items under each of the four headings below can influence the outcome by a factor of two. Unit energy costs also vary. (Appendix B includes definitions of floor area, typical conversion factors, and typical energy costs.)
Key features:
■ the standards to which the building and its services are designed
■ the proportion of open-planned offices; these tend to use more energy, particularly for lighting ■ the presence of air-conditioning.
Building quality:
■ design which maximises the use of form and fabric to control the internal environment ■ design which minimises the provision,
capacity and use of building services ■ the efficient design and effective, usable
control of these services
■ the quality of construction, installation and commissioning.
2 BACKGROUND
3 CHARACTERISTICS AFFECTING ENERGY COSTS
The Climate Change Levy (CCL) is a tax on energy use in industry, commerce, agriculture and the public sector. It was introduced in April 2001. The tax varies in its effects as some organisations are eligible for discount and some energy sources or uses of energy are exempt. All UK businesses and public sector organisations pay the levy, via their energy bills. The full rates of levy assumed in cost
comparisons in this Guide are 0.43p/kWh for electricity, 0.15p/kWh for gas, 1.17p/kilogram for coal, and 0.96p/kilogram for LPG. Fuel oils do not attract the levy as they are already subject to excise duty.
Occupancy and management:
■ occupancy hours and, to a lesser extent, densities ■ the amount of office and other equipment
installed and its intensity of use
■ matching standards and operating hours of services and equipment to usage
■ effective maintenance ■ unoccupied space.
Energy-intensive areas:
■ mainframe computer rooms, communications rooms and extensive dealing rooms, and their air-conditioning.
■ catering kitchens and sports and leisure facilities.
Other areas such as storage or car parking may have relatively low energy use.
It is rare to achieve excellence in all the above, so nearly all buildings – new and old – have significant opportunities for reduced energy costs. Energy use in offices has risen in recent years
because of the growth in information technology, air-conditioning (sometimes specified when not required), and intensity of use. However, this trend is offset by considerable improvements in
insulation, plant, lighting and controls. The energy use benchmarks presented in this Guide are based on data gathered in the 1990s and reflect both of these trends.
Despite perceptions to the contrary, energy-efficient offices are not expensive, difficult to manage or inflexible. Nor are they low on comfort and productivity. Energy-efficient techniques which work well tend to be reliable, straightforward, and compatible with management and user needs. Capital costs are often similar to those for normal offices, although budgets may be spent differently – for example, on measures to decrease cooling loads instead of on air-conditioning.
Further opportunities for improving energy efficiency should be sought when other changes occur, eg refurbishment, fit-out, alteration, and plant replacement. Here the best results ensue from a good brief, good design with attention to detail, sound construction and commissioning, and good control and management.
Low energy consumption is just one attribute of a carefully designed and well-managed building – comfort and productivity are others. Conversely, energy waste is an indicator of poor business management elsewhere.
Maintenance organisations need to be carefully briefed and supervised if they are to manage energy effectively. If this is not reflected in contract conditions, systems may be run wastefully.
CHARACTERISTICS AFFECTING ENERGY COSTS
MIXED-MODE OFFICES
Mixed-mode systems combine natural and mechanical ventilation and cooling in buildings which might otherwise have been fully air-conditioned.
Examples include naturally ventilated offices with background mechanical ventilation or with mechanical comfort cooling which
Information Report (GIR) 56 ‘ Mixed mode buildings and systems – an overview’, and concepts, opportunities and pitfalls are discussed more fully in GIR 31 ‘Avoiding or minimising the use of air-conditioning’.
Choice of benchmarks for mixed-mode buildings is outlined in OFFICE TYPES
The four generic types of office described below contain characteristic packages of the features on page 6 and provide reference points for benchmark comparisons. Office buildings which do not match these types should be benchmarked by either:
■ using the tailored benchmarking tool available from Spring 2003 on the Action Energy website at www.actionenergy.org.uk or
■ adding together appropriate end uses from the tables in Appendix B.
■ A simple building, often (but not always)
relatively small and sometimes in converted residential accommodation.
■ Typical size ranges from 100 m2to 3000 m2. The domestic approach, with individual windows, lower illuminance levels, local light switches and heating controls helps to match the operation with the needs of occupants and tends to reduce electricity consumption in particular. There also tend to be few common facilities. Catering often consists of the odd sink, refrigerator and kettle.
■ Largely open-plan but with some cellular offices and special areas.
■ Typical size ranges from 500 m2to 4000 m2. This type is often purpose built, sometimes in converted industrial space. Illuminance levels, lighting power densities and hours of use are often higher than in cellular offices. There is more office equipment, vending machines etc, and more routine use of this equipment. Lights and shared equipment tend to be switched in larger groups, and to stay on for longer because it is more difficult to match supply to demand.
■ Largely purpose-built and often speculatively developed.
■ Typical size ranges from 2000 m2to 8000 m2.
This type is similar in occupancy and planning to building type 2, but usually with a deeper floor plan, and tinted or shaded windows which reduce daylight still further. These buildings can often be more intensively used. The benchmarks are based on variable air volume (VAV) conditioning with air-cooled water chillers; other systems often have similar overall consumption but a different composition of end use. (See Good Practice Guide (GPG) 290 ‘Ventilation and cooling option appraisal – a client’s guide’.)
■ A national or regional head office, or technical or administrative centre.
■ Typical size ranges from 4000 m2to 20 000 m2. This type is purpose-built or refurbished to high standards. Plant running hours are often longer to suit the diverse occupancy. These buildings include catering kitchens (serving hot lunches for about half the staff); air-conditioned rooms for mainframe computers and communications equipment; and sometimes extensive storage, parking and leisure facilities. These facilities may be found in offices of other types, and, if so, can be allowed for by adding together energy consumption by appropriate end uses from different office types in Appendix B.
1
3
4
2
naturally ventilated cellular naturally ventilated open-plan
4 ARE YOUR ENERGY COSTS REASONABLE?
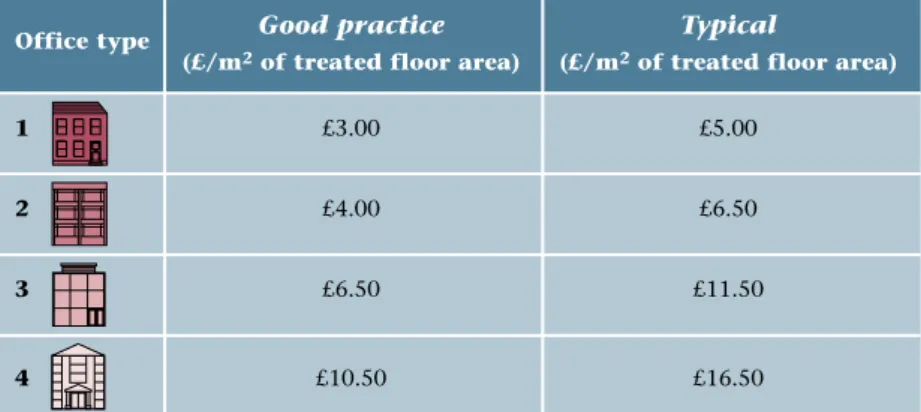
Energy costs are often much higher than they need to be, even in many new or refurbished offices. This needlessly increases the building’s impact on the environment. The simple benchmarks given in table 1 will show if your annual energy costs are reasonable. The benchmarks in this Guide are shown per square
metre of ‘treated floor area’ (TFA) for the four types of office. (See appendix B for conversions from net lettable and gross area to treated floor area and table B5 for average energy costs.)
If your costs are higher than typical, you should investigate why, or seek assistance. If they are below typical– or even good practice– there will still often be scope for further cost-effective savings. Fossil fuel – gas or oil – typically accounts for upto £3/m2in all four types of office, while good practice examples use half as much or less. The remainder is electricity which, in air-conditioned offices, usually accounts for 80%-90% of total energy costs and CO2emissions.
The variation in energy use between office types can often provide an opportunity for significant savings during building procurement and design – see the checklist boxes below.
1 £3.00 £5.00
2 £4.00 £6.50
3 £6.50 £11.50
4 £10.50 £16.50
Table 1 Annual cost benchmarks for different office types including the CCL but excluding VAT
Make sure that energy and environmental issues are properly covered in the brief for design or property selection.
Include energy efficiency in briefs for alterations and fit-outs.
Ask energy specialists to review design specifications and performance.
Office type Good practice Typical
(£/m2of treated floor area) (£/m2of treated floor area)
Ensure that energy performance is considered in the brief and detailed specification of buildings, services and controls for new construction, refurbishment and maintenance.
Consider whether air-conditioning is really required, and whether it is needed throughout the building. Include power demand benchmarks for designers. Review them for appropriateness and compliance (see section 6).
Review effectiveness of system design and controls. Check for weak spots under various operating scenarios.
Question requirement for air-conditioning when moving premises.
Be prepared to invest in measures that bring good returns. However, many measures will cost little or no more, and some will bring rapid savings. Make sure that systems are readily controllable and properly commissioned.
OPPORTUNITIES FOR SAVING WHEN MOVING OFFICE
OPPORTUNITIES FOR SAVING WHEN COMMISSIONING A NEW OFFICE As a general rule, check that controls: ■ are appropriate for the task and the
management skills available ■ allow systems to provide the required
conditions and services efficiently and without waste
■ respond clearly, quickly and effectively to management and occupant needs ■ avoid systems defaulting to ON ■ are properly commissioned.
ARE YOUR ENERGY COSTS REASONABLE?
Energy costs in tenanted buildings
Tenants who share buildings often pay for some of their energy via the landlord’s service charge, and the rest via their own meters.
In small offices, energy within the service charge may be for staircase and outside lighting only, and perhaps a lift, security system and cleaner’s hot water, costing say £1 per square metre of nett lettable office area per year. In many office buildings, however, landlord’s services include central provision of heating, air-conditioning if installed (though systems for computer rooms, etc will usually be separately metered and charged), and often hot water excluding catering kitchens. These typically account for roughly half the building’s total energy costs excluding those of special features such as computer rooms (see page 10). Statistics from major landlords are published annually in the OSCAR report (see further reading on page 23). 2001 average energy charges were in the region of £3.50/m2of net lettable area (10% of the total service charge) in naturally ventilated offices and £8.50/m2(15% of the total) in air-conditioned offices. In good practicebuildings, energy charges will be some two-thirds of these. (For floor area definitions and conversions to square feet see appendix B.)
The energy component of the annual service charge may already be stated in your bill. If not, your
landlord should be able to tell you what it is. If it appears to be high, you should discuss why, and explore the scope for any cost-effective improvements to the systems, their operation, management and metering, or see if there is scope for more competitive purchasing.
In multi-tenanted buildings, energy use and costs can often be higher than where there is a single occupier. Frequently the landlord or the landlord’s contractor runs systems liberally – for example with air-conditioning left on until late every evening because somebody holding a late meeting once complained. With better communication or improved control facilities, such waste can often be reduced. Installing sub-meters can lead to fairer allocation of energy charges.
Landlords will also have no incentive to invest to save energy if all the savings accrue to tenants who are obliged to pay the bills anyway. Similarly, tenants may not wish to spend money on things that belong to, or will revert to, the landlord, even if the investment would be amply repaid over their remaining tenancy. Thoughtful discussions can often resolve these difficulties, and lead to sensible actions with sharing of costs, risks and savings. Options for developing a lease which shares the responsibility for energy efficiency are explored in GPG 324 ‘Leasing energy efficient offices’.
5 WHERE DOES THE ENERGY GO?
0 100 200 300 400 500 600 Good practice Typical Good practice Typical Good practice Typical Good practice Typical1
2
3
4
Annual kWh/m2 of treated floor area (TFA)
0 5 10 15 20 0 5 10 15 20 Good practice Typical Good practice Typical Good practice Typical Good practice Typical
1
2
3
4
Annual £/m2 of treated floor area (TFA) (including CCL but excluding VAT)
Good practice Typical Good practice Typical Good practice Typical Good practice Typical
1
2
3
4
Annual kgCO2/m2 of treated floor area (TFA)
0 50 100 150 200 250
Figure 1 Energy use indices (EUIs) for good practiceand typicalexamples of the four office types
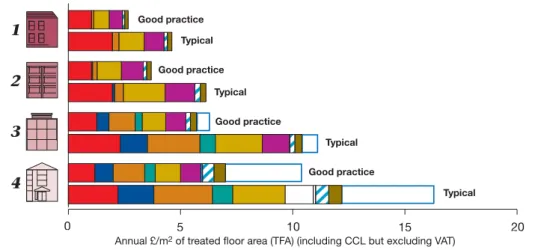
Figure 2 Energy cost indices (ECIs) for good practiceand typicalexamples of the four office types
Figure 3 Carbon dioxide emission indices (CEIs) for good practiceand typicalexamples of the four office types
Figures 1 to 3 show annual energy use indices (EUIs), energy cost indices (ECIs) and CO2emission indices (CEIs). CEIs are quoted in terms of kilograms of carbon dioxide per square metre treated area (kgCO2/m2) emitted annually. The data used to construct these graphs is in Appendix B.
In figures 2 and 3 the segments of the graphs for heating and hot water are a smaller percentage of the whole than in figure 1, because a kWh unit of gas is less expensive and incurs fewer CO2emissions compared with a unit of electricity which would commonly be consumed for the other energy uses. This puts a strong emphasis on the need for electrically heated buildings to be particularly efficient. Such buildings should be compared with the CO2benchmarks rather than delivered energy. It might be thought that the relative costs of gas and electricity are similar to the relative CO2
emissions, and superficially figures 2 and 3 appear alike. However, larger buildings – particularly those with large computer rooms operating continuously – usually pay less per unit of electricity than smaller offices with low voltage supplies and less uniform load profiles.
Consequently, the difference between large and small buildings is smaller in cost terms than it is in CO2.
KEY
Heating and hot water Cooling
Fans, pumps, controls Humidification Lighting Office equipment Catering, gas Catering, electricity Other electricity Computer room (where appropriate)
WHERE DOES THE ENERGY GO?
Variation in energy use between building types and end-uses reflects:
■ differing occupancy, servicing and equipment in each of the four types
■ wide ranges in efficiency and utilisation for different systems.
There are nine principal end uses for energy in office buildings relating to building services or occupiers’ equipment.
End uses (building services):
■ heating and hot water– by gas or oil
■ cooling– including chillers, packaged air-conditioning equipment, condensers and cooling towers
■ fans, pumps and controls
■ humidification– though rare, is spreading
in mechanically ventilated and air-conditioned buildings
■ lighting of the treated area.
End uses (occupiers’ equipment):
■ office equipment– excluding vending machines, local kitchens or equipment in dedicated rooms (eg computer suites and print rooms)
■ catering– including vending machines, kettles, dishwashers etc, and sometimes catering kitchens, shown in type 4 only
■ other electricity– including lifts, print rooms, and energy use outside the measured treated area, for instance by plant room or exterior lighting ■ computer and communications rooms– including air-conditioning of their dedicated suites. Energy use depends on the amount of equipment installed and can be substantial.
FOSSIL FUEL CONSUMPTION
EUIs increase gradually with office type but ECIs are similar because the larger buildings tend to pay less per unit.
Heating
No offices of any age should really exceed typicallevels. If they do, plant may be old, and control and management in need of attention. Heat energy use in air-conditioned buildings is particularly dependent upon maintenance, control and operation and it can often be reduced substantially.
For new offices, good practiceEUIs should be seen as the upper limit. If your figure is higher, the building may not be airtight (even if ‘sealed’, prefabricated structures and curtain walling systems can be very leaky) or systems may be poorly controlled and managed. In air-conditioned offices with 100% fresh air systems, excessive fresh air volumes should be avoided, and heat recovery and perimeter heating considered rather than using ventilation systems for preheating, etc. Catering, gas
Catering kitchens are often wasteful. To control costs and encourage more efficient practices, their gas, electricity and water should be sub-metered and catering contractors re-charged.
Hot water
This is seldom easily measured. EUIs and CEIs related to treated floor area are shown in table 2, to allow hot water to be separated from heating. These figures are based on systems which are both matched to hot water need and sensibly controlled.
Although EUIs for electric water heating are lower, CO2emissions are usually higher. However, some systems using central heating boilers can be very wasteful in summer when main distribution pipework remains in operation to serve small loads. This can often be detected from monthly meter readings. Independent gas or electric water heating may then be preferable. Where electric water heating is to be substituted for fossil fuel fired water heating, the comparison should be made in terms of CO2emissions, taking account of the existing central heating boiler, distribution and circulation losses which may give greater energy consumptions than the typical figures in table 2.
Hand washing Local electric 4 7 2.1 3.6
Hand washing Central gas boiler 7 10 1.3 1.9
Hand washing and
Central gas boiler 12 20 2.3 3.8
catering kitchen
kWh/m2TFA kgCO
2/m2TFA
Function Energy source Good
Typical Good Typical practice practice
Subdivision of benchmarks
Factors that affect the components of the benchmarks can be grouped in terms of the energy source used for each end purpose. The text in the shaded areas that follow describes each
factor. Particular attention should be paid to reducing electricity consumption relative to the benchmarks, as it costs more and results in more CO2production than fossil fuel use.
WHERE DOES THE ENERGY GO?
Cooling
Electricity for mechanical cooling is significant, but seldom as much as that for the pumps and fans which distribute the cooling. Cooling plant and the associated pumps need to be carefully managed to run only when there is genuine demand, and small 24-hour loads should be independently cooled.
Fans, pumps and controls
These often constitute the highest energy cost category in air-conditioned offices. In all-air systems, fans account for at least two-thirds of the total. Attention to air volumes, operating pressures and hours of use can bring large savings.
In all buildings, pumps sometimes run for long hours or even continuously, simply to service
small loads on the system. These loads might be better serviced independently – see section 6. Humidification
This is increasingly found in air-conditioned offices, particularly type 4. Systems are often wasteful, with unnecessarily high set points and needless operation in mild weather.
Lighting
This is another high end-use of electricity. Consumption depends on office type, utilisation of daylight, illuminance levels and hours of use. In open plan offices, where no individual has responsibility, efficient control of lighting is more difficult, and so lights usually stay on much longer than strictly necessary. Efficient installations and good, user-friendly controls should be the norm – see section 6.
OTHER ELECTRICITY CONSUMPTION Office equipment
Most office workers have a personal computer with dedicated or shared peripherals, and networking. Leaving equipment on unnecessarily – particularly overnight – should be discouraged (see section 6).
Catering, electricity
It is worth reviewing power requirements of vending machines and considering whether they can be switched off when the office is empty. All-electric catering kitchens should be compared with the CO2benchmarks for catering electricity and gas combined, rather than the total delivered energy.
Other
Electricity use by lifts and ancillaries, such as car park lighting and security systems, tends to rise with the complexity and sophistication of the building as a whole.
Air-conditioned computer suites and communications rooms
The amount of equipment in the computer suite, and thus the energy consumption, can vary widely. A dedicated computer suite (or room) should be accounted for separately to avoid distorting the comparison with the benchmark. In all cases, these areas and their air-conditioning should be individually metered and checked to ensure that the air-conditioning is performing efficiently. Computer air-conditioning systems are sometimes very wasteful. Typically, they use as much electricity as the computer equipment. In good practiceinstallations, consumption for air-conditioning can be reduced to about two-thirds of that used by the computers, and less if close humidity control is not required. BUILDING SERVICES ELECTRICITY CONSUMPTION
6 A CLOSER LOOK: SYSTEM AND COMPONENT BENCHMARKS
Comparing EUIs and other key indicators with benchmarks of various kinds can help you to assess the performance of individual systems. For example, data on installed power densities (IPDs) and hours of operation can provide useful insights into both efficiency and management, and point the way to improvement.
This section describes how energy consumption and performance indicators can be estimated for some key end uses, and gives benchmarks for the indicators.
When comparing values, it is important to check the areas concerned. For example, are office equipment load densities stated for the part of the office densely occupied by workstations, or for the treated floor area (TFA) of the whole building, including meeting rooms, corridors and so on? LIGHTING
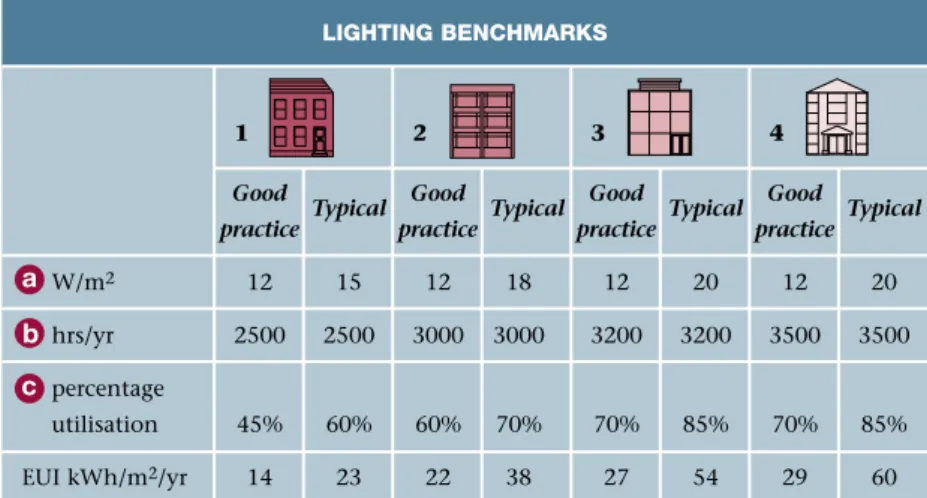
The annual EUI is the product of:
the installed power density (IPD) in W/m2 the hours of use of the lighting
the percentage utilisation. Benchmarks are given in table 3. IPD is estimated by:
■ adding up the wattage of all the lamps in an area ■ adding control gear losses for discharge and
fluorescent lighting (these typically add 20% to lamp rating, or 5% for high-frequency ballasts, but check manufacturer’s data)
■ dividing the total by the floor area.
For offices with a repeating luminaire ceiling pattern, only a representative ceiling module needs to be assessed.
The ‘hours of use’ is the annual period over which illumination (daylight or electric light) is needed in the offices, both for normal occupancy and for cleaning. Sometimes these are unnecessarily extended because lights are left on by, or for, the cleaners, who arrive much earlier or leave much later. Careful discipline and rearrangement of cleaning schedules can sometimes help. A lower illuminance level for cleaning will also reduce power consumption.
1 2 3 4
Good
Typical Good Typical Good Typical Good Typical practice practice practice practice
W/m2 12 15 12 18 12 20 12 20 hrs/yr 2500 2500 3000 3000 3200 3200 3500 3500 percentage utilisation 45% 60% 60% 70% 70% 85% 70% 85% EUI kWh/m2/yr 14 23 22 38 27 54 29 60 LIGHTING BENCHMARKS
Table 3 Lighting benchmarks LIGHTING IT RIGHT
In open-plan offices, the most efficient lighting installations tend to have: ■ well-designed lighting to suit the tasks and to make the space attractive ■ high-efficiency lamps (often high-frequency fluorescent) in efficient luminaires
that emit a high proportion of the light and control its distribution well ■ good local, preferably individual, control – for example, using pull switches,
hand-held infrared devices, or via the telephone – these can pay for themselves by simplifying wiring and minimising alterations when layouts and partitions are changed
■ lights which can be switched on and off locally by occupants (see GPG 160) and switched off automatically by occupancy sensors, or by a system which is properly programmed by a manager to take full account of occupiers’ needs and opinions
■ efficient circulation area lighting which is controlled separately, to prevent switching on more lights than necessary
■ occupancy sensors in areas which are intermittently used, such as washrooms ■ daylight sensors to switch off lights when they are not required.
The ‘percentage utilisation’ is the time the electric lighting is on during those hours. It depends how much the lighting is off or dimmed, either by successful use of daylight, occupants selecting lower illuminance levels, or lights being off in unoccupied areas. The percentage tends to decrease with better manual and automatic controls. As a general rule, automatic control works best to switch lights off or reduce their brightness when daylight is sufficient or people are absent. Provide occupants with the maximum amount of manual control appropriate, only automatically switching on where this is necessary for safety.
a
b
c
a
b
c
A CLOSER LOOK: SYSTEM AND COMPONENT BENCHMARKS
IPD can also be defined as the product of the desktop illuminance level (in lux) and the illumination efficiency in W/m2per 100 lux. The good practice benchmark of 12 W/m2is based on a level of 350-400 lux (often a good compromise between screen and paper-based tasks) at an efficiency of 3 W/m2per 100 lux. This efficiency level is obtainable with good luminaires and high-frequency fluorescent lighting, with a small allowance for decorative lighting. For 500 lux or an uplighting installation to 300-350 lux, an IPD of 15 W/m2may be required. If your installation has an IPD well above 20 W/m2, replacement will often be cost-effective, particularly with long hours of use. FANS, PUMPS AND CONTROLS
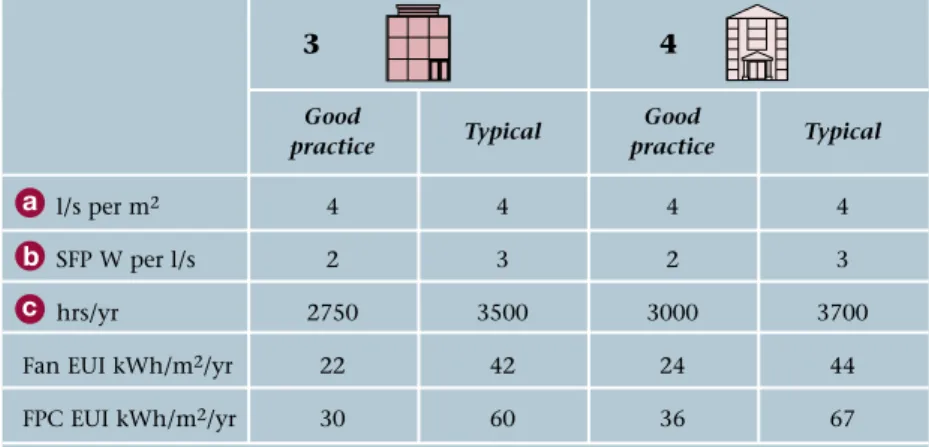
Air handling is one of the largest energy users in an air-conditioned office. Its EUI is the product of:
the amount of air handled – in litres/second per m2of TFA. This typically varies between about 1 and 8
the average efficiency with which it is handled – called specific fan power (SFP) – in watts per litre/second (W per l/s)
the annual hours run (hrs/yr).
For air-conditioning, SFP typically varies between 2 and 5 W per l/s. For energy-efficient systems a guideline of 1 W per l/s has been suggested, but this is difficult to attain except in simple systems or low speed operation.
While fans usually have to operate for normal occupancy periods, building operators should ensure that they do not run too liberally. Common reasons for extended operation of the whole system are that parts of the building continue in use into the evening, or that the building takes a long time to heat up or cool down prior to occupation at the start of the day. This extended running can be alleviated by careful zoning so that the only fans to function are those which serve the parts of the building in use, and by selecting heating or cooling systems which can pre-condition all or part of the building without operating all the fans.
Air handling benchmarks are given in table 4 together with the benchmark including fans, pumps and controls (FPC). Chilled water and heat rejection pumps are usually the largest contributors to the difference between fan and FPC
benchmarks.
Pump running hours can also show great variation. With good management, heating and cooling pumps operate for much less than normal occupancy hours – with heating ‘off’ in summer and cooling ‘off’ in winter and many mornings at other times. On the other hand, it is not uncommon to find chilled water and heat rejection pumps running continuously because some small 24-hour loads are connected to a central system. This can be very wasteful unless it is a variable capacity system, carefully designed for effective control and high efficiency at low load. In most cases, however, such loads are best given independent cooling systems.
3
4
Good
Typical Good Typical
practice practice
l/s per m2 4 4 4 4
SFP W per l/s 2 3 2 3
hrs/yr 2750 3500 3000 3700
Fan EUI kWh/m2/yr 22 42 24 44
FPC EUI kWh/m2/yr 30 60 36 67
The bottom line is the benchmark including pumps and controls; see appendix B.
Table 4 Air handling benchmarks
a
b
c
a
b
c
A CLOSER LOOK: SYSTEM AND COMPONENT BENCHMARKS
NOTE: the benchmarks do not include dealing rooms, which are highly variable and should be assessed separately. Computer and communications rooms are also very variable and in a separate category. See section 5.
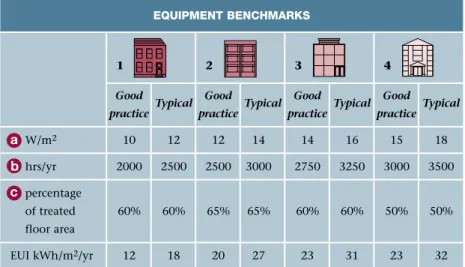
Table 5 Equipment benchmarks OFFICE EQUIPMENT
Typically, desktop and associated IT equipment such as computer, printers, modems and faxes average about 160 W per work location. A typical load density in an open plan office where nearly everyone has a computer is 15 W/m2, though there can be pockets with more, with high occupation densities, multiple screens, or both. Do not over-estimate cooling loads and the need for air-conditioning: nameplate ratings can be misleading (see Good Practice Guide (GPG) 118 ‘Managing energy use – minimising running costs of office equipment and related air-conditioning’). The benchmarks in table 5 are the product of:
the load density in W/m2
the average hours per year (this includes for about 10% of the equipment being on permanently)
the percentage of the floor area with IT equipment ie not including circulation space, meeting rooms, toilets, stores etc.
The benchmarks allow for more energy-efficient equipment selection and management in the good practicebuildings (see GPG 118). Avoiding unnecessary energy consumption is doubly important because it also reduces the heat output
of the equipment, and hence reduces overheating in naturally ventilated buildings and cooling loads in air-conditioned buildings.
Occupancy and equipment levels vary widely. Many small offices use less IT equipment less intensively, and their energy consumption will be lower. Some air-conditioned offices have high concentrations, though this is sometimes compensated for by liberal space standards in the building as a whole, particularly type 4.
Establish a purchasing policy to take account of energy requirements. Some brands and types of equipment use considerably less energy than others. Nameplate ratings can be unreliable and
independent checks may be needed (see GPG 118).
■
■
Standby modes are useful but not always energy efficient. Check what they do and that they are properly implemented. Encourage staff to turn idle systems off.
■
■
Don’t add to heat loads in the general office. Place equipment that doesn’t need to be there inseparate rooms, with local ventilation and cooling to suit.
■
■
1 2 3 4
Good
Typical Good Typical Good Typical Good Typical practice practice practice practice
W/m2 10 12 12 14 14 16 15 18 hrs/yr 2000 2500 2500 3000 2750 3250 3000 3500 percentage of treated 60% 60% 65% 65% 60% 60% 50% 50% floor area EUI kWh/m2/yr 12 18 20 27 23 31 23 32 EQUIPMENT BENCHMARKS
CHECKLIST FOR OFFICE EQUIPMENT
a
b
c
a
b
c
7 SUMMARY CHECKLISTS
Set up systems for energy management and tracking
ongoing performance (see GPG 200).
■
■
Advise general and facilities management on the appropriate use of benchmarks (see sections 1, 4 and 5).
■
■
Explain performance of systems and identifyopportunities for savings (see sections 5 and 6).
■
■
People respond to leadership. State and demonstrate a commitment to the environment and to energy efficiency.■
■
Make someone responsible for developing an energy policy (see GPG 186 ‘Developing an effective energy policy’). This will often be the facilities or technical services manager.■
■
Ask them to review energy costs in relation to simple benchmarks, and to make recommendations.Include landlord’s charges where appropriate.
■
■
Seek constant improvement. Review performance and agree standards, targets and actions at six-monthly intervals.■
■
Give energy measures the same priority as other comparable investment and management decisions. Good investment can save you money to devote to your
main business.
■
■
Remember the hidden benefits. Well-designed energy-efficient solutions not only reduce costs and environmental impact, but can also improve occupant
comfort, productivity, and the image of your organisation.
■
■
Obtain the support of senior management
(see senior managers’ checklist above).
■
■
State and demonstrate commitment to energyand environmental management
(see GPG 200 ‘A strategic approach to energy and
environmental management’).
■
■
Consider appropriate benchmarks and review energy costs and service charges. See sections 3 and 4, and appendix A. Set up a monitoring and targeting system for
continuous checks.
■
■
Understand your pattern of monthly energy use and how end-uses in your building relate to them. See other parts of this document and Fuel Efficiency
Booklet (FEB) 7 ‘Degree days’.
■
■
Review opportunities for improvement and identify areas for action. This includes control and management, fuel purchasing, and technical measures.
■
■
Review occupancy, operating and cleaning hours. Seek opportunities for better control and management.■
■
Assess end-use demands and identify improvementoptions. See sections 5 and 6.
■
■
Review time programmes and control settings to avoid waste. Common problems are excessive running hours of heating, ventilation and air-conditioning (HVAC) systems, particularly chilled water and humidification.
■
■
Make sure that small demands do not bring on large systems. For example security offices, control rooms and equipment rooms may need local heating or air-conditioning.■
■
Consider technical surveys to identify waste andopportunities for savings. If necessary ask technical specialists for further review, explanation and recommendations.
■
■
Be sure that contracts for plant operation andmaintenance include clauses on maintaining and improving energy efficiency. If not, don’t be surprised if services are run liberally and wastefully, because this is the easiest way of minimising occupant complaints.
■
■
Set up appropriate sub-metering. This is particularly important for areas with large and uncertain electrical loads,and to aid space charging.
■
■
Include catering energy costs in any catering contracts.
■
■
Involve staff and report clearly to senior management. To maintain their confidence, they will need to understandand comment on what you are doing.
■
■
Assess energy end-uses in terms of level of service, efficiency of provision, loading, hours of need and efficiency of control and management; and provide custom benchmarks (see section 6 and Appendix A p19).
■
■
FOR SENIOR MANAGERSFOR FACILITIES MANAGERS
APPENDIX A – CALCULATING AND USING INDICES
Determine building type
Choose the most appropriate category for your office from the four generic types described on page 7. (See page 19 if a single type is not applicable.)
Calculating the energy cost index
A
From the bills you have paid find out the total annual costs and units consumed for each fossil fuel and for electricity. You may need to make adjustments for estimated bills, missing data or periods of more or less than a full year (see GPG 310 ‘Degree days for energy management – a practical introduction’).B
Find out your floor area. Treated floor area will have to be measured, or estimated (see appendix B).C
Divide each cost in A by B to obtain your ECIs in annual fuel costs per unit area per fuel.Checking unit energy costs
■ Obtain your annual cost and energy consumption of each fuel from A.
■ If necessary, convert the annual units of each fuel consumed into kWh. Conversion factors can be found in appendix B.
■ For each fuel, divide annual cost by annual consumption to get the average unit cost per kWh.
Unit cost assessment
If the costs are very different from the average energy costs quoted in table B5 of appendix B, then there is probably a mistake. If after checking they are still high, then you may be able to purchase fuel
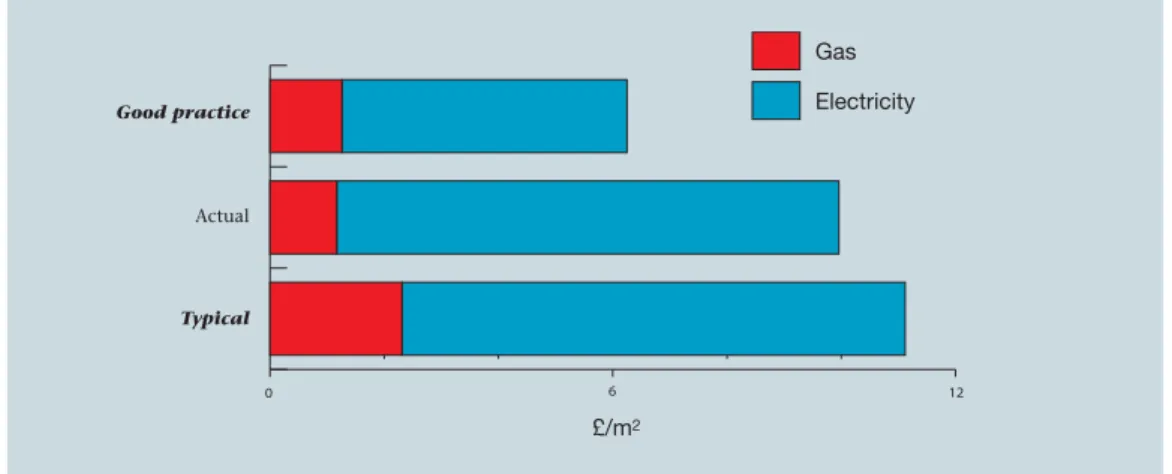
0 6 12 Good practice Actual Typical Gas Electricity £/m2
Figure A1 Annual energy costs in £/m2of treated floor area compared with good practice and
typical benchmarks for a type 3 building
more competitively unless your location or pattern of use is forcing up the unit rate (this should also be checked).
Choosing a benchmark
Choose good practiceand typicalECI benchmarks for your office type from table 1 (page 8), or from table B2 (appendix B) if you require more detail or different units.
Making the comparison
Comparison can be illustrated by histograms, which place the ECI for your building between the chosen benchmarks, as illustrated in figure A1. If your unit costs for any fuel are particularly high or low, you may need to correct the benchmarks to the rates you actually pay.
An ECI above typicalmerits further investigation: for example, you may have justifiably extended occupancy hours, although often this also leads to wasteful operation. Between typicaland good practiceit is likely that worthwhile savings can still be made. ECIs below good practiceare rare, but are potentially attainable in well-designed and well-managed buildings. Even with ECIs below good practice, scope for cost-effective savings can nearly always be found.
If your building has an ECI below good practice, Action Energy would be interested in collecting data on it. Please contact BRESEC at the address given on page 23 of this publication.
1
2
3
4
5
6
Appendix A illustrates the procedure required to calculate the Energy Cost Index (ECI). Energy use and CO2indices can becalculated and compared with benchmarks in a similar manner.
APPENDIX A – CALCULATING AND USING INDICES
Choosing benchmarks for other types of office If a single type does not describe your office very well, compare each of your indices with an area-weighted benchmark compiled from the pair that are most similar. For example:
■ for a naturally ventilated office with similar amounts of cellular and open-plan areas, your benchmark should be between types 1 and 2 ■ for an open-plan office with natural
ventilation plus some mechanical ventilation and cooling, pro-rata your benchmark between types 2 and 3. Offices of this type will include mixed-mode designs, and ones with comfort cooling provided by local packaged air-conditioning units
■ for a naturally ventilated open plan office with a staff restaurant, choose the components of the types 2 and 4 benchmarks in Appendix B which are relevant.
Tailored benchmarks allow you to evaluate offices with unique mixes of end uses. A benchmarking tool will be available from Spring 2003 at www.actionenergy.org.uk
Other systems
Offices with systems other than those covered by this Guide, including electric space heating, desiccant dehumidification, evaporative cooling, absorption refrigeration and combined heat and power, should be appraised in terms of their total CO2emissions.
Building data:
■ air-conditioned open plan ■ gross internal floor area = 3390 m2.
Determine building type: ■ type classification (page 7) ■ type 3 is appropriate
Calculating the energy cost index: A Collate data from bills (see above)
B Treated area estimate:
■ from appendix B (table B4), treated area is typically 90% of gross ■ 3390 x 0.9 = 3051 m2 C ECI calculation: ■ gas £3570/3051 = £1.17/m2/yr ■ electricity £26 818/3051 = £8.79/m2/yr ■ total £30 388/3051 = £9.96/m2/yr.
Checking unit energy costs: ■ unit gas cost
£3570/264 420 ≡1.35 p/kWh ■ unit electricity cost
£26 818/684 140 ≡3.92 p/kWh.
Unit cost assessment:
■ refer to appendix B (table B5) ■ the calculated p/kWh figures above
are close to typical for a type 3 office. Choosing a benchmark:
■ refer to table B2 (appendix B)
■ tabulate cost benchmarks ■ tabulate actual ECIs
(2c above)
Making the comparison:
Actual cost is close to typicalfor electricity and even lower than good practicefor gas. There is likely to be good scope for savings in electricity consumption. Action needs to be taken to investigate this.
Annual energy consumption from bills: gas ■ 264 420 kWh ■ cost = £3570 electricity ■ 684 140 kWh ■ cost = £26 818
1
2
3
4
5
6
A WORKED EXAMPLE Good practice 1.26 4.99 6.25 Actual 1.17 8.79 9.96 Typical 2.31 8.81 11.12 Display your benchmark data in tabular or histogramformat (see figure A1)
Annual energy costs £/m2
APPENDIX B – REFERENCE DATA
1 2 3 4
Good
Typical Good Typical Good Typical Good Typical practice practice practice practice Heating and hot water – gas or oil 79 151 79 151 97 178 107 201
Cooling 0 0 1 2 14 31 21 41
Fans, pumps, controls 2 6 4 8 30 60 36 67
Humidification (where fitted) 0 0 0 0 8 18 12 23
Lighting 14 23 22 38 27 54 29 60
Office equipment 12 18 20 27 23 31 23 32
Catering, gas 0 0 0 0 0 0 7 9
Catering, electricity 2 3 3 5 5 6 13 15
Other electricity 3 4 4 5 7 8 13 15
Computer room (where appropriate) 0 0 0 0 14 18 87 105
Total gas or oil 79 151 79 151 97 178 114 210
Total electricity 33 54 54 85 128 226 234 358
1 2 3 4
Good
Typical Good Typical Good Typical Good Typical practice practice practice practice Heating and hot water – gas or oil 1.03 1.96 1.03 1.96 1.26 2.31 1.18 2.21
Cooling 0.00 0.00 0.05 0.10 0.55 1.21 0.82 1.60
Fans, pumps, controls 0.10 0.29 0.20 0.39 1.17 2.34 1.40 2.61
Humidification (where fitted) 0.00 0.00 0.00 0.00 0.31 0.70 0.47 0.90
Lighting 0.69 1.13 1.08 1.86 1.05 2.11 1.13 2.34
Office equipment 0.59 0.88 0.98 1.32 0.90 1.21 0.90 1.25
Catering, gas 0.00 0.00 0.00 0.00 0.00 0.00 0.08 0.10
Catering, electricity 0.10 0.15 0.15 0.25 0.20 0.23 0.51 0.59
Other electricity 0.15 0.20 0.20 0.25 0.27 0.31 0.51 0.59
Computer room (where appropriate) 0.00 0.00 0.00 0.00 0.55 0.70 3.39 4.10
Total gas or oil 1.03 1.96 1.03 1.96 1.26 2.31 1.25 2.31
Total electricity 1.62 2.65 2.65 4.17 4.99 8.81 9.13 13.96
Total energy cost 2.65 4.61 3.68 6.13 6.25 11.12 10.38 16.27
Unit costs:
Gas (p/kWh) 1.30 1.30 1.30 1.30 1.30 1.30 1.10 1.10
Electricity (p/kWh) 4.90 4.90 4.90 4.90 3.90 3.90 3.90 3.90
Table B1 Annual delivered energy consumption (EUI) of good practiceand typical officesfor the four office types (kWh/m2treated floor area)
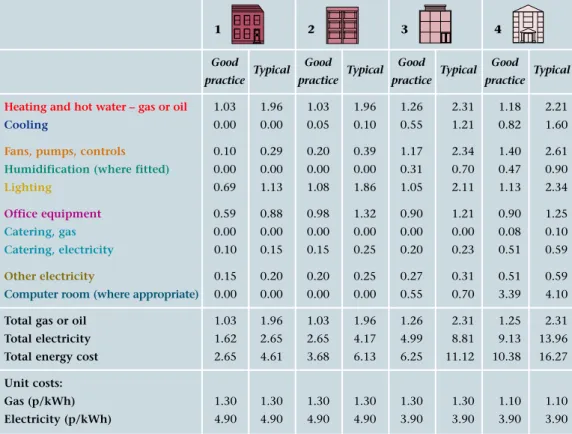
Table B2 Annual energy costs (ECI) (£/m2of treated floor area)
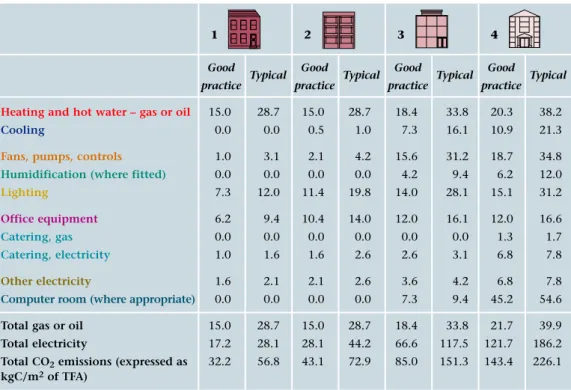
Table B1, B2 and B3 present in tabular form the data shown in figures 1, 2 and 3 (page 10)
APPENDIX B – REFERENCE DATA
NLA is often quoted in square feet. 1 square metre is 10.76 square feet. Estimating treated area
Treated floor area (TFA) is used as the denominator for energy indices in this Guide, because it is the area best related to energy consumption. It will often need to be estimated from NLA (available from agents’ details) or GIA (from design data). Area conversion factors vary from
building to building depending on geometry, spatial efficiency, and areas devoted to plant rooms, unheated storage, etc. Rules of thumb based on case study data are shown in table B4. Newer buildings often aim for higher ratios, for example by using efficient circulation, external escape stairs, and some roof-mounted plant.
These estimated values will be good enough for many purposes. If precise comparisons are required, measurement from scale plans may be necessary.
Type Treated % Nett % of Nett % of of gross treated gross
1 2 3 4
Good
Typical Good Typical Good Typical Good Typical practice practice practice practice Heating and hot water – gas or oil 15.0 28.7 15.0 28.7 18.4 33.8 20.3 38.2
Cooling 0.0 0.0 0.5 1.0 7.3 16.1 10.9 21.3
Fans, pumps, controls 1.0 3.1 2.1 4.2 15.6 31.2 18.7 34.8
Humidification (where fitted) 0.0 0.0 0.0 0.0 4.2 9.4 6.2 12.0
Lighting 7.3 12.0 11.4 19.8 14.0 28.1 15.1 31.2
Office equipment 6.2 9.4 10.4 14.0 12.0 16.1 12.0 16.6
Catering, gas 0.0 0.0 0.0 0.0 0.0 0.0 1.3 1.7
Catering, electricity 1.0 1.6 1.6 2.6 2.6 3.1 6.8 7.8
Other electricity 1.6 2.1 2.1 2.6 3.6 4.2 6.8 7.8
Computer room (where appropriate) 0.0 0.0 0.0 0.0 7.3 9.4 45.2 54.6
Total gas or oil 15.0 28.7 15.0 28.7 18.4 33.8 21.7 39.9
Total electricity 17.2 28.1 28.1 44.2 66.6 117.5 121.7 186.2
Total CO2emissions (expressed as 32.2 56.8 43.1 72.9 85.0 151.3 143.4 226.1
kgC/m2of TFA)
Table B3 Annual emissions of CO2(CEI) (kgCO2/m2of treated floor area) using CO2emission factors
of 0.19 kgCO2/kWh for gas and 0.52 kgCO2/kWh for electricity Delivered energy units
All energy units in this Guide are in kilowatt-hours (kWh), in which electricity and natural gas are usually billed.
1 kWh = 1000 Wh = 3.6 megajoules (MJ) 1000 kWh = 3.6 gigajoules (GJ). Conversion factors for oil are as follows: ■ gas-oil 10.6 kWh/litre
■ light fuel oil 11.2 kWh/litre ■ heavy fuel oil 11.4 kWh/litre.
Older gas bills may be in therms. 100 000 Btu = 1 therm = 29.31 kWh.
Floor area definitions
■ Gross internal area (GIA): total building area measured inside external walls. ■ Treated floor area (TFA): gross areas less
plant rooms and other areas (eg stores, covered car parking, and roof spaces) not directly heated. ■ Nett lettable area (NLA): GIA less common
areas and ancillary spaces. Agent’s lettable area.
1 95 80 76
2 95 80 76
3 90 80 72
4 85 80 68
APPENDIX B – REFERENCE DATA
Heating energy correction
Benchmarks for heating energy are corrected to a country-wide average of 2462 degree days per year. (See Introduction to Energy Efficiency in Offices (EEB 6) appendix 1 for adjustment for other degree days, and www.actionenergy.org.uk for degree day figures for different regions.) Energy indices
■ Energy use index (EUI). The annual delivered energy used by a building (or part of it) divided by a measure of its extent (usually the treated floor area). EUIs are normally split by fuel and frequently by end use. Ensure that the units of measurement for fuels, areas, and end uses are consistent with each other. EUIs in this Guide are expressed in kilowatt-hours per square metre kWh/m2of TFA, and all end uses are shown.
■ Energy cost index (ECI). As EUI but expressed in pounds and pence sterling per square metre of TFA.
■ Carbon dioxide emission index (CEI). As EUI, but expressed in kg of carbon/m2(kgC/m2). Conversion from delivered energy units to CO2 emissions is discussed below.
Specific fan power (SFP)
The total power input to the fans in a system (supply and exhaust if present) divided by the airflow rate. The values are the same, whether expressed as Watts per litre per second or kilowatts
per cubic metre per second, and both reduce to Joules per litre (J/l).
Average energy unit costs
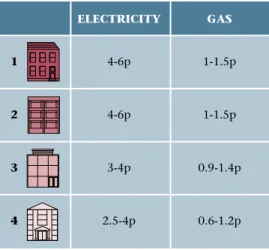
Fuel costs can vary widely with size and pattern of demand and with commercial factors. Table B5 shows the typical range of average unit costs at 2002 levels (total annual cost of the fuel concerned including standing charges and the CCL but not VAT, divided by total annual consumption in kWh). Organisations with large buildings or multi-site supply contracts may enjoy lower rates than these. Oil prices tend to be 20 - 50% more than gas but fluctuate more. Unit electricity and gas costs quoted by the Department of Trade and Industry for Q3 2002 are used elsewhere in this Guide.
1 4-6p 1-1.5p
2 4-6p 1-1.5p
3 3-4p 0.9-1.4p
4 2.5-4p 0.6-1.2p
Table B5 Average total cost per unit including CCL but excluding VAT
ELECTRICITY GAS
Carbon dioxide emissions
Each kWh of energy delivered to a building incurs atmospheric emissions of the major greenhouse gas CO2from the extraction, processing and delivery of each fuel and its consumption on site. CO2emissions in this Guide are quoted as kg of carbon dioxide per kWh of delivered fuel (kgCO2/kWh). Conversion from CO2to carbon is the ratio of their respective atomic weights (44:12). Quoted conversion factors vary according to the assumptions made. The table opposite shows the conversions used here, in carbon and carbon dioxide per kWh of delivered fuel. The conversion factor for electricity varies with the primary fuel mix used to generate it. In the UK, it fluctuates owing to changing efficiency of generation and a move from coal to gas and some renewables.
natural gas 0.052 0.19
oil 0.074 0.27
coal 0.087 0.32
electricity average 0.142 0.52
Fuel kgC/kWh kgCO2/kWh
Derived from National Atmospheric Emissions Inventory Annual Report and Digest of UK Energy Statstics 2002
FURTHER INFORMATION
General information
Office Service Charge Analysis Research (OSCAR), published annually by Jones Lang LaSalle 22 Hanover Square, London W1A 2BN
Tel 020 7493 6040. Fax 020 7457 3956 www.oscar.joneslanglasalle.co.uk
The British Institute of Facilities Management 67 High Street, Saffron Walden, Essex CB10 1AA Tel 01799 508606. Fax 01799 513237
www.bifm.org.uk
British Council for Offices (BCO) 38 Lombard Street, London EC3V 9BS Tel 020 7283 4588. Fax 020 7626 2223 www.bco.org.uk
Building Research Establishment Sustainable Energy Centre (BRESEC) Bucknalls Lane, Garston, Watford WD25 9XX Tel 01923 664000
www.bre.co.uk BREEAM
The Building Research Establishment Environmental Assessment Method (BREEAM) is an independent, and authoritative scheme that provides an assessment of the overall environmental performance of both new and existing office buildings. New industrial, food retail and domestic buildings are also covered. It presents a means of measuring and making visible a building’s environmental quality and provides a tool for optimising the performance of buildings throughout their life. Drawing on the latest scientific knowledge of the impacts of buildings on the environment, it provides a simple means of specifying and adopting current best environmental practice. For further information telephone 01923 664462. FURTHER READING
BRE Information Paper 3/95 ‘Comfort, control and energy efficiency in offices’
BRE Information Paper 6/96 ‘People and lighting controls’.
BRE/PA Office Toolkit
‘Best Practice in the Specification of Offices’. BCO, May 1997
Degree day information: www.actionenergy.org.uk. ™
The following publications are available from the Action Energy helpline. There may be other relevant documents in preparation. Contact details are given on the back page.
Good Practice Guides
16 Guide for installers of condensing boilers in commercial buildings
118 Managing energy use. Minimising running costs of office equipment and related air-conditioning
160 Electric lighting controls – a guide for designers, installers and users 186 Developing an effective energy policy 200 A strategic approach to energy and
environmental management
274 Environmentally smart buildings – a quantity surveyor’s guide
276 Managing for a better environment – minimising the running costs and impact of office equipment
285 What will energy efficiency do for your business?
287 The design team’s guide to environmentally smart buildings
290 Ventilation and cooling option appraisal – a client’s guide
310 Degree days for energy management 324 Leasing energy efficient offices General Information Report
31 Avoiding or minimising the use of air-conditioning. A report from the EnREI programme
48 Passive refurbishment at the Open University 56 Mixed mode systems and buildings
85 New ways of cooling New Practice Case Study 114 Inland Revenue Headquarters 115 Ionica Building, Cambridge 118 Comfort without air-conditioning in
refurbished offices
124 Edinburgh Gate Building, Harlow Introduction to Energy Efficiency 6 Offices
New Practice: monitors first commercial applications of new energy efficiency measures.
Future Practice: reports on joint R&D ventures into new energy efficiency measures.