Railway Level Crossing Incident
Costing Model
For the Rail Industry Safety and Standards Board
(RISSB)
Dr Richard Tooth, Matt Balmford
About LECG
LECG is a global expert services firm with highly credentialed experts and
professional staff with specialist knowledge in regulation, economics, financial and statistical theories and analysis, as well as in-depth knowledge of specific markets and industries. The company's experts provide independent testimony, original authoritative studies and strategic advice to both public and private sector clients including legislative, judicial, regulatory, policy and business decision-makers. LECG is listed on the NASDAQ Stock Exchange and has approximately 700 experts and professional staff worldwide. These experts are renowned academics, former senior government officials, experienced industry leaders and seasoned consultants.
CANBERRA
Level 6, 39 London Circuit PO Box 266
Canberra City ACT 2601, Australia Ph: (61 2) 6263 5941
Fax: (61 2) 6230 5269
SYDNEY
Level 14, 68 Pitt Street GPO Box 220
Sydney NSW 2001, Australia Ph: (61 2) 9234 0200 Fax: (61 2) 9234 0201 MELBOURNE
Level 2, 65 Southbank Boulevard Southbank VIC 3000, Australia Ph: (61 3) 9626 4333 Fax: (61 3) 9626 4321
WELLINGTON
Level 9, Axon House, 1 Willeston Street PO Box 587, Wellington 6001
Ph: (64 4) 472 0590 Fax: (64 4) 472 0596 AUCKLAND
Level 17, West Plaza Building 3-5 Albert Street
Auckland 1010
Ph: (64 9) 913 6240 Fax: (64 9) 913 4650
HONG KONG
3505-06 Tower Two, Lippo Centre 89 Queensway
Admiralty, Hong Kong Ph: (852) 2106 3800 Fax: (852) 2106 3999
For information on this report please contact:
Name: Dr Richard Tooth Telephone: (02) 9234 0216 Email: [email protected]
Railway Level Crossing Incident Costing Model ii
Table of Contents
Executive Summary ... 1
1 Introduction ... 3
2 Purpose and Approach ... 4
2.1 Purpose ... 4
2.2 Definitions and cost categories ... 4
2.3 Cost estimation approach and data sources ... 5
2.4 Indexation of costs... 8
3 Human costs ... 9
3.1 Principles ... 9
3.2 Quantity and categorisation of human costs ... 11
3.3 Unit value for life and injuries ... 12
3.4 Alternative human capital approach ... 14
4 Property damage and recovery costs ... 14
4.1 Rail fixed structures and rolling stock ... 14
4.2 Damaged freight ... 16
4.3 Site recovery ... 16
4.4 Service recovery ... 16
4.5 Road vehicle damage ... 17
4.6 Summary of property damage costs ... 18
5 Other Costs ... 19
5.1 Delays ... 19
5.2 Police and emergency services costs ... 20
5.3 Safety investigation costs ... 20
5.4 Insurance administration and legal costs ... 21
5.5 Cost of train and motor vehicle unavailability ... 21
5.6 Costs not otherwise captured ... 21
5.7 Summary of other costs ... 21
6 The annual cost of level crossing incidents ... 23
6.1 National data available ... 23
6.2 Estimating an annual cost ... 27
Executive Summary
A better understanding of socio-economic costs from railway crossing incidents can help the rail industry and its stakeholders better evaluate the benefits of road and rail safety measures.
This report outlines the structure of a user-friendly spreadsheet-based model that can be employed by the rail industry to calculate the economic cost of railway level crossing incidents.
This incident costing model uses information that should be available from the
‘Incidence Occurrence Report Form’ provided to rail safety regulators and from internal rail operator financial reporting. Based on information entered (and using defaults where incident-specific data is not available) the model estimates the human, property damage and other costs of a railway crossing incident. Cost information and default values are based on existing Australian economic and industry literature.
The spreadsheet model ‘Level Crossing Incident Costing Model – 280410 – final - protected.xls’ is also provided with this report. The spreadsheet includes an Incident Form to input information as well as definitions, instructions and frequently asked questions.
A key issue for the model is the estimate of human costs. There is some debate in how the value of reducing risks to life (measured in terms of value of statistical life, VSL) should be estimated. Consistent with international practice and that employed by the NSW Roads and Traffic Authority (RTA) based on the most recent Australian research, we use the willingness to pay (WTP) method that estimates the VSL at around
$6 million.
This report also uses the incident model combined with available data on the frequency of incidents to estimate the overall cost for railway level crossing incidents in a typical recent year. A summary of the results is provided in Table 1 below. The most significant costs are the assumed 15 human fatalities which represent around 75 per cent of the total costs.
As railway crossing incidents are infrequent but severe, historical averages may not be a good guide. Furthermore there is some differences in existing data sources on the number fatalities, with Australian Transport Safety Bureau (ATSB) (2004) showing over 40 level crossing fatalities in some recent years. Assuming a higher number of fatalities would substantially increase the overall cost.
The overall amount in Table 1 of $116 million is around 2.5 times greater (in real terms) than the annual cost of level crossing incidents most recently estimated by the Bureau of Transport and Regional Economics (BTRE) (2002). The key differences are a more appropriate valuation of human costs and an inclusion of property damage costs.
Railway Level Crossing Incident Costing Model 2 Table 1
Annual cost of level crossing incidents (2010)
Cost Per cent
of total
Key assumptions
Human costs $106,470,352 92% Based on averages of 15 fatalities, 50 severe injuries and 50 minor injuries. 65% urban, 35% non-urban.
Property damage – subtotal $5,764,700 5%
Rail fixed structures and rolling stock
$4,240,198 Derailments in 25% of road incidents and 5% of passenger incidents
Road vehicle $1,524,502 60 incidents per year involving vehicles,
with 60% light passenger vehicles, 20% rigid trucks, 20% articulated trucks.
Other – subtotal $4,044,765 3%
Police & emergency services $557,341 70 incidents per year involving either
vehicles and pedestrians
Delay costs $593,519
Safety investigation $236,760
Insurance administration & legal $3,156,806
Road vehicle unavailability $93,858
TOTAL $116,279,817 100%
Notes: Indicative costs only. Based on historical averages for number of incidents and casualties. Does not include suicides.
1
Introduction
Railway level crossing incidents are a significant social issue and one of particular concern for the Australasian Railway Association (ARA) and the Rail Industry Safety and Standards Board (RISSB). There are generally around 80 level crossing incidents per year in Australia. Although much less frequent than road crashes, railway level crossing incidents often involve fatalities and/or serious injuries and have the potential to cause multiple fatalities.
A better understanding of socio-economic costs from railway crossing incidents can help the rail industry and its stakeholders better evaluate the benefits of road and rail safety measures.
A level crossing incident costing model has been developed to help the rail industry estimate the economic cost of level crossing incidents. The following document outlines the make-up of the incident costing model and the general frameworks and assumptions that underlie it.
Railway Level Crossing Incident Costing Model 4
2
Purpose and Approach
2.1
Purpose
RISSB engaged LECG in January 2010 to develop a model to estimate the economic costs of railway level crossing incidents and create a user-friendly spreadsheet-based model (and accompanying instructions) that can be used by the rail industry as a national tool to calculate the cost of railway level crossing incidents.
The focus of the model and spreadsheet is the cost of specific individual level crossing incidents, rather than the aggregated cost of all incidents in a specific year. However, the incident model is also used to estimate the aggregate average annual economic cost of railway level crossing incidents.
2.2
Definitions and cost categories
Railway level crossings are defined as “a location where a public or private roadway, footpath, or both, crosses one or more railway tracks at grade”. A level crossing incident occurrence is generally defined as:
• “any collision of a train or rolling stock with either a road vehicle, person, level crossing safety equipment or gate, or
• any other occurrence that endangers or has the potential to endanger the safety of a railway operators or level crossing operators at a level crossing.”1
Only collisions with a road vehicle or a person2 at a level crossing are considered relevant incidents. Warning equipment failure, third party damage to or interference with equipment and near misses are not incorporated.
The broad approach involves separately estimating the different costs associated with level crossing incidents. There are a number of costs associated with railway level crossing incidents. These include (see Table 2 below):
• Human costs including costs associated with treatment and care of those injured and the costs associated with loss of life and quality of life;
1
Guideline for the Top Event Classification of Notifiable Occurrences, Occurrence Classification – Guideline One (OC-G1), June 2008
2
• Property damage and recovery costs including damage to fixed rail structures, rolling stock and road vehicles, and also the costs associated with site and passenger recovery; and
• Other costs including police and emergency services, travel delays to passenger and freight movements, safety investigation and insurance administration.
Table 2
Costs of railway level crossing incidents
Borne by companies/individuals involved & their insurers
Borne by others
Human costs Treatment (inc, medical, ambulance,
rehabilitation & long-term care) Lost labour (workplace and household) Loss of life and quality of life
Legal costs
Premature funeral expenses
Publicly funded treatment Correctional services Coroner, funeral Workplace disruption Additional local air pollution
Pain and suffering of friends and relatives
Property damage and recovery
Fixed structure, rolling stock and road vehicle repairs and replacement Unavailability of vehicles Lost and damaged freight Site and passenger recovery
-
Other costs Insurance administration
(Company) safety investigation
Travel delays
Police, fire and emergency services (Regulator/ATSB) safety investigation
Source: Adapted from BITRE 2010
In practice, many of the costs included in Table 2 above can be aggregated and summarised. Thus for example, an estimate of a single human cost per fatality can incorporate all the human costs associated with a typical fatality.
2.3
Cost estimation approach and data sources
The approach to estimating these costs is largely driven by two key factors, these being: • the purpose of the analysis;
Railway Level Crossing Incident Costing Model 6 The purpose of the analysis is important, particularly in determining the approach to
estimating human costs. For this work we have assumed the primary purpose is to help inform future policy towards railway crossing incidents, that is we are interested in the societal benefit of preventing future similar incidents.
The available information is also very relevant. For each type of cost, the model requires an estimate of the quantity (e.g. number of serious injuries) and the unit value (e.g. value per injury).
Ideally, incident-specific information would be available to be used in the model. In practice standard values (i.e. default values) need to be used.
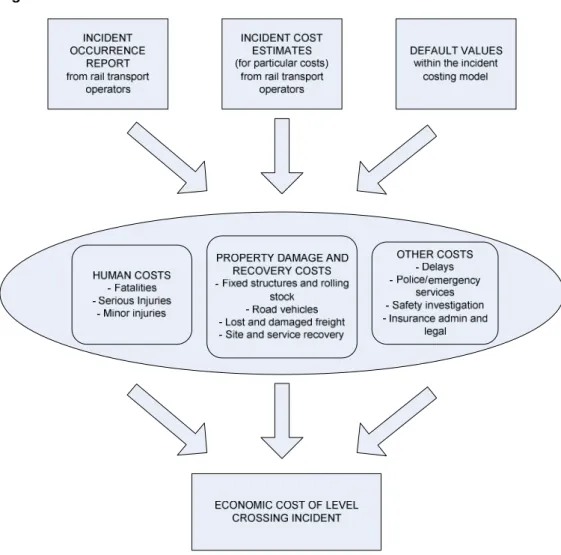
Figure 1 below summarises the approach to sourcing information and how this is utilised in the model to generate the economic cost of a level crossing incident.
Where possible, the incident costing model is built from industry standards in the reporting and tracking of rail safety incident data. Incident-specific input data should be readily available for Notifiable Occurrence Reports completed by rail transport
operators and rail transport operator internal cost estimates for insurance claims. Where incident-specific data is not available for particular quantities or unit values, the model uses default values as discussed in this document.
Default values are drawn from a number of different sources and are based on assumptions used in the relevant economic literature including the Australian
Government Bureau of Infrastructure, Transport and Regional Economics and the NSW Roads and Traffic Authority. In some cases there is choice as to which source of information is used and/or to what level of detail data is examined. In general, as discussed in the approach, industry standard measures are used to ensure consistency with similar analysis – with the focus on balancing accurate cost estimation with simplicity of general use.
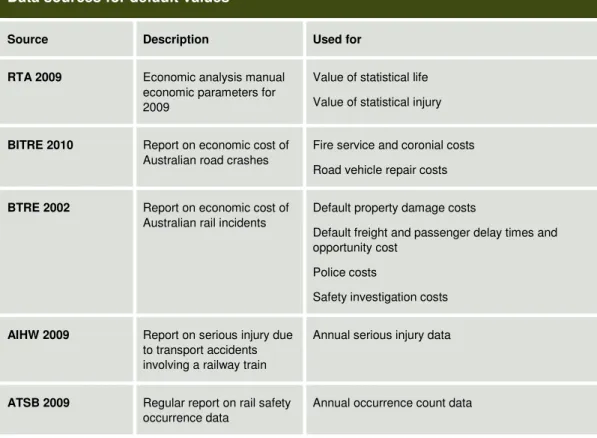
Table 3 below outlines the main sources of data, and how the default values are used (see References for complete titles).
Table 3
Data sources for default values
Source Description Used for
RTA 2009 Economic analysis manual
economic parameters for 2009
Value of statistical life Value of statistical injury
BITRE 2010 Report on economic cost of
Australian road crashes
Fire service and coronial costs Road vehicle repair costs
BTRE 2002 Report on economic cost of
Australian rail incidents
Default property damage costs
Default freight and passenger delay times and opportunity cost
Police costs
Safety investigation costs
AIHW 2009 Report on serious injury due
to transport accidents involving a railway train
Annual serious injury data
ATSB 2009 Regular report on rail safety
occurrence data
Railway Level Crossing Incident Costing Model 8
RSRP 2008 Review of national level
crossing statistics
Annual fatality data
Australian Bureau of Statistics (ABS)
Regularly updated data series
Indices for updating unit costs
2.4
Indexation of costs
As the model draws information from estimates at different times and the model will be applied in different years, values need to be adjusted to the year of analysis.
Costs indices are used to index historical incident costs to express them in terms of the contemporary year – or some other year that the user may prefer. The appropriate index differs by cost category.
For human costs, an appropriate index is the Australian Bureau of Statistics (ABS) average weekly earnings – all employees (series A2810232W).
For most property costs, an appropriate index is ABS producer price index for transport equipment manufacturing (series A2312468R).
For road vehicle costs, an appropriate index is ABS consumer price index for motor vehicle repair and servicing (series A2328771A).
For damaged freight, site recovery, service recovery, train unavailability, costs not otherwise captured and various other costs, an appropriate index is ABS producer price index – final – domestic consumer (series A2314832K).
To express costs in terms of years 2010 to 2013, the trends in these indexes have been forecast using linear projections. We recommend that all unit cost estimates are revised annually using these cost indices. The indices are available from the ABS free of charge.
3
Human costs
3.1
Principles
The division between human costs and property damage is an important one. Property can be replaced, human life cannot. Furthermore, there are market determined prices for the replacement or repair of most property. Whereas there are market prices for many treatment costs, there is no market price for the loss of life and quality of life.
How costs for loss of life and quality of life are expressed depends on our purpose3. For the purposes of this work a forward-looking policy approach is assumed.
Taking a forward looking approach to costing simplifies the problem of estimating human costs. We do not wish to value life but rather to value a change in the risk to life. This is achievable. Every day people make decisions that trade-off risk to their lives against other benefits. For example, people may choose to pay more to fly on a safer airline, or take more time crossing a road by crossing at a safer location. In making these decisions, people exhibit a willingness to pay (or willingness to accept) for a change in the risk to their life.
For policy analysis of road crashes, it is society’s willingness to pay (WTP) to reduce the risk of loss of life and quality of life that is relevant.4 For ease of use, policy makers use an amount in terms of the expected value of preventing a single future unknown fatality. This value is most commonly described as a value of statistical life (VSL) but it is perhaps more easily understood as the equivalent term value of a preventable fatality
(VPF) or value of risk reduction (VRR). This paper uses the common term VSL. The VSL has been estimated using different methods with significantly different results (see Box 1). We recommend that the WTP method be applied as this is the conceptually superior method5 and there are now Australian estimates that can be used (based on research commissioned by the NSW Roads and Traffic Authority) which are consistent with international research.
3
For example, different ‘costs’ estimate would apply depending on whether the purpose was to determine compensation for those impacted, to forecast the impact on the market economy, or to assess policies and activities that might change the likelihood of level crossing incidents.
4
As discussed in the report, willingness to accept (WTA) a change in risk may also be relevant.
5
The BITRE has stated that “conceptually, the WTP approach is the superior approach [relative to alternative approaches such as human capital] as it tries to reflect people’s preferences, consistent with economic welfare theory.”, BITRE 2010, p.20
Railway Level Crossing Incident Costing Model 10 Box 1
Estimating the value of statistical life (VSL)
There are a number of approaches to estimating VSL. The two most common approaches are described as the ‘human capital’ approach and the WTP
approach. The common applications of the human capital method (including that used in the recent BITRE 2010 study) do not attempt to measure the WTP to reduce risks and as a result consistently produce values significantly lower than WTP estimates. There is greater uncertainty in estimating VSL by the WTP method but there is no apparent bias.
The WTP method involves attempting to directly estimate WTP to reduce risk to life. Broadly there have been two methods to the WTP approach to estimating VSL. These are based on stated preference (i.e. what people say are their preferences) and revealed preferences (i.e. based on what people pay for higher safety).
In Australia and internationally there have been a number of studies. For example, a recent meta-study by Access Economics (2008) included an analysis of 99 Australian and international studies which ‘yielded an average VSL of A$6.0 million in 2006 Australian dollars’.
Value of statistical injury
In theory the approach to valuing risk of injury should be similar to that valuing risk of fatality. The value of a statistical injury is equal to:
• An individual’s WTP to avoid the injury; plus
• Other costs not borne by the individual. These include public medical costs, workplace disruption and costs borne by private insurers.
In practice there are some challenges. Firstly, there is much less information on what people are willing to pay to avoiding a risk to injury. Secondly, it is difficult to identify public health costs.
The BITRE (2010) and the NSW RTA provide estimates of the value of risk of injury by severity category. While both sources are not ideal due to various methodological issues, they are the best sources currently available. We understand that at the time of writing the NSW RTA costs are being revised.
Discussing costs
Care is required in how human costs are portrayed. With property damage we can express the costs in terms of what it will cost to repair or replace the property.
Thus in expressing human costs we can more accurately state
“The incident caused the loss of a life and property damage which will cost $300,000 to repair.
Alternatively
“The public benefit of preventing such an incident is estimated at $6.3 million.”
3.2
Quantity and categorisation of human costs
The impact in terms of human costs varies substantially with the severity of an incident. The cost of injuries varies greatly depending on the severity of the injury, thus some level of categorisation is necessary. However the true severity of an injury is not often known at the time of the incident.
For the purposes of costing a single incident, a pragmatic categorisation is that captured on rail safety regulators’ incident occurrence forms. These forms divide injuries into four basic levels of severity.
Table 4
Human cost – definitions
Description
Fatality A person who dies, within 30 days of a railway occurrence, from injuries
sustained in that occurrence.
Serious Personal Injury
A person admitted to hospital as the result of injuries sustained in a railway occurrence who does not die within 30 days of the occurrence.
Minor Injury A person injured and requiring medical attention as a result of a railway occurrence but not admitted to hospital who does not die within 30 days of the occurrence.
Non Medical Injuries Effectively property only damage – no medical treatment was required
Source: Standard No. ON – S1and OC-G1, June 2008
We do not recommend further categorisation of human costs by other individual characteristics for a number of reasons (see Box 2).
Railway Level Crossing Incident Costing Model 12 Box 2
Should human costs vary with individual characteristics?
As we might expect, people’s WTP to avoid risk of fatality and injury vary significantly with people’s individual characteristics. WTP based estimates of VSL are found to vary with a number of factors including age, income, gender and other characteristics.
Given such variation, should the VSL vary with individual characteristics? For the purposes of the incident costing model, we strongly recommend that it should not for a number of reasons.
First, the purpose of the analysis is forward looking to help determine the benefits of avoiding future incidents. Thus characteristics of the individual involved in an incident are of no interest other than providing an indication of the types of incidents that might occur in the future.
Second, valuing life based on individual attributes is likely to be sensitive for a number of stakeholders. Viscusi (2008) noted that the US Environmental Protection Authority’s attempt to introduce distinctions of VSL by age ‘set off a political firestorm.’
Third, is that it is not practical as the information collected for rail safety purposes is unlikely to include the full range of potentially relevant individual characteristics.
3.3
Unit value for life and injuries
Estimates of the VSL by injury category are available from BITRE 2010 and from RTA. We generally recommend use of the RTA estimates as these incorporate WTP method values for fatalities and injuries and are updated on an annual basis. At the time of writing the values are as follows:
Table 5
Values per fatality and injury (WTP)
Urban Non-urban
Fatality $5,732,305 $6,287,873
Serious injury resulting in
permanent disability $421,040 $586,375
Other injury $69,831 $99,612
Other $8,369 $8,369
Source: RTA 2009 Appendix A, Table 17, p.15 (2010 value)
We understand that these WTP figures provided by the RTA are intended to incorporate the medical and care costs associated with casualties – thus these medical and care costs have not been separately incorporated into the model.
We understand that the values are in the process of being updated by RTA. For the incident costing model, these values are combined with direct input of the incident casualty numbers for a particular incident. For calculating aggregate costs, the model incorporates national fatality and serious injury data to account for most relevant human costs.
RTA sourced its WTP values from a 2008 report by PricewaterhouseCoopers (PwC) in conjunction with the Hensher Group, commissioned by RTA. However, the PwC report breaks down the above table’s ‘Other injury’ category into two categories: injuries requiring hospitalisation but not resulting in permanent disabilities, and minor injuries (those not requiring hospitalisation).
As rail industry data collection tends not to distinguish between the seriously injured that did and did not suffer permanent disability, we have estimated a WTP value for all serious injuries using a weighted average of the PwC values. The weight is derived from BTRE 2002 which stated that, in 1999, four of the 47 persons seriously injured in rail accidents (or around 8.5%) were thought to have suffered permanent disability. In 2010 dollars, the resultant serious injury values are $157,972 for urban and $247,205 for non-urban respectively.
These WTP values exclude hospitalisation costs not borne by the individual involved (for example, those costs borne by government). We assume these costs are $113,912 (2010 value) per serious injury. This value is generated by removing workplace and household losses and non-economic or non-pecuniary costs from BITRE 2010’s human related costs associated with (road crash) hospitalised injuries, and dividing this by the number (31,204) of hospitalised injuries.
Railway Level Crossing Incident Costing Model 14 The PwC report ‘minor injury’ value is also utilised by the model.
The resultant WTP values used by the model are shown in the following table. Table 6
Values per fatality and injury (WTP) (2010 dollars)
Urban Non-urban
Fatality $5,732,305 $6,287,873
Serious injury $271,884 $361,117
Minor injury $41,077 $61,616
3.4
Alternative human capital approach
While the model default is WTP, some purposes may require the use of the traditional human capital approach when estimating human costs. The model incorporates the option to select a human capital approach.
The human capital values are sourced from BITRE 2010 (p. xiv) and are $2,400,000 for a fatality, $214,000 for a serious injury and $2,100 for a minor injury (all in 2006 dollars).
4
Property damage and recovery costs
Property damage as a result of a level crossing incident principally relates to above and below rail line infrastructure (fixed structures and rolling stock) and, where relevant, road vehicles damaged as a result of the incident. For this analysis, it also incorporates the site and service recovery and clean-up costs as a result of a level crossing incident.
4.1
Rail fixed structures and rolling stock
Repair and replacement costs are the best available measure for the economic cost of damage to rail infrastructure.
The BTRE 2002 report Rail Accident Costs in Australia is the primary source for default data on rail property damage. The BTRE defines property damage as including ‘the replacement or repair costs of accident-related damages to all fixed structures and rolling stock affected’.
The model uses the following data sourced from BTRE 2002:
• an average cost for all rail derailments ($177,776 in 1999 dollars);
• an average cost for rail accidents attributable to trespassers ($3,508 in 1999 dollars); and
• an average cost for rail accidents involving motor vehicles ($14,225 in 1999 dollars).
The report acknowledges that there are substantial data quality issues with these cost estimates. For example, costs associated with level crossing incidents involving motor vehicles are not further categorised by type of vehicle involved.
Consequently, where possible for incident costing, it is preferable to use incident-specific property damage data related to fixed structures and rolling stock – particularly for major incidents.
For example, the repair cost provided to LECG by one rail operator for a major level crossing incident with a heavy freight vehicle that resulted in derailment was in the millions of dollars.
To facilitate data input from potentially different sources, costs are treated separately in the model for three categories: fixed structures, rolling stock (locomotive) and rolling stock (wagons/carriages).
As a default, costs for fixed structures are assumed to be zero. The Australian Rail Track Commission informally advised us that it is very rare for fixed infrastructure owners to have any damage as a result of level crossing incidents.
For a collision that does not result in a derailment, the default values assume:
• costs for locomotives equipment equivalent to the BTRE’s property damage costs for rail accidents attributable to trespassers ($3,508 in 1999 dollars), for collisions involving pedestrians, and rail accidents involving motor vehicles ($14,225 in 1999 dollars), for collisions involving road vehicles; and
• zero costs for wagons/carriages.
For collisions that involve derailment, the default values assume: • the same costs for locomotives as for non-derailment incidents; and
• costs equivalent to BTRE average costs for rail derailments minus the locomotive costs for a collision with a road vehicle ($163,551 in 1999 dollars), for
wagons/carriages.
Railway Level Crossing Incident Costing Model 16
4.2
Damaged freight
Due to the diversity of freight and other cargo carried by trains, it is not possible to provide average values for the economic cost of materials that are lost or damaged as a result of level crossing incidents.
BTRE 2002 stated that “no attempt was made to estimate the value of lost cargo as insufficient data were available to develop a defensive estimation procedure”.
The model allows for direct input of actual/estimated value of lost and (unrecoverable) damaged freight, should it be relevant for the particular level crossing incident. If there is no direct data input, no cost is attributed.
4.3
Site recovery
This category incorporates the costs associated with restoring the site of a level crossing incident, principally:6
• cost of crane hire and other site rolling stock recovery and relocation costs; and • costs of cleaning the sites affected, including control and restoration of any
dangerous goods spilled.
BTRE 2002 suggests total site recovery and clean-up costs arising from all rail accidents is around $230,000 (1999 dollars) but does not state any per-incident or level crossing incident-specific values.
As with damaged freight, site recovery costs are likely to be known by rail operators and other involved parties for particular level crossing incidents, and the model allows for direct input of actual/estimated cost of recovery costs. If there is no direct data input, no cost is attributed – although costs may be partly subsumed in fire brigade costs.
4.4
Service recovery
This category incorporates the costs associated with continuing passenger or freight services given the level crossing incident. A major example would be the cost of relocating rail passengers, for example through avoidable costs of buses, flights and coaches and in some cases accommodation.
As with damaged freight and site recovery, service recovery costs are likely to be known by rail operators and other involved parties for particular level crossing incidents, and
6
the model allows for direct input of actual/estimated cost of recovery costs. If there is no direct data input, no cost is attributed.
4.5
Road vehicle damage
The major non-rail property cost associated with level crossing incidents is the damage to motor vehicles involved in relevant incidents. There is no available data set that specifically articulates these damage costs.
BTRE 2002 does not estimate the damage costs for vehicles involved in level crossing incidents, but BITRE 2010 gives estimates for repair costs across all road crashes, for different types of vehicles. This is likely to be a lower bound for road vehicles involved in level crossing incidents as we expect much more severe damage to be caused to the vehicle.
The 2008 AAMI Crash Index report (based on 2007 data) states that crash-related car rollovers (effectively, write-offs) cost an average $11,147. This is 3.325 times the year-equivalent car repair cost by BITRE 2010.
The model therefore incorporates a choice to indicate a minor crash or major crash for the road vehicle. For a minor crash, the BITRE 2010 repair estimates are used. For a major crash, the BITRE 2010 repair estimates are multiplied by 3.325, as a standard multiplier.
The current OC-G1 rail safety data classification standard does not include a classification for type of road vehicle involved in a relevant rail safety incident. Most jurisdictions include some sort of vehicle classification in their occurrence notification forms, but this varies between jurisdictions. For example:
• NSW uses light passenger vehicle, heavy freight vehicle, dangerous goods vehicle, bus, motorcycle, other;
• Queensland uses light passenger vehicle, light freight vehicle, heavy freight vehicle, articulated combinations, bus, motorcycle, farm machinery, bicycle, other. The Railway Safety Regulators’ Panel’s Review of National Level Crossing Statistics
(September 2008) states that introducing sub-categories for occurrences that involve Road Motor Vehicles will be referred to the National Rail Occurrence Database (NROD) Working Group for consideration during revision of the standard, as well as other
projects such as the NTC Data Strategy.
Balancing the data collected and available data on road vehicle crash costs, the model uses the following definitions, adapted from ON-S1. Crash repair costs are taken from BITRE 2010. This is one area of the incident costing model that should be updated as occurrence data standards are updated.
Railway Level Crossing Incident Costing Model 18 Table 7
Road vehicle type definition for rail level crossing incidents
Road vehicle type Definition Minor crash
repair cost (2006 dollars) Major crash repair cost (2006 dollars)
Light passenger vehicle Car (sedan, utility, station wagon, 4WD), light commercials (<4.5t), delivery vans, mini-buses (maximum capacity 12 passengers)
$2,989 $9,938 Heavy freight vehicle –
rigid truck
Medium rigid trucks $12,000 $39,900 Heavy freight vehicle –
articulated truck
Semi trailers, B doubles, road trains, fuel tankers and tankers containing other dangerous goods
$31,400 $104,405 Buses Buses with a capacity greater than 12
passengers
$9,523 $31,664 Motorcycles Motorcycles, motorised scooters $3,233 $10,750 Bicycles Bicycles while being ridden $0 $0
Source: Adapted from ON-S1 revision 2, 13 June 2008; BITRE 2010; 2008 AAMI Crash Index report
4.6
Summary of property damage costs
Table 8 below outlines the costs detailed in this section in terms of today’s (2010) dollars.
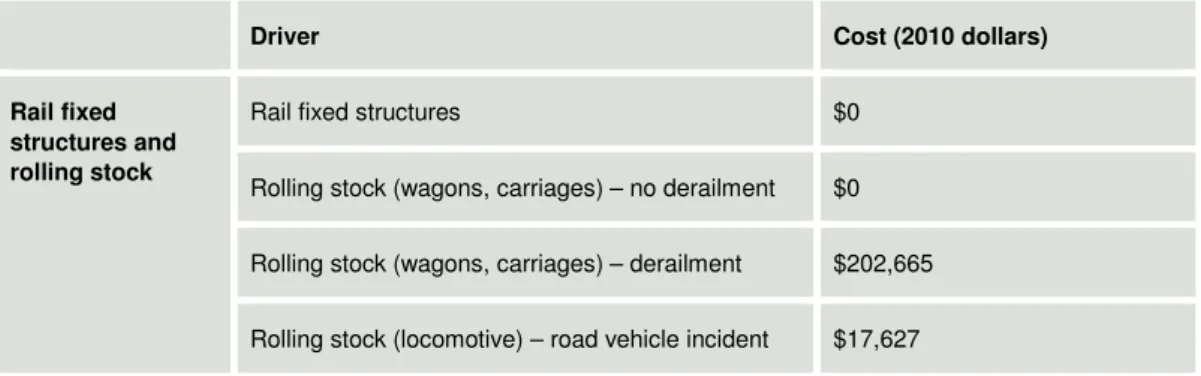
Table 8
Default property damage costs summary – per crash (2010 dollars)
Driver Cost (2010 dollars)
Rail fixed structures and rolling stock
Rail fixed structures $0 Rolling stock (wagons, carriages) – no derailment $0 Rolling stock (wagons, carriages) – derailment $202,665 Rolling stock (locomotive) – road vehicle incident $17,627
Rollin g stock (locomotive) – pedestrian incident $4,347
Damaged freight No default value
Site recovery No default value
Service recovery No default value
Road vehicle damage
Minor damage Major damage
Light passenger vehicle $3,353 $11,149 Heavy freight vehicle – rigid truck $13,462 $44,762 Heavy freight vehicle – articulated truck $35,226 $117,126 Buses $10,683 $35,522 Motorcycles $3,627 $12,060 Bicycles $0 $0
5
Other Costs
5.1
Delays
Economic costs are incurred from delays to regular freight and passenger services as a result of level crossing incidents.
For freight trains, the model uses BTRE 2002’s opportunity cost of time lost which is $1,000 per freight train per hour (1999 dollars). The model provides an option to directly input the number of hours delayed and the number of freight trains affected. Default values of 6 hours delay and 1.5 trains affected from BTRE 2002 are used if no incident-specific data is inputted.
For passenger trains, the model uses BTRE 2002’s value of time lost by rail passengers which is $8.80 per passenger per hour (1999 dollars). This value of time lost is broadly similar to the NSW RTA’s travel time value for public transit passengers of $11.89 (2009 dollars, compared to BTRE $13.49 in 2009 dollars).
The model provides an option to directly input the number of hours delayed and the number of passengers affected across the system. Default values of 20 minutes delay and 800 urban passengers delayed (2 trains, 400 passengers each) or 160 non-urban
Railway Level Crossing Incident Costing Model 20 passengers delayed (2 trains, 80 passengers each) from BTRE 2002 are used if no
incident-specific data is inputted.
Ideally, the model would also include road network delay costs arising particularly from level crossing incidents in urban locations. This has not been incorporated into the model at this stage due the lack of data and an available methodology. BITRE 2010’s travel delay methodology for all road crashes is based on casualty severity, which is generally not appropriate for level crossing incidents. This could be an area to improve the incident costing model over time as data and methodologies develop. To assist future analysis, the model does allow for the number of hours disruption for road traffic to be inputted, although this is not utilised for any cost calculations in the current model.
5.2
Police and emergency services costs
The avoidable costs of police and emergency services activities associated with level crossing incidents are taken from BTRE 2002 and BITRE 2010.
Police costs
BTRE 2002 estimates that police costs for attending a rail accident is $6,372 for those involving a fatality and $2,198 for those involving a serious injury (1999 dollars). BTRE 2002 does not specifically discuss rail accidents where only minor injuries or property damage is involved.
The model assumes the ‘fatality’ cost (i.e. $6,372 in 1999 dollars) for level crossing incidents involving a fatality and the ‘serious injury’ cost for all other level crossing incidents.
Fire services costs
BITRE 2010 estimates that the costs associated with the attendance of fire services at road crash incidents was $3,004 for crashes in urban locations and $3,304 (10 per cent more) for crashes in non-urban locations (2006 dollars). The model applies these costs, as relevant, to all level crossing incidents.
Coronial costs
BTRE incorporates the average cost of a coronial investigation as $1965 per road fatality (2006 dollars). BTRE 2002 assumes that all railway accident deaths would be the subject of a coronial inquiry – therefore level crossing incident costing model applies the average coronial cost to the number of fatalities in a given incident.
5.3
Safety investigation costs
Safety investigation costs are borne by both the rail operators involved and by state and territory rail safety regulators/Australian Transport Safety Bureau (ATSB). BTRE 2002 assumes level crossing incident investigation costs of $1200 (1999 dollars).
For the purposes of the model, this BTRE value is used as a default for each of rail operator investigations and regulatory/ATSB investigations – although there is an option for direct input of investigation costs for both parties.
5.4
Insurance administration and legal costs
BTRE 2002 does not estimate insurance administration costs involving motor vehicles, but does suggest average insurance administrative cost for all rail accidents of about $32,000 (1999 dollars). This is used as a default value.
5.5
Cost of train and motor vehicle unavailability
Sometimes as a result of level crossing incident damage, train services are not able to be undertaken which incurs lost profits for rail operators (net of non-incurred costs), or there are increased costs for rail operators as a result of utilising alternative
arrangements to maintain services.
These costs of train unavailability are not estimated by BTRE 2002 or by other available sources. The model allows for direct input of incident-specific data.
In the case of road vehicles involved in a level crossing incident, the model assumes that all road vehicles are unavailable for 7 days as a default value, as per the BITRE 2010 timeframe for vehicles involved in a road crash and towed from the scene. The total unavailable vehicle replacement costs are $840 for cars and motorcycles, $1547 for buses, $1449 for rigid trucks, and $3003 for articulated trucks (2006 dollars).
5.6
Costs not otherwise captured
Finally, the model incorporates a category for other costs that have not been otherwise captured within the various cost categories. There is no default value – only direct input.
5.7
Summary of other costs
Table 9 below outlines the costs used in the model and detailed in this section in terms of today’s (2010) dollars.
Table 9
Summary of unit costs for ‘other’ costs (2010 dollars)
Driver Cost (2010 dollars)
Railway Level Crossing Incident Costing Model 22
Per passenger per hour $13.85
Police and emergency services
Fire – per incident (urban) $3,388 Fire – per incident non-urban $3,727 Police – per fatal incident $8,980 Police – per non-fatal incident $3,098 Coronial – per fatality $2,216
Safety investigation Per incident, for each of rail operators and regulators/ATSB
$1,691
Insurance administration Per incident $45,097
Rail unavailability No default value
Road vehicle unavailability
Per road accident $942 (light vehicle) $942 (motorcycle) $1,735 (bus) $1,626 (rigid trucks) $3,369 (articulated truck)
Costs not otherwise captured
6
The annual cost of level crossing
incidents
The incident model can be extended to estimate the overall costs for railway level crossing incidents in a typical recent year.
6.1
National data available
Data on the number and severity of railway crossing incidents is collected separately by each State and Territory. There have been a number of recent national aggregations of the State and Territory level data.
In the absence of a fully integrated national rail safety database that can be fully examined for all aspects of level crossing incidents, various published data sources are utilised.
Most recently, the ATSB (2009) released an ‘Australian Rail Safety Occurrence Data’ report for the period 1 January 2001 to 30 June 2009. This report provides data on the total number of rail crossing incidents.
In 2008, the NSW Independent Transport Safety and Reliability Regulator (ITSRR) undertook a review on behalf of the Rail Safety Regulators’ Panel (RSRP). This report aggregated data between 1995-96 and 2006-07. Data captured included:
• Total number of crossings (public level crossings) • Number of fatalities (available from 1998-99); and • Number of collisions (available from 2000-01).
In 2009, the Australian Institute of Health and Welfare (AIHW 2009) examined hospital admissions data to examine the serious injuries that were attributed to railway crossing incidents.
Other reports examining level crossing fatality and injury statistics using other or similar sources including ATSB (2004) examining fatalities based on unpublished data obtained from the Australian Bureau of Statistics (ABS) and a 2002 ATSB examination of fatalities from its fatality database.
The number of incidents
The RSRP report (2008) noted that there is a suggestion of a decrease in the annual number of collisions between train and road vehicles, however there is insufficient data to make conclusive assessments. More recent ATSB appears to confirm this. There is a statistically significant trend reduction (around 2 ½ incidents per year) in the number of incidents reported.
Railway Level Crossing Incident Costing Model 24 For the purposes of estimating an annual level we have assumed an amount of 60
incidents per year involving a road vehicle. In addition there are around an additional 10 incidents a year of a train and person collision at a public level crossing.
Figure 2: Level crossing incidents involving road vehicle or pedestrian
Source: Data in ATSB (2009)
Fatalities and injuries
There appears to be some conflicting data on the number of fatalities
• The ATSB (2004) reported data from 1997–2002 that indicates a yearly average of 36.8 level crossing accident fatalities (range 19–44) per year.
• The RSRP (2008) report suggests between 1998-99 and 2006-07 the total number of fatalities ranged between 7 and 25.
The large difference appears to be related to the number of pedestrian deaths. While suicides are excluded from both data sets, the definition of suicide differs.7 We assume a typical number of yearly fatalities on a forward-looking basis is 15.8
7
The ATSB (2004) report definition of suicide is ‘A suicide is defined here as a death that a coroner has found to be a suicide.’ The RSRP (2008) report definition is where a death is reported as suspected suicide.
The annual level of serious injuries9 is captured in the AIHW (2009) report. Based on this report between 1999-00 and 2005-07 there was an average of 54 serious injuries per year. We assume a typical number of serious injuries is 50.10
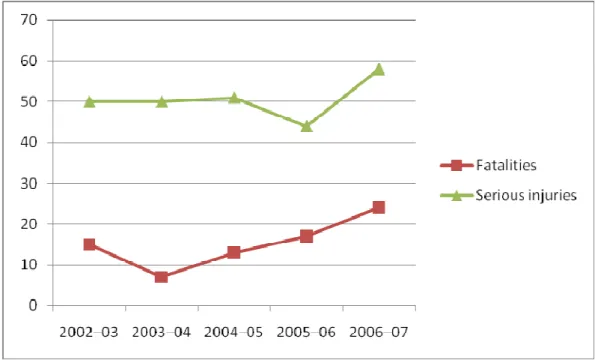
The following figure is based on RSRP and AIHW data.
Figure 3: Level crossing fatalities and serious injuries
Source: Data in RSRP (2008) and AIHW (2009)
8
This working assumption is based on the approximate number of fatalities in ‘usual’ recent year, acknowledging that in some years the number of fatalities is higher (e.g. 2006-07) and in some years it is lower (e.g. 2003-04).
9
The definition of serious injury by AIHW and ON-S1 are essentially the same. AIHW define Seriously injured ‘as an injury which results in the person being admitted to hospital, and subsequently discharged alive either on the same day or after one or more nights stay in a hospital bed (i.e. deaths are excluded).’ To reduce over-counting of injury cases, separations where omitted in which the mode of admission is recorded as being by transfer from another acute-care hospital.
10
This working assumption is based on the approximate number of serious injuries in a ‘usual’ recent year, acknowledging that in some years the number of serious injuries is higher (e.g. 2006-07) and in some years it is lower (e.g. 2005-06).
Railway Level Crossing Incident Costing Model 26 The number of minor injuries is not captured in any summary reports. We consider it
reasonable to estimate the ratio of minor injuries to serious injuries to be in the order of 1:1. Thus we estimate the minor injuries to be around 50 minor injuries.
Other factors
We have found no available aggregate data on the number or type of incidents by vehicles involved or other measures of severity that may indicate a total cost.
We did not find an available spilt between urban and non-urban incidents. We assume a 65% urban and 35% non-urban split based on the statement in ATSB (2003) that of estimated costs of $24.8 million for all crossings incorporates $16.3 million for active crossings, and that most active crossings would be in urban areas.
In the absence of better available aggregate data, we also assume:
• derailments occur in 25% of incidents involving road vehicles and 5% of incidents involving pedestrians;
• half of road incidents involve major damage to the vehicle, and half minor damage; • the road vehicle mix involved in incidents of 60% light passenger vehicles, 20%
heavy freight vehicles – rigid trucks, and 20% heavy freight vehicles – articulated trucks; and
• 60 incidents involving road vehicles and 10 incidents involving pedestrians per year, with 15% of those incidents involving fatalities.
Variation
A key issue for estimating the annual cost of railway crossing incidents is that there is significant variability in the severity of an incident.
In particular, the number of fatalities and serious injuries is significantly more variable than the number of incidents (see Box 3). In 2006-07 there were 25 fatalities compared with less than recorded 10 in 1998-99, in part due to the Kerang rail disaster. Given the potential impact it is advisable that a conservative approach be undertaken.
Box 3
Distribution of historical incidents
The significance of railway incidents can vary greatly ranging from minor incidents to an extreme case of a derailment of urban passenger train. Given the range of incidents, historical averages may not provide a good guide as to expected future costs of an incident and thus the benefits to reducing the costs of incidents.
The incident at Kerang in 2007 (where 11 people were killed) was reasonably severe compared with incidents internationally. However more severe incidents are not unknown. In 1961, 20 school children were killed in a level crossing incident in the US11.
6.2
Estimating an annual cost
Using the above information an estimate was made of the annual cost of railway level crossing incidents. Table 10 below summarises the method for estimating the average annual cost of level crossing incidents.
11
Railway Level Crossing Incident Costing Model 28 Table 10
Annual cost of level crossing incidents – Summary method
Approach
Human costs Based on typical number of fatalities and injuries x estimated cost per
fatality and injury category.
Road vehicle Based on typical number of incidents involving vehicle x estimated cost
per vehicle accident
Rail fixed structures and rolling stock
Based on typical number of incidents x collision and derailment type
Delays Based on hours delayed x train type x numbers of trains (freight) or
passengers
Police and emergency services
Police and fire costs based on number of vehicle incidents. Coronial costs based on the number of fatalities.
Safety investigation Based on typical number of incidents x estimated cost per incident
Insurance administration
Based on typical number of incidents x estimated cost per incident
Road vehicle unavailability
Based on typical number of incidents by road vehicle type x estimated cost of unavailability by road vehicle type
An estimate of the total costs is shown in Table 11.12 The average annual cost of railway crossing incidents is estimated at around $116 million, which is around 2.5 times (in real terms) the amount last estimated by BTRE (2002). As shown in Table 11 by far the most significant costs are human costs. Fatalities represent around 75 per cent of the total costs.
As the costs below include irreplaceable costs (human costs and delay costs), the amount can be interpreted as an estimate of what society would be willing to pay to eliminate the future railway crossing incidents in Australia.
12
This does not include all cost elements, due to data constraints, but does include the most significant elements – principally human costs.
Table 11
Annual cost of level crossing incidents ($000s, 2010)
Annual incidence
Total cost Comment
Human costs
Fatalities 15 $88,901,308 65% urban, 35% non-urban
Severe injuries 50 $15,155,767 65% urban, 35% non-urban
Mild injuries 50 $2,413,278 65% urban, 35% non-urban
Property damage
Rail fixed structures and rolling stock 70 $4,240,198 Derailments in 25% road
incidents, 5% pedestrian incidents
Road vehicle 60 $1,524,502 60% light passenger vehicles,
20% rigid trucks, 20% articulated trucks.
Other costs
Police & emergency services 70 $557,341
Delay costs 70 $593,519
Safety investigation 70 $236,760
Insurance administration & legal 70 $3,156,806
Road vehicle unavailability 60 $93,858
TOTAL $116,279,817
Notes: Indicative costs only. Based on historical averages for number of incidents and casualties. Does not include suicides.
Railway Level Crossing Incident Costing Model 30
7
References
Access Economics 2008, ‘The Health of Nations: The Value of a Statistical Life’, A report for Australian Safety and Compensation Council. Available from
www.safeworkaustralia.gov.au.
AAMI 2008, Crash Index 2008 – annual road safety index, available at
http://www.aami.com.au/company-information/news-centre/special-reports.aspx AIHW (Australian Institute of Health and Welfare: Berry JG & Harrison JE) 2008.
Serious injury due to transport accidents involving a railway train, Australia, 2001–02 to 2005–06. Injury research and statistics series number 43. (Cat. no. INJCAT 114) Adelaide: AIHW & ATSB.
AIHW (Australian Institute of Health and Welfare: Henley G & Harrison JE) 2009.
Serious injury due to transport accidents involving a railway train, Australia 2002-03 to 2006-07. Injury research and statistics services number 54. Canberra.
ATSB (Australian Transport Safety Bureau) 2004. Monograph 10 – Level crossing accidents, Available at:
http://www.infrastructure.gov.au/roads/safety/publications/2002/Lev_Cross_2.aspx ATSB (Australian Transport Safety Bureau) 2004. Level crossing accident fatalities. Available at: http://www.atsb.gov.au/publications/2004/level_cross_fatal.aspx ATSB (Australian Transport Safety Bureau) 2009, Australian Rail Safety Occurrence Data – 1 January 2001 to 30 June 2009, ATSB Transport Safety Report Rail Statistics – RR-2009-007(1), Commonwealth of Australia.
BITRE (Bureau of Infrastructure Transport and Regional Economics) 2010, Cost of road crashes in Australia 2006, Report 118, Commonwealth of Australia.
BTE (Bureau of Transport and Economics) 2000, Road Crash Costs in Australia, Report 102, available at http://www.btre.gov.au/docs/r102/r102.pdf.
BTRE (Bureau of Transport and Regional Economics) 2002, Rail Accident Costs in Australia, Report 108, Commonwealth of Australia.
Hensher, DA, Rose, JM, Ortúzar, J & Rizzi, LI 2009, ‘Estimating the willingness to pay and value of risk reduction for car occupants in the road environment’, ITLS working paper ITLS-WP-03, available from www.itls.usyd.edu.au.
PwC (PricewaterhouseCoopers in conjunction with the Hensher Group) 2008, Economic Valuation of Safety Benefits – Serious Injuries, report for the NSW Roads and Traffic Authority, August 2008.
RSRP (Railway Safety Regulators’ Panel) 2008, Review of National Level Crossing Statistics, September 2008.
RTA (NSW Roads and Traffic Authority) 2009, Economic Analysis Manual Appendix B – Economic Parameters for 2009.
US DOT (U.S. Department of Transportation) 2009, ‘Treatment of the Economic Value of a Statistical Life in Departmental Analyses – 2009 Annual Revision’, Memorandum to secretarial officers, modal administrators, Dated: March 18, 2009, available at
http://ostpxweb.dot.gov/policy/reports/VSL%20Guidance%20031809%20a.pdf . Viscusi WK 2008, ‘How to Value a Life’ Vanderbilt University Law School Law and Economics, Working Paper Number 08-16.