THREE ESSAYS ON CHILD WELLBEING IN DEVELOPING COUNTRIES
Averi Chakrabarti
A dissertation submitted to the faculty at the University of North Carolina at Chapel Hill in partial fulfillment of the requirements for the degree of Doctor of Philosophy in
the Department of Public Policy.
Chapel Hill 2019
Approved by:
Sudhanshu Handa
Gustavo Angeles
Pamela Jagger
Benjamin Mason Meier
ii
ABSTRACT
Averi Chakrabarti: Three Essays on Child Wellbeing in Developing Countries (Under the direction of Sudhanshu Handa)
This dissertation explores factors that lead to poor outcomes for children in different
developing country contexts—infant mortality in Indonesia, youth physical violence in
Zimbabwe and solid fuel-use in southern Africa—and points to ways in which they might be
addressed. Chapter 1 probes whether deforestation in Indonesia shapes infant mortality.
Given that forest cover losses might lead to a growth in mosquito populations (for example,
by causing a reduction in mosquito predators), this paper explores whether there is evidence
of malaria being a mediator in the forest cover-infant mortality relationship in the country by
testing for a higher detrimental effect of deforestation on the children born to women from
their first pregnancies, a time during which women are most vulnerable to malaria infections.
Chapter 2 examines whether a national unconditional cash transfer (CT) program in
Zimbabwe was able to reduce youth exposure to physical violence by addressing poverty, a
structural determinant of child abuse and maltreatment. Finally, Chapter 3 identifies the
impacts of CT programs in Malawi and Zambia on household fuel use and evaluates whether
the programs allowed recipient households to move away from solid fuels (such as firewood)
iv
TABLE OF CONTENTS
LIST OF TABLES ... vii
LIST OF FIGURES ... ix
CHAPTER 1: DEFORESTATION, MALARIA AND INFANT MORTALITY IN INDONESIA ... 1
1. Introduction ... 1
2. Background ... 5
2.1. The Indonesian context ... 5
2.2. The burden of malaria ... 7
2.3. Deforestation and malaria ... 8
2.4. Other channels through which forest loss could shape human health ... 9
3. Data ... 10
4. Methods... 15
5. Results ... 17
5.1. Main infant mortality results ... 17
5.2. Mortality at different phases of infancy, foetal loss and birthweight ... 19
5.3. Heterogeneity in results ... 22
6. Robustness checks ... 24
6.2. Alternative forest cover measures and models ... 28
6.3. Migration concerns ... 29
6.4. Using a maternal fixed effects approach ... 29
7. Discussion and Conclusion ... 31
CHAPTER 2: THE EFFECTS OF CASH AND COMPLEMENTARY SERVICES ON YOUTH EXPOSURE TO VIOLENCE IN ZIMBABWE... 35
1. Introduction ... 35
2. Background: Potential channels through which cash transfers might shape child abuse 39 3. Program description & study design ... 40
4. Data ... 44
5. Sample and methods ... 46
6. Results ... 51
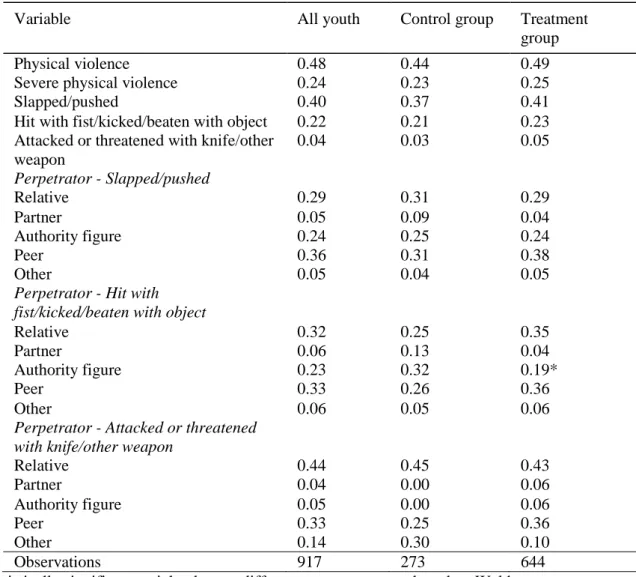
6.1. Prevalence of violence at baseline ... 51
6.2. Main results ... 52
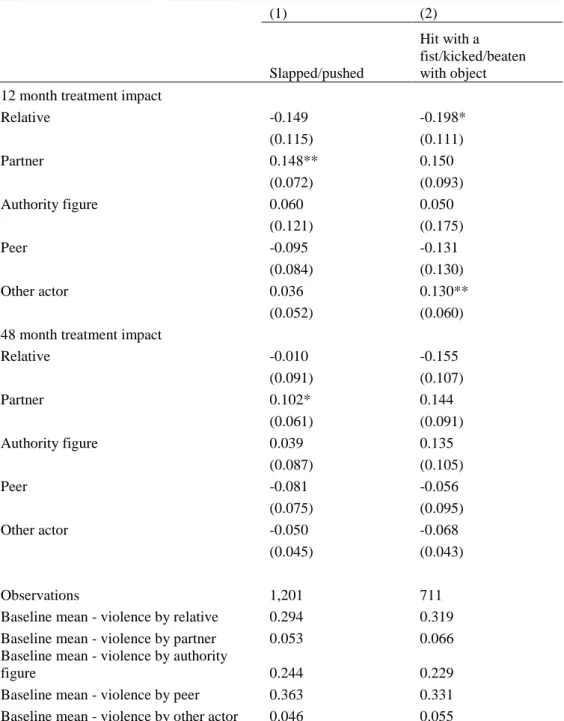
6.3. Impacts on potential mediators ... 56
6.4. Schooling as a predictor of violence ... 61
7. Robustness checks ... 67
8. Discussion ... 69
CHAPTER 3: THE IMPACTS OF CASH TRANSFER PROGRAMS ON FUEL-USE ... 72
1. Introduction ... 72
vi
3. Impact evaluation studies ... 78
4. Data ... 85
5. Methods... 94
6. Results ... 95
6.1. Main household fuel sources ... 95
6.2. Expenditure on fuels ... 99
6.3. Household ownership of solar panels ... 103
7. Summary and Discussion ... 104
APPENDIX A ... 106
APPENDIX B ... 111
Appendix C ... 112
APPENDIX D ... 114
APPENDIX E ... 122
LIST OF TABLES
Table 1: Descriptive statistics for the main sample of live births ... 14
Table 2: Forest cover and infant mortality ... 17
Table 3: Forest cover and its relationship with mortality at different phases of infancy, foetal loss and birthweight ... 20
Table 4: Forest cover and infant mortality - heterogeneous effects by island ... 22
Table 5: Maternal characteristics and concurrent health services ... 25
Table 6: Employing different forest cover measures and other types of models, Examining recent births ... 27
Table 7: Results from maternal fixed effects models ... 30
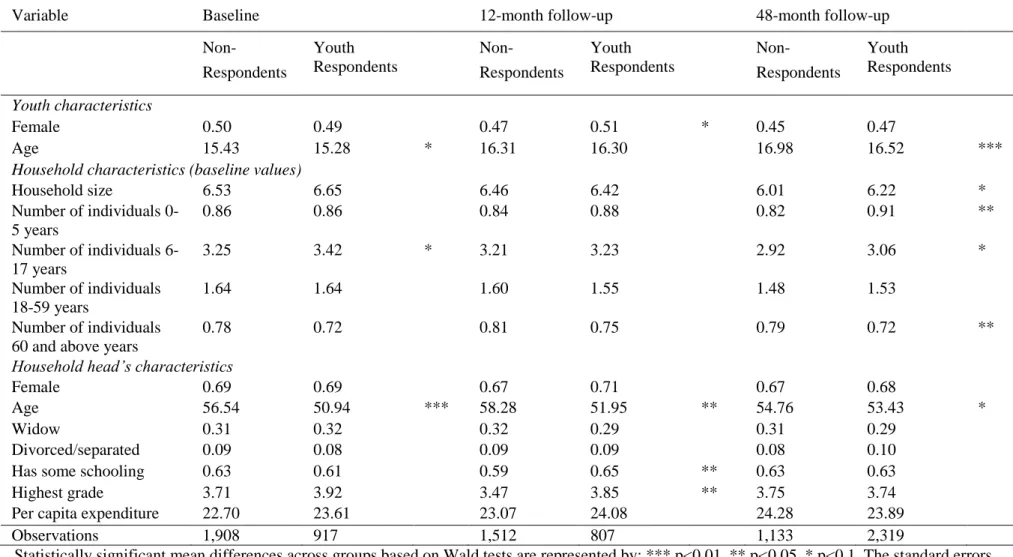
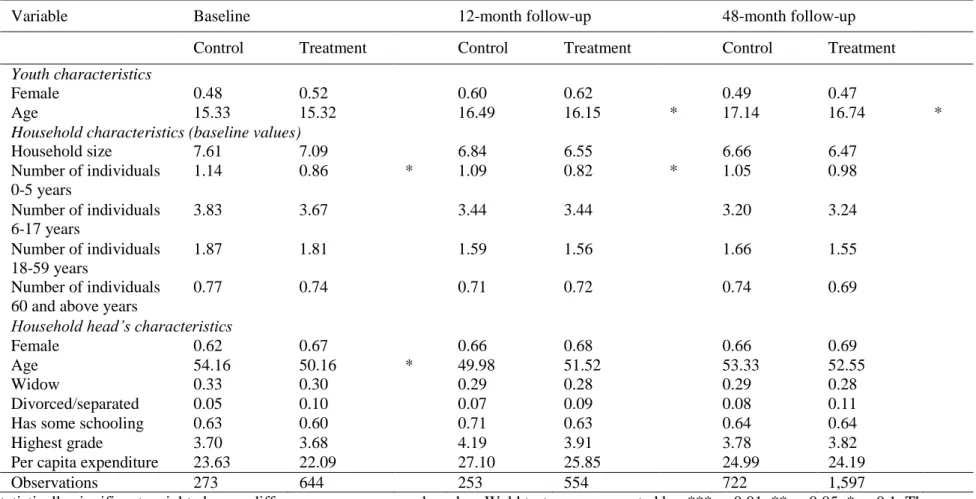
Table 8: Comparison of youth not surveyed and surveyed across survey waves ... 49
Table 9: Comparison of surveyed youth in treatment and control across survey waves ... 50
Table 10: Treatment-Control balance on youth violence measures at baseline ... 52
Table 11: Impacts of the HSCT program on youth exposure to physical violence ... 54
Table 12: Impacts of the HSCT program on youth environment at 48-month follow-up survey ... 56
Table 13: Impacts of the HSCT program on violence perpetrated against youth by specific types of actors ... 57
Table 14: Impacts of the HSCT program on household-level outcomes ... 59
Table 15: Impacts of the HSCT program on caregiver-level outcomes ... 60
Table 16: Impacts of the HSCT program on youth-level outcomes ... 62
Table 17: Schooling as a risk factor for violence ... 63
Table 18: Heterogeneity in HSCT's effects on youth violence by schooling ... 66
Table 19: Overview of cash transfer (CT) programs ... 81
Table 20: Treatment-Control Mean Differences at Baseline ... 83
viii
Table 22: Multinomial logit results - The marginal effect of cash transfer (CT) programs on the adoption of a type of energy as the main source of lighting fuel ... 98
Table 23: : Multinomial logit results - The marginal effect of cash transfer (CT) programs on the adoption of a type of energy as the main source of cooking fuel ... 99
Table 24: The effect of cash transfer (CT) programs on the likelihood of having any firewood expenses ... 100
Table 25: The effect of cash transfer (CT) programs on energy budget
shares devoted to specific fuels... 102
LIST OF FIGURES
Figure 1: Forested islands of Indonesia ... 6
Figure 2: Perpetrators by schooling status ... 65
Figure 3: Main lighting fuel across programs ... 87
Figure 4: Main cooking fuel across programs ... 89
1
CHAPTER 1: DEFORESTATION, MALARIA AND INFANT MORTALITY IN INDONESIA
1. Introduction
The world’s forests, being rich biodiversity reserves and carbon sinks, provide crucial
ecosystem services. High rates of forest loss and degradation around the world are, however,
increasingly threatening such amenities (Foley et al, 2005). Between 2000 and 2012 alone, as
many as 2.3 million square kilometres of global forests have disappeared (Hansen et al,
2013).1 As indicated by research from countries in South America, Asia and Africa, one
consequence of deforestation is an increase in the prevalence of malaria—a top cause of
death worldwide (Olson et al, 2010; Wayant et al, 2010; Lozano et al, 2012; Terrazas et al,
2015; Fornace et al, 2016; Berazneva and Byker, 2017).
Indonesia is an interesting setting to study the link between deforestation and malaria.
The country is categorized as being malaria-endemic and up to 57 percent of the population
(132.8 million individuals) is at risk of being infected by Plasmodium falciparum (Elyazar et
al, 2011), the parasite that is responsible for the bulk of global malaria mortality (Packard,
2007). In terms of forest cover, Indonesia has the third largest tropical forest reserves in the
world after Brazil and the Democratic Republic of Congo (ITTO and FAO, 2011). Its forests
are, however, facing growing pressures from factors such as rampant illegal logging. In the
early 2000s, Indonesia lost more than 5,000 square kilometres of forests every year and in
subsequent years, it experienced the greatest increase in forest loss in the world. By 2008, the
last year of the time period covered by the current analysis, deforestation in Indonesia
annually claimed almost 15,000 square kilometres of forests (Hansen et al, 2013). While previous studies have demonstrated increases in malaria prevalence due to Indonesia’s forest
loss (Pattanayak et al, 2010; Garg, 2017), it isn’t clear whether these spikes in malaria have
been severe enough to bring about deaths. In this analysis, I document the mortality costs of
deforestation-induced malaria in Indonesia and I do so with regard to a specific population
group—infants.
The empirical strategy that I employ builds upon a stylized fact on malaria. While all
pregnant women are extremely vulnerable to malaria infections, they are most susceptible
during their first pregnancy. This pattern arises because the placenta that is created during the
first pregnancy is a new organ with no resistance to the disease, but later pregnancies are
protected to a greater extent by antibodies developed during malaria infections in previous
pregnancies. Consequently, the poor birth outcomes (such as infant mortality) that are likely
to arise due to maternal malaria are disproportionately concentrated among children born
from first pregnancies (Fried et al, 1998; Steketee et al, 2001; Guyatt and Snow, 2004;
Nosten et al, 2004; Desai et al, 2007). Of all the factors that move with declining forest cover
(like air pollution), only malaria has pregnancy order-specific effects. In other words, if there
is any change in infant mortality due to prenatal exposure to deforestation, this change will be
the same for all children unless pregnant women are endangered by the malaria increases
accompanying forest loss.
Using data on forest cover levels in Indonesian districts between 2000 and 2008 from
Burgess et al. (2012) and birth data from the Demographic and Health Surveys (DHS), I
3
consistent with the gravidity-specific effects of maternal malaria.2 Essentially, I compare the
change in mortality when first pregnancy order infants experience deforestation in utero to
the same change for higher pregnancy order infants. Reassuringly, there are no are no level
differences in infant mortality between first and higher pregnancy order children in my
sample (with or without controls like maternal age at birth), which reduces the concern that
the two groups would react differently to a change merely because they were different to
begin with. The identifying assumption is that except for malaria, district forest cover
changes are uncorrelated with factors that differentially shape the mortality of first and higher
pregnancy order infants.
My results demonstrate that children from first pregnancies face greater mortality risks
than other children due to in utero exposure to deforestation, indicating that the malaria increases from Indonesia’s forest loss have had life threatening implications for a vulnerable
population. In terms of magnitude, I find that when district forest cover falls by one standard
deviation, first children experience a one percentage point higher likelihood of dying than
other children. This accounts for almost one-third of the 3.7 percent of first pregnancy order
children in the study sample who die in infancy. I show that the increased first child mortality
risks stemming from forest cover reductions are manifested in the neonatal period of infancy
or the first 27 days of life, which is consistent with the tendency of infant deaths driven by
prenatal conditions to occur soon after birth. While deforestation-induced malaria could lead
to detrimental birth outcomes other than infant mortality (like miscarriages), the evidence
does not conclusively indicate that forest cover declines disproportionately promote foetal
losses during first pregnancies. It does seem, however, that children born from first
pregnancies amidst forest loss are likely to be smaller, suggesting that birthweight is a
mechanism for the main infant mortality results that I identify. Finally, the dangers of
reduced forest cover for first pregnancy order children appear to be greatest in Papua, the
Indonesian island that bears the highest burden of P. falciparum malaria in Indonesia
(Elyazar et al, 2011).
I conduct several checks to establish the robustness of my findings. The results are not
driven by systematic differences between children born to women experiencing forest loss
during their first pregnancy and other children—the former’s mothers do not have different
characteristics, nor are they more likely to be deprived of healthcare services. The results
persist when I employ alternative forest cover measures and empirical models. Furthermore,
when I restrict the sample to more recent births to limit potential misassignment of births to
the forest cover of the wrong districts due to inter-district migration of mothers after births
(the data I use do not have migration information), there is no qualitative change in the
results. Finally, the observed infant mortality-forest loss pattern holds when I estimate a
model that is similar to the main district fixed effects specification but that has a finer level of
fixed effects—those at the level of mothers.
This study is valuable for several reasons. First, it is vital to identify both the short and
long term implications of the extensive environmental degradation that is taking place
globally. While governments might have little incentive to reign in dangerous environmental
practices if the effects are not expected to emerge until the future, the recognition of
concurrent costs might provide more urgency to the need to stem environmental harms. In
this analysis, I document an immediate human health impact of deforestation in Indonesia,
one that arises due to forest loss-induced spikes in malaria. Second, by investigating how
deforestation during the in utero period shapes survival, this research contributes to the
research that investigates the manifold effects of early life shocks (Almond and Currie, 2011;
Currie and Vogl, 2013). Third, while bolstering the empirical evidence on the link between
5
wellbeing, this analysis also adds to the growing literature on the impacts of deforestation on
infant health (Pattanayak et al, 2010; Berazneva and Byker, 2017; Carrillo et al, 2018;
Bauhoff and Busch, 2018). Finally, to my knowledge, this is the first study to probe the costs of malaria increases due to Indonesia’s rapid rates of deforestation on a concrete population
health indicator across all the forested islands in the country.
The rest of the paper is structured as follows. Section 2 discusses the study setting and
relevant literatures. I describe the data and methods in Sections 3 and 4 respectively. Section
5 contains the results and Section 6 presents robustness checks. I conclude with a discussion
in Section 7.
2. Background
2.1. The Indonesian context
Indonesia is a malaria-endemic country where the majority of human malaria cases are
caused by the aggressive Plasmodium falciparum parasite—estimates indicate that while
there are 12.3 million clinical cases of P. falciparum malaria a year, 132.8 million individuals
(57 percent of the population) are at risk of being infected (Hay et al, 2010; Elyazar et al,
2011). The prevalence of P. falciparum varies across Indonesia’s forested islands (see
country map in Figure 1). Almost all of those who live in the endemic regions of Sumatra and
Sulawesi are at positive but low risk for the disease. A greater proportion of the populations
of the islands of Kalimantan and Papua face P. falciparum risks. Endemicity is highest in
Papua where 41 percent of residents face intermediate risks (see calculations based on data
Figure 1: Forested islands of Indonesia
7
In terms of forest cover, Indonesia has one of the largest stretches of tropical forests in the
world. These forests are, however, facing rampant deforestation. Between 2000 and 2008, the
forests felled in Indonesia would have covered an area of land that was double the size of the US state of Vermont (Burgess et al, 2012). While one of the most “megadiverse” countries
(Mittermeier et al, 1997), Indonesia risks tremendous biodiversity declines because of its high
rates of deforestation (Wilcove et al, 2013). Another consequence of forest loss is the release
of large amounts of stored carbon and in fact, according to one estimate, Indonesia’s carbon
dioxide emissions are rivalled only by the United States and China (World Bank, 2007).
Much of the logging in Indonesia has been driven by the expansion of industries such as palm
oil, pulp and paper (Forest Watch Indonesia et al, 2002; Koh and Wilcove, 2008; Obidzinski
and Dermawan, 2012; Edwards, 2018). Deforestation has also received an impetus from the
massive administrative decentralization of the country at the turn of the century—competition
between the growing number of districts in wood markets has led to an increase in wood
extraction (Burgess et al, 2012). Illegal logging likely accounts for 60 to 80 percent of all
logging in Indonesia, forming a market worth one billion US dollars per year (CIFOR, 2004).
2.2. The burden of malaria
Malaria is a major cause of mortality and morbidity in developing countries. In 2008,
there were about 243 million cases of malaria globally and these resulted in 863,000 deaths
(WHO, 2009). Malaria is particularly dangerous for children under the age of five; estimates
suggest that a child dies every two minutes from the disease (WHO, 2016). Pregnant women
also face large risks—malaria during pregnancy increases the likelihood of maternal anaemia
and of poor birth outcomes. The latter—intrauterine growth retardation, prematurity and/or
low birthweight—could emerge, for instance, if immune responses to malaria infections
require glucose and oxygen to be diverted from the foetus to the mother. These adverse
falciparum malaria parasite is prevalent—African countries such as Kenya, Malawi and
Tanzania, and Asian countries such as Thailand and Papua New Guinea—demonstrates that
women in their first pregnancy (primigravidae) are more vulnerable to malaria than women in
later pregnancies (multigravidae). The placenta, when it is created for the first time, is a new
organ that has no resistance to the disease, and thus there is a high probability of it being
infected. Later placentas are protected to a greater extent by the antibodies produced during
exposure to malaria parasites in earlier pregnancies (Fried et al, 1998; Steketee et al, 2001;
Guyatt and Snow, 2004; Nosten et al, 2004; Desai et al, 2007). Since maternal malaria’s risks
vary by pregnancy order or gravidity, children born from first pregnancies experience the
brunt of the resulting adverse outcomes and are therefore expected to suffer more when there
is an increase in malaria incidence. Conversely, these children are likely to benefit
disproportionately when malaria declines. This type of first child advantage was documented
in the aftermath of a country-wide malaria control program in Sri Lanka which effectively
eliminated malaria in the 1940s—firstborn children experienced the largest improvement in
the probability of surviving childhood (Lucas, 2013).
2.3. Deforestation and malaria
There is evidence of a positive association between deforestation and malaria prevalence
in Brazil (Olson et al, 2010; Terrazas et al, 2015), Paraguay (Wayant et al, 2010), Malaysia
(Fornace et al, 2016) and Nigeria (Berazneva and Byker, 2017). An investigation across
multiple malaria-endemic countries also finds similar results (Austin et al, 2017). Within the
Indonesian context, Pattanayak and colleagues (2010) identify a negative link between
undisturbed forest cover levels and child malaria in the island of Flores, and Garg (2017)
finds that in forested districts, deforestation increases the probability of village-level malaria
outbreaks. Among other research on the topic, one analysis in Brazil suggests that forest
9
the conclusions of this study have subsequently been questioned (see Hahn et al (2014a) and
the response from Valle (2014)), and a couple fail to find evidence of a relationship between
forest loss and malaria incidence (Hahn et al (2014b) focus on Brazil and Bauhoff and Busch
(2018) use a multi-country sample).
Forest cover losses could increase malaria incidence through different pathways.
Deforested lands are often used for agriculture, and the irrigation ditches that are set up for
farming create new breeding sites for malaria vectors. Temperature increases due to forest
cover reductions also aid malaria transmission. Accumulated water on lands cleared of forests
tends to have a neutral pH by virtue of being exposed to strong sunlight and this is favourable
for the development of mosquito larvae. Another mechanism is the loss of biodiversity—the
reduction or elimination of predators (such as dragonflies) leads to mosquito proliferation
(Patz et al, 2000; Pattanayak and Pfaff, 2009).
The ecological channels through which deforestation shapes malaria are unlikely to
impact other diseases like dengue, diarrhea and measles because they have different disease
ecologies—in fact, Garg (2017) finds that these other diseases do not respond to forest cover
changes in Indonesia.
2.4. Other channels through which forest loss could shape human health
Forest loss is likely to be accompanied with various changes other than malaria and these
could shape health in different ways. The expansion of palm oil cultivation, which is
responsible for much deforestation in Indonesia, has reduced poverty (Edwards, 2018) and is
thus likely to improve health outcomes. On the other hand, forests are often cleared with
slash and burn practices, which lead to forest fires and the resulting air pollution is
detrimental to health (Frankenberg et al, 2005; Jayachandran, 2009; Carrillo et al, 2018;
as malaria, it is difficult to back out the contribution of deforestation-induced malaria from
the total effect of forest loss on infant mortality. Interestingly though, among all the potential
consequences of deforestation, only malaria has gravidity-specific effects on infant
mortality—higher levels of malaria (arising from forest cover declines) are more dangerous
for children born out of first pregnancies. I build my empirical strategy around this stylized
fact on malaria.
3. Data
I use data from several sources for this analysis.Forest cover information is from a
dataset compiled by Burgess and co-authors (2012) based on Moderate Resolution Imaging
Spectroradiometer (MODIS) satellite images at a 250-meter by 250-meter resolution. The
data covers the 2000-2008 period and it indicates the number of units of land that are forested
in an Indonesian district in a certain year. Given that the Burgess et al (2012) dataset covers
only the main forest islands of Indonesia—Sumatra, Kalimantan, Sulawesi and Papua, I too
focus on just these regions.3 These islands are delineated in the map presented in Figure 1.
Based on the availability of birth data (which I describe below), I focus on 276 districts in
Indonesia. These districts are richly forested—in 2000 (the first year of the study period), half
have 83 percent or more of their total area covered in forests. However, between 2000 and
2008, almost 75,000 square kilometres of the country’s forests disappear, with districts losing
between 0.5 and 34 percent of initial forest cover (median district forest loss stood at three
percent of 2000 forest levels) and none increasing forest cover. Figure A1 in Appendix A
depicts the percentage of initial district forest cover that disappeared during the study period.
I arrange districts in ascending order of initial forest cover along the x-axis, such that the
districts to the left have the least forest cover in 2000 and the ones to the right have the most.
11
Note that there does not appear to be any clear systematic patterns between initial forest
cover levels and forest loss.4
For this analysis, I capture forest cover variations within a district by constructing
within-district annual forest z-scores (akin to Garg, 2017 who also uses the same forest data as I do)
with the following formula:
z-scoredt = (annual_forestdt –mean_annual_forestd) / st_dev_annual_forestd (1)
where annual_forestdt is the total forest cover in district d in year t, mean_annual_forestd is
the average yearly forest cover in district d between 2000 and 2008, and
st_dev_annual_forestd is the standard deviation of yearly forest cover in district d during this
time period.
Essentially, z-scoredt relates forest cover in a district during a year to the average
annual levels of forest cover within the district during the study period. Since the z-scores
measure forest change withindistricts, a one standard deviation change in study period yearly
forest cover in one district represents a different area than a one standard deviation change in
another district. When averaged across all districts, one standard deviation in annual forest
cover between 2000 and 2008 is about 98 square kilometres.5
The birth data that I use are from the Demographic and Health Survey (DHS). Each
DHS is a nationally representative household survey that collects data on a wide range of
population and health indicators. The DHS interviews women aged 15 to 49 years and
compiles information on their fertility history—the date of birth of all livebirths, the age at
death of any children who died and the end dates of pregnancies that did not result in
4 The highest forest loss during the study period occur in Sumatra and Kalimantan. Districts in Papua, which have substantial forests, face the least amount of deforestation.
livebirths. Detailed data on prenatal care and health inputs are collected for children born in
the five years before the survey. For this analysis, I use data from the DHS rounds that were
conducted in Indonesia in 2002, 2007 and 2012. I stack the births from the study period
recorded in these surveys, and link each birth to the forest cover that prevailed in the
presumed district of birth and a year between 2000 and 2008. Since the surveys did not record the district a child was born in, I assume that a woman’s district of residence during
the survey is the district in which she conceived and had all her children.6 I do, however, later
conduct a check for this assumption. The year of forest cover exposure that I use pertains to the year in which a child’s mother spent her early or first six months of pregnancy.7 I focus
on this period since malaria in early pregnancy increases the severity of the adverse birth
outcomes that are likely to arise due to maternal malaria (Kalilani et al, 2010; Huynh et al,
2011; Griffin et al, 2012; Rijken et al, 2012).8
Since the DHS birth data are based on retrospective accounts, the possibility of recall
error (for example, with regard to the date of birth) might go up as the gap between birth and
survey date increases. In addition, births that had taken place a long time ago might have
occurred amidst circumstances very different from those that exist during the time of the
survey. For example, during an earlier birth, a woman might have lived in a different district
or had a very different economic status. To limit such biases, I include in the study sample
only children born in the five years preceding each DHS.
6 I drop the births of women who were visitors to the households in which they were interviewed since the children of these women could have been born elsewhere.
7 When these months extend over two different calendar years, I use the year in which a women spent half or more of her early pregnancy.
13
The main outcome variable that I use is an indicator variable for infant mortality
which captures whether a child died within the first year of life. Since this variable can be
defined only for those children who have been fully exposed to the risk of death in infancy, I
restrict the sample to children who had been born at least one year before the DHS. This
leaves me with a main sample of 13,078 births from the pregnancies of 12,058 women
occurring in 276 districts during the study period. Of these children, 459 or 3.5 percent died
in infancy. I find that there are no statistically significant differences in infant mortality
between first and higher pregnancy order children in my sample—the p-value for the test of
mean differences between the groups is 0.50.
Since maternal malaria’s effects on children are expected to vary by gravidity, I
identify the pregnancy order for each child in my sample. Women were asked by the DHS to
report whether they had ever had any pregnancies that were lost or terminated and if so, the
date when the pregnancy ended.9 Adding information on these pregnancies to women’s birth data allows me to construct a woman’s pregnancy history.10 I then create an indicator variable
for children born from first pregnancies.
I extract a number of other variables from the DHS to control for factors that might shape a child’s survival prospects—child gender, age of the mother at birth and its squared
term, mother’s education (in years), whether the birth was a multiple birth, rural residence,
wealth quintile and birth month.
Since early life circumstances strongly impact infant health and survival (Almond and
Currie, 2011; Currie and Vogl, 2013), I obtain additional data to capture changes in
environmental and macroeconomic conditions in Indonesian districts over time. As with the
9 This information was collected for up to two terminated pregnancies per respondent.
forest cover measure, I match each child to the annual district-level conditions that prevailed
during the in utero period.
I pull monthly precipitation (totals) and air temperature (means) from time series data
available from the University of Delaware (Matsuura and Willmott, 2009). I identify the
weather station that is closest to each district (by using the latitude and longitude of the district’s center) and use the matched station’s measurements to construct within-district
annual precipitation and temperature z-scores (with a formula similar to (1)).
I also use logged annual per capita district-level gross domestic product (GDP) in
constant prices. To create this variable, I obtain annual real GDP (in million Indonesian
Rupiah with 2000 being the base year) and population figures for each of the study years from the World Bank’s Indonesia Database for Policy and Economic Research
(INDO-DAPOER).11 Table 1 summarizes all variables for the entire sample.
Table 1: Descriptive statistics for the main sample of live births
Variable Mean
Standard
deviation Minimum Maximum
Gender – female 0.473 0.499 0 1
Age of mother at birth of child 27.065 6.244 12 48
Mother's education (in years) 8.271 4.030 0 18
Multiple birth 0.015 0.123 0 1
Rural residence 0.656 0.475 0 1
Wealth index 2.404 1.371 1 5
First pregnancy 0.2954 0.4562 0 1
Infant mortality 0.035 0.184 0 1
District-level characteristics during early pregnancy of women - annual measures
Forest cover (in square kilometers)a
4,862
6,617 0
45,069 Total precipitation (in centimeters)a 215.718 69.452 17.260 502.860 Monthly mean temperature (in degree
Celsius)a 25.548 3.015 11.408 29.025
Real GDP per capita (in IDR million)b,c 7.503 13.112 0.604 270.801
Observations
13,078
Notes: Sample includes children born 1-5 years before the DHS surveys.
aThese variables are converted to within district z-scores for the empirical analysis. bLogged for subsequent analysis.
cIDR refers to Indonesian Rupiah. This is in 2000 prices.
11 The INDO-DAPOER data are available at
15 4. Methods
One could estimate the relationship between forest cover and infant deaths by comparing
mortality in highly forested districts with mortality in less forested districts. However, given
that districts are likely to be very different from one another, the results would be biased. I
thus use a fixed effects approach to examine how infant mortality responds to temporal
changes in forest cover within districts.
As discussed above, first and higher pregnancy order children face very different risks
when their mothers are exposed to malaria during pregnancy. Note that these two groups
could have different mortality probabilities in general—first pregnancy children could be at a
disadvantage since women undergo permanent anatomical changes during their first
pregnancy and these facilitate foetal development during later pregnancies to a greater degree
than was possible during the first pregnancy (Khong et al, 2003). However, irrespective of
these potential differences, all factors that change concurrently with forest cover, except for
malaria, should impact first and higher order infants in the same way. For instance, air
pollution from the fires used to clear forests is as dangerous for first pregnancy children as it
is for other children. I thus use higher pregnancy order children as a control group to approximate how first pregnancy infants would fare under deforestation if it wasn’t
accompanied with increases in malaria. My empirical strategy is to compare the change in
infant mortality for first gravidity children when districts experience deforestation to the
change experienced by later gravidity children. The identifying assumption is that apart from
malaria, district forest cover variations are uncorrelated with factors that shape the mortality
of first pregnancy infants differently than the mortality of higher order infants. My approach
likely underestimates the total infant mortality costs of the malaria increases brought about by
deforestation since it does not capture the costs for higher pregnancy order children, which
I use the following estimation model for my analysis (similar to the one used by Garg
(2017)):
Midt = α1*Forest_Coverdt + α2*Firstidt + α3*Forest_Coverdt*Firstidt + α4*Xidt + α5*Zdt + μd +
ηlt + α5Υp + εidt (2)
where Midt measures infant mortality for child i whose early in utero period was spent in year
t in district d, Forest_Coverdt quantifies forests for district d in year t, and Firstidt is an
indicator variable that switches on if a child is born from a first pregnancy. Xidt are the
child-level control variables such as mother’s age at birth. Zdt is a vector of time varying covariates
for district d in year t such as precipitation. μd are district-level fixed effects which account
for time-invariant district heterogeneity (like geography and institutional factors), ηlt are
indicators for island l and year t and control for occurrences common to all districts within an island during the year, and Υp represents a linear time trend varying by province, thus
allowing infant mortality in all districts in a province to experience a common linear trend. εidt is the error term pertaining to child i in district d and year t. I cluster standard errors at the
district-level and estimate linear probability models (LPM) because of problems associated
with the use of non-linear models with fixed effects (Greene, 2004; Karaca-Mandic, 2012).
However, as part of the checks I conduct later, I test whether the results hold when using the
logit and probit models.
α3 is the coefficient of interest in (2). Since the goal is identify the implications of
deforestation, one can multiply this coefficient with -1 to understand whether first pregnancy
children fare differently than other children when district forest cover falls by one unit (that
is, by one standard deviation). If the product is positively signed, it will show that forest loss
17
that the increases in malaria due to deforestation are severe enough to bring about mortality
for the most vulnerable children.
It is possible that there are time-varying district features that I fail to account for in the
specification above and that are associated with forest cover and with predictors of infant
mortality. Note though that these would be problematic only if they differentially influence
first child mortality. Later in the analysis, I test for the presence of such potentially
confounding factors.
5. Results
5.1. Main infant mortality results
I present the main findings of my analysis in Table 2. The first column contains the
results obtained by estimating a sparse version of model (2) and subsequent columns include
additional sets of controls. The coefficient on the first pregnancy indicator is statistically
insignificant which indicates that there are no level differences in infant mortality between
first and higher pregnancy order children. This is reassuring since it reduces the concern that
the two groups would react differently to a change merely because they were different to
begin with.
Table 2: Forest cover and infant mortality
Dependent variable: Infant mortality
First pregnancy 0.002 0.002 0.002 0.002 0.002
(0.003) (0.004) (0.005) (0.005) (0.005)
Forest cover 0.004** 0.004 0.003 0.008 0.008
(0.002) (0.004) (0.004) (0.005) (0.005)
Forest cover*First pregnancy -0.011*** -0.012*** -0.012*** -0.012*** -0.012***
(0.004) (0.004) (0.004) (0.004) (0.004)
District-level fixed effects X X X X X
Child-level controls, DHS survey
indicators X X X X
District time-varying controls X X X
Island-year indicators X X
Province-level linear time trends X
Observations 13,078 13,078 13,078 13,078 13,078
R-squared 0.026 0.043 0.043 0.045 0.047
Robust standard errors (clustered at the district-level) in parentheses. *** p<0.01, ** p<0.05, * p<0.1. Forest cover during the year in which a woman spent her early pregnancy is measured as within-district z-scores. Child-level control variables include gender of the child, age of the mother at birth and its squared term, mother’s education, and indicators for multiple birth, rural residence, wealth index and birth month. District time-varying controls are precipitation and temperature z-scores, and log real GDP per capita. Sample includes children born 1-5 years before the DHS surveys. Mean infant mortality for children from higher order pregnancies and from first pregnancies are 0.034 and 0.037 respectively.
Forest cover declines appear to engender a decrease in mortality among higher order
infants, the control group. This indicates that the income benefits from deforestation
(Edwards, 2018) might be compensating for any risks experienced by these infants due to
deforestation (for example, due to air pollution). The relationship is, however, statistically
insignificant in column 5 which contains the full set of controls.12
The main variable of interest shows that first pregnancy order infants, those who are
disproportionately harmed by maternal malaria, do indeed face a higher risk of death relative
to other infants when exposed to forest cover declines in utero. This relationship is robust to
the inclusion of different controls and is statistically significant at the one percent level. The
likelihood of death for a first versus a higher order infant increases by about one percentage
19
point when forest cover falls by one standard deviation within a district.13 Since 3.7 percent
of first pregnancy children in my sample die in infancy, the point estimate on the variable of
interest represents almost one third of all deaths in this group. Estimates from the public
health literature suggest that three to thirty percent of infant mortality in malaria-endemic
regions could be because of the disease (Lucas, 2013). Since I am likely capturing only a
portion of malaria-induced mortality among first pregnancy order children, that which is due
to deforestation, malaria deaths among this subset of infants in Indonesia could be higher
than the range expected based on these prior studies.
5.2. Mortality at different phases of infancy, foetal loss and birthweight
A child’s infancy consists of two phases—the first 27 days of life are referred to as the
neonatal period and the rest of a child’s first year of life is called the post-neonatal period.
Infants are most vulnerable during the former phase (Lawn et al, 2005) and in fact 261 of the
459 infant deaths in the study sample (57 percent) occur during this period. Neonatal deaths
are more likely to arise due to circumstances prevailing during the prenatal phase and the
time of birth, while post-neonatal deaths are shaped to a greater extent by conditions after
birth (Rowley et al, 1994).14 Since the gravidity-specific variation in health outcomes that I
exploit stems from exposure of mothers to malaria during pregnancy, we would expect the
heightened risks from forest loss for first gravidity children to be concentrated in the period
soon after birth than in the later part of infancy. In this section, I examine whether this is
indeed the case.
13 The magnitude of the forest coefficient for first pregnancy children is larger and opposite in sign to the standalone forest coefficient. The latter captures how first gravidity children would fare under deforestation if it wasn’t accompanied with the malaria increases that endanger them disproportionately. This indicates that all the malaria and non-malaria factors that move with deforestation bring about a net increase in infant mortality for the first child.
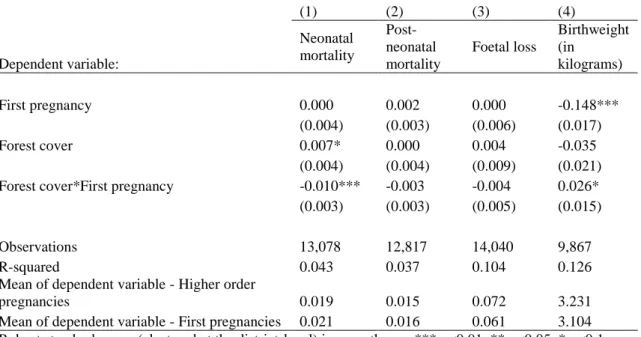
In Table 3, I look at the implications of forest loss for first pregnancies separately for the
neonatal and post-neonatal periods (columns 1 and 2 respectively). I find that forest cover
reductions increase the mortality risks faced by first children relative to higher order children
in the neonatal period (a one percentage point decline), but not in the post-neonatal period
(the coefficient is negatively signed, but statistically insignificant).15 The time at which the
observed pregnancy order-specific mortality patterns are manifested strengthens the argument that the results stem from women’s exposure to malaria during pregnancy.
Table 3: Forest cover and its relationship with mortality at different phases of infancy, foetal loss and birthweight
(1) (2) (3) (4)
Dependent variable:
Neonatal mortality
Post-neonatal mortality
Foetal loss
Birthweight (in
kilograms)
First pregnancy 0.000 0.002 0.000 -0.148***
(0.004) (0.003) (0.006) (0.017)
Forest cover 0.007* 0.000 0.004 -0.035
(0.004) (0.004) (0.009) (0.021)
Forest cover*First pregnancy -0.010*** -0.003 -0.004 0.026*
(0.003) (0.003) (0.005) (0.015)
Observations 13,078 12,817 14,040 9,867
R-squared 0.043 0.037 0.104 0.126
Mean of dependent variable - Higher order
pregnancies 0.019 0.015 0.072 3.231
Mean of dependent variable - First pregnancies 0.021 0.016 0.061 3.104 Robust standard errors (clustered at the district-level) in parentheses. *** p<0.01, ** p<0.05, * p<0.1. Forest cover during the year in which a woman spent her early pregnancy is measured as within-district z-scores. The district fixed effects models control for gender of the child, age of the mother at birth and its squared term, mother’s education, and indicators for multiple birth, rural residence, wealth index and birth month. Other controls are island-year indicators, province-level linear time trends, DHS survey indicators, district-level precipitation and temperature z-scores, and per capita log real GDP. The model in columns 3 does not include gender, multiple birth and birth month controls. Sample includes
pregnancies occurring 1-5 years before the DHS surveys.
It is important to point out that infant mortality is not the only poor birth outcome that
could arise because of maternal malaria. Infected women also face higher risks for
miscarriages and stillbirths (Guyatt and Snow, 2004; Nosten et al, 2004; Desai et al, 2007).
Thus, concentrating on only live births could understate the potential early life risks posed by
21
deforestation. Using DHS data on the date when women “had a pregnancy that miscarried,
was aborted, or ended in a stillbirth”, I create an indicator for pregnancies ending in foetal
loss (Statistics Indonesia and Macro International, 2008).16 Unfortunately, it is not possible to
identify which of the foetal losses were due to abortion. 962 or about seven percent of
pregnancies did not lead to a live birth.
I probe the foetal loss outcome with model (2) in the third column of Table 3.17 For
pregnancies that did not lead to live births, information such as gender of the child and
whether it was a multiple pregnancy is not available, and so the specification for this outcome
has a smaller set of control variables.18 The coefficient of interest does not attain statistical
significance but its sign indicates that forest declines might be more likely to bring about the
loss of first pregnancies than later pregnancies. Note that foetal loss is likely to be measured
with error because of recall issues, thus leading to a situation with error in the dependent
variable (Beckett et al, 2001).19 The resulting reduction in power could be responsible for the
imprecise estimate that I obtain. Nevertheless, it is unclear from the results whether foetuses
during first pregnancies are disproportionately endangered by deforestation.
In the last column of Table 3, I examine the outcome of birthweight (in kilograms), a
likely outcome of maternal malaria and a strong predictor for infant mortality (Guyatt and
Snow, 2004; Desai et al, 2007). Children born from first pregnancies amidst forest loss
16 Since the main infant mortality sample includes births that took place one to five years before the surveys, I only keep foetal losses occurring one to five years prior to each DHS.
17 The foetal loss sample is larger than the main infant mortality sample since it includes pregnancies not leading to live births.
18 While women were asked about the month in which their pregnancies ended, there is a lot of missing data for this variable and so I do not include month as a control variable when exploring foetal loss. Age of mother at birth is replaced with age of mother when the pregnancy ended.
appear to be smaller, which suggests that birthweight is a mechanism for the main results that
I identify.
5.3. Heterogeneity in results
Given the differences in malaria prevalence and forest cover across Indonesia’s islands,
there is likely to be heterogeneity in deforestation’s consequences for infant mortality across
regions. In Table 4, I estimate model (2) separately for the four forest islands. The results
indicate that in all islands, children from first pregnancies face a higher risk than other
children when forest cover declines. While the coefficients on the variable of interest for the
different islands are not statistically different from each other, the point estimates are largest
in magnitude for the two islands where the risk for P. falciparum malaria is the highest
(Elyazar et al, 2011)—Kalimantan and Papua. This suggests that there is likely to be regional
heterogeneity in malaria spikes from deforestation. In fact, in Papua, where a larger
proportion of individuals are at risk for malaria than in other islands, the estimate is three
times that of the main sample. It is, however, statistically insignificant, likely due to the small
sample size.
Table 4: Forest cover and infant mortality - heterogeneous effects by island
(1) (2) (3) (4)
Dependent variable: Infant mortality
Sample restricted to: Sumatra Kalimantan Sulawesi Papua
First birth 0.008 -0.004 -0.003 -0.024
(0.007) (0.009) (0.009) (0.026)
Forest cover 0.005 0.003 0.016 0.042
(0.007) (0.010) (0.010) (0.041)
Forest cover*First pregnancy
-0.014** -0.017*** -0.007 -0.037 (0.006) (0.006) (0.007) (0.027)
Observations 5,903 2,490 3,753 932
R-squared 0.043 0.069 0.054 0.089
23
district-level precipitation and temperature z-scores, and per capita log real GDP. Sample includes children born 1-5 years before the DHS surveys.
Papua also has a high concentration of primary forests. Indonesia’s primary forests
are categorized as conservation and protection zones, and it is illegal to conduct logging in
these areas; secondary forests are in production and conversion zones (and include
commercial forests such as palm oil and pulp plantations) where some logging is permitted
(Margono et al, 2014). While the median district in Papua had 41 percent of its area covered
in primary forests at the beginning of the study period, the same figure for the other islands
was only 11 to 24 percent.
Given that Indonesia’s secondary forests are fragmented and logged to a much greater
extent than the primary forests, the ecological makeup of these forests is very different.
Primary forests have rich biodiversity and so forest loss could threaten species that prey on
mosquitos, leading to spikes in mosquito populations. Secondary forests are unlikely to have
this channel for mosquito control in the first place (Garg, 2017). In line with past evidence
from Indonesia (Pattanayak et al, 2010; Garg, 2017), I find that deforestation in primary
forests contributes to higher first child mortality risks (Table A2 in Appendix A). Changes in
secondary forest cover or concurrent changes in both types of forest cover do not seem to
significantly shape the first versus later child mortality differential. The variation in the
malaria implications of deforestation in different types of forests points to why children from
first pregnancies might be at greater risk due to forest loss in the primary forest-rich island of
Papua.
In Figure A2 in Appendix A, I also present the results I obtain when I estimate model (2)
gender. While the variable of interest is signed consistently throughout, it appears that the
poor, rural residents and male infants might be driving the results in the entire sample. Forest
cover changes might have more of an impact on poorer and rural populations since they
possibly live closer to forested areas and/or are more dependent on them for livelihoods or
consumption purposes than their richer and urban counterparts. In utero exposure to
deforestation-induced malaria might harm male foetuses more than female foetuses since the
former are more susceptible to shocks during the prenatal period (Kraemer, 2000; Eriksson et
al, 2010).
6. Robustness checks
6.1. Contemporaneous changes
In this section, I investigate if non-malaria factors moving concurrently with district
forest cover levels shape first and higher pregnancy order infants differently. If so, the results
I see might be because of these other changes and not solely because of deforestation-induced
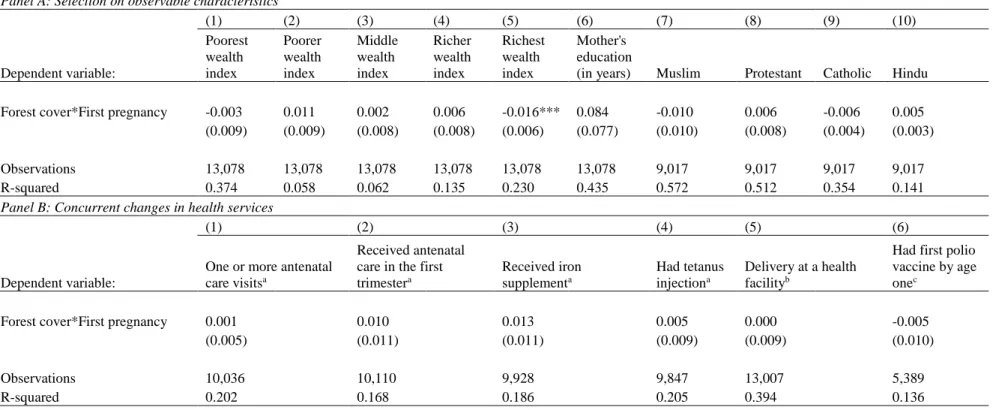
Table 5: Maternal characteristics and concurrent health services Panel A: Selection on observable characteristics
(1) (2) (3) (4) (5) (6) (7) (8) (9) (10)
Dependent variable: Poorest wealth index Poorer wealth index Middle wealth index Richer wealth index Richest wealth index Mother's education
(in years) Muslim Protestant Catholic Hindu
Forest cover*First pregnancy -0.003 0.011 0.002 0.006 -0.016*** 0.084 -0.010 0.006 -0.006 0.005 (0.009) (0.009) (0.008) (0.008) (0.006) (0.077) (0.010) (0.008) (0.004) (0.003)
Observations 13,078 13,078 13,078 13,078 13,078 13,078 9,017 9,017 9,017 9,017
R-squared 0.374 0.058 0.062 0.135 0.230 0.435 0.572 0.512 0.354 0.141
Panel B: Concurrent changes in health services
(1) (2) (3) (4) (5) (6)
Dependent variable:
One or more antenatal care visitsa
Received antenatal care in the first trimestera
Received iron supplementa
Had tetanus injectiona
Delivery at a health facilityb
Had first polio vaccine by age onec
Forest cover*First pregnancy 0.001 0.010 0.013 0.005 0.000 -0.005
(0.005) (0.011) (0.011) (0.009) (0.009) (0.010)
Observations 10,036 10,110 9,928 9,847 13,007 5,389
R-squared 0.202 0.168 0.186 0.205 0.394 0.136
Robust standard errors (clustered at the district-level) in parentheses. *** p<0.01, ** p<0.05, * p<0.1. Forest cover during the year in which a woman spent her early pregnancy is measured as within-district z-scores. The district fixed effects models also include the standalone forest cover variable, the first pregnancy indicator and the following controls: gender of the child, age of the mother at birth and its squared term, mother’s education, and indicators for multiple birth, rural residence, wealth index and birth month. Other controls are island-year indicators, province-level linear time trends, DHS survey indicators, district-level precipitation and temperature z-scores, and per capita log real GDP. During the years in which the DHS collected religion information, 99 percent of the children’s mothers belonged to the four religious groups I examine in columns 7-10 in Panel A. Sample includes children born 1-5 years before the DHS surveys.
aThese variables are available for the last birth of each woman in the five years before the survey. bThis indicator is available for all births in the five years before the survey.
cThis was collected only by DHS 2002 and DHS 2007 for all surviving children born in the five years preceding the surveys.
2
In Panel A of Table 5, I explore whether the primigravidae experiencing lower forest
cover are different from the other women in my sample. Specifically, I estimate equation (2)
with various maternal features as outcomes—wealth, education and religion.20 In Panel B, I
examine whether women exposed to forest loss during their first pregnancy (and their
children) obtained or were targeted by differential levels of health services—any antenatal
care, antenatal care in the first trimester of pregnancy, iron supplementation during
pregnancy, a tetanus injection while pregnant, delivery at a health facility and child polio
vaccination by age one.
The results demonstrate that the primigravidae facing forest loss are not
systematically different from the other women in the sample. The coefficient on the variable
of interest is statistically significant for only one of the 16 outcomes I test for—women
experiencing deforestation during their first pregnancy are more likely to be from the
wealthiest strata. Note though that I control for wealth index in all models. Also, given that
the richest women are likely to have higher nutritional status and healthcare access than other
women, they are expected to experience better birth outcomes. Thus, the higher likelihood of
first pregnancy among the richest during deforestation should actually work against finding
greater risks for first pregnancy children during forest loss. Overall, the findings in Table 5
support the argument that the observed first child disadvantages are not stemming from other
contemporaneous factors.
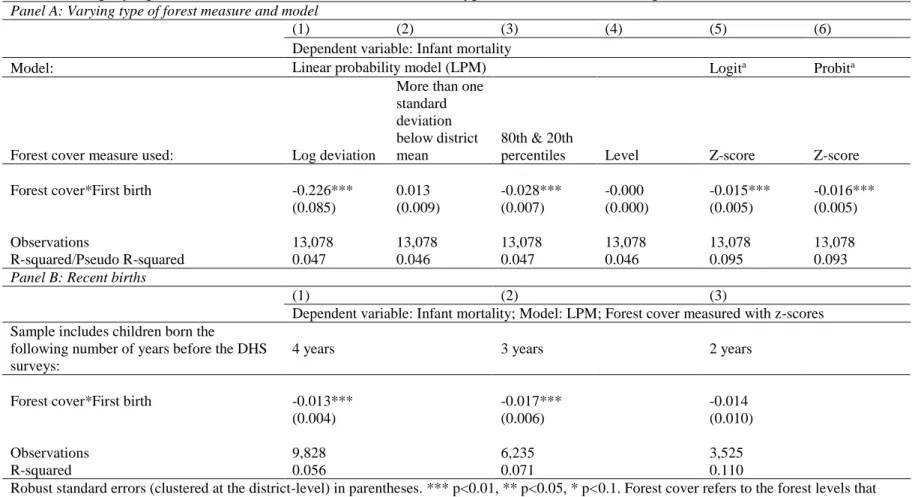
Table 6: Employing different forest cover measures and other types of models, Examining recent births Panel A: Varying type of forest measure and model
(1) (2) (3) (4) (5) (6)
Dependent variable: Infant mortality
Model: Linear probability model (LPM) Logita Probita
Forest cover measure used: Log deviation
More than one standard deviation below district mean
80th & 20th
percentiles Level Z-score Z-score
Forest cover*First birth -0.226*** 0.013 -0.028*** -0.000 -0.015*** -0.016***
(0.085) (0.009) (0.007) (0.000) (0.005) (0.005)
Observations 13,078 13,078 13,078 13,078 13,078 13,078
R-squared/Pseudo R-squared 0.047 0.046 0.047 0.046 0.095 0.093
Panel B: Recent births
(1) (2) (3)
Dependent variable: Infant mortality; Model: LPM; Forest cover measured with z-scores
Sample includes children born the
following number of years before the DHS surveys:
4 years 3 years 2 years
Forest cover*First birth -0.013*** -0.017*** -0.014
(0.004) (0.006) (0.010)
Observations 9,828 6,235 3,525
R-squared 0.056 0.071 0.110
Robust standard errors (clustered at the district-level) in parentheses. *** p<0.01, ** p<0.05, * p<0.1. Forest cover refers to the forest levels that prevailed in a district during the year in which a woman spent her early pregnancy. The district fixed effects models also include the standalone forest cover variable, the first pregnancy indicator and the following controls: gender of the child, age of the mother at birth and its squared term, mother’s education, and indicators for multiple birth, rural residence, wealth index and birth month. Other controls are island-year indicators, province-level linear time trends, DHS survey indicators, district-level precipitation and temperature z-scores, and per capita log real GDP. Sample includes children born 1-5 years before the DHS surveys.
aThe reported estimates capture the difference between the marginal effect of forest cover change on the mortality of firstborn infants and the
marginal effect on later born infants.
6.2. Alternative forest cover measures and models
While I capture forest cover variation with within-district z-scores for my main analysis, I
gauge the sensitivity of the results to alternative measures of forest change within districts. I
use variables akin to those that have been used to explore the consequences of rainfall shocks.
I present these estimates in Panel A of Table 6. The log deviation measure in column 1 captures the difference in the natural logarithm of annual forest cover during a woman’s early
pregnancy and the natural logarithm of mean annual forest cover in her district over the study
period (used in Rocha and Soares, 2015). Column 2 uses an indicator variable for very low forest cover and is coded one when forest cover during a woman’s pregnancy lies more than
one standard deviation below the average annual district forest cover between 2000 and 2008
(also from Rocha and Soares, 2015). In column 3, I create a variable that is equal to one if
forest cover in a district during a particular year is more than the 80th percentile of the
distribution of annual forest cover in the district during the study period, negative one if it is
less than the 20th percentile and zero if it is in between (as in Jayachandran, 2006 and Shah
and Steinberg, 2017). Finally, column 4 uses the total forest cover in a district in a year.21
Looking at the variable that identifies the implications of varying forest cover specifically
for first children, I find that while a change in the absolute levels of forest cover do not seem
to matter (the coefficient in column 4 is essentially zero and statistically insignificant), a
change in district forest cover that is sizeable given mean forest levels does make a
difference. The coefficient of interest in column 2 is just outside the range of significance (its
p-value is 0.125) but it is signed in the expected direction, implying that very low district
forest cover increases the mortality risk of first gravidity children.
29
Recall that I use LPM for the main analysis. In the last two columns of Panel A in Table
6, I estimate equation (2) with the logit and probit models. The infant mortality results are
consistent with those from the main specification.
6.3. Migration concerns
In assigning district forest cover measures to births, I assume that the district a survey
respondent lives in at the time of the DHS is the district she lived in during all her
pregnancies. Unfortunately, the DHS did not collect information about respondents’
migration history and so it is possible that I link some births to the forest cover of districts to
which mothers moved after a pregnancy. To gauge whether my results are driven by any
potential inaccurate assignment of forest cover, I now focus on more recent births—those that
took place two to four years before the survey in which they were recorded instead of the five
year limit that I use in the main analysis—since these are more likely to have occurred in the
districts women lived in at the time of the survey.22
The estimates for recent births are presented in Table 6, Panel B. The results indicate that
forest loss is more dangerous for first pregnancy children than for other children, but the
coefficient loses significance in the last column. Note that the sample size has fallen
substantially, which could lead to low power.
In Appendix C, I also discuss why general migration trends in Indonesia are unlikely to
affect the findings of my analysis.
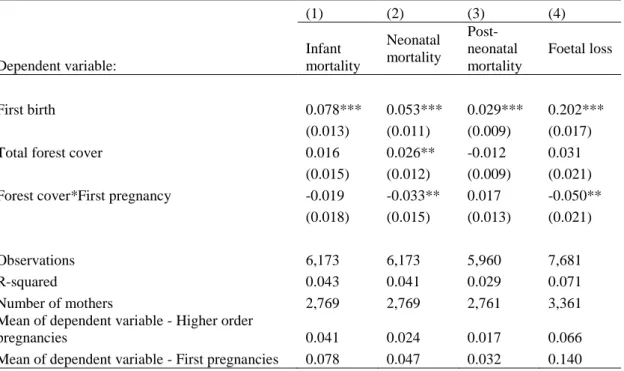
6.4. Using a maternal fixed effects approach
As a final test, I estimate a model that is similar to equation (2) but that has a finer level
of fixed effects—maternal fixed effects. In other words, I control for time-invariant
heterogeneity at the level of mothers and essentially explore whether the mortality differential between a woman’s first child and higher pregnancy order children varies with forest cover
changes.
For this analysis, I identify women who had a first pregnancy and had two or more
pregnancies during the study period (2000-2008). To make sure I have adequate sample size,
I do not restrict pregnancies to only those that took place in the five years before a DHS as I
do in the main sample. I do not use the maternal fixed effects framework as my main
estimation approach because of the recall bias issues that arise when using information on
pregnancies that took place a long time ago and because in the absence of migration
information, using more recent pregnancies increases the chances of accurately linking these
to the districts in which they had taken place. Notwithstanding these limitations with the
maternal fixed effects approach, it is useful to check whether the sign and significance of the
coefficient of interest from the main model hold when using this alternative model.
Table 7: Results from maternal fixed effects models
(1) (2) (3) (4)
Dependent variable:
Infant mortality
Neonatal mortality
Post-neonatal mortality
Foetal loss
First birth 0.078*** 0.053*** 0.029*** 0.202***
(0.013) (0.011) (0.009) (0.017)
Total forest cover 0.016 0.026** -0.012 0.031
(0.015) (0.012) (0.009) (0.021)
Forest cover*First pregnancy -0.019 -0.033** 0.017 -0.050**
(0.018) (0.015) (0.013) (0.021)
Observations 6,173 6,173 5,960 7,681
R-squared 0.043 0.041 0.029 0.071
Number of mothers 2,769 2,769 2,761 3,361
Mean of dependent variable - Higher order
pregnancies 0.041 0.024 0.017 0.066
31
Robust standard errors (clustered at the district-level) in parentheses. *** p<0.01, ** p<0.05, * p<0.1. Forest cover during the year in which a woman spent her early pregnancy is measured as within-district z-scores. The within-district fixed effects models control for gender of the child, age of the mother at birth and its squared term, indicator variables for multiple birth and birth month. Other controls are island-year indicators, province-level linear time trends, district-level precipitation and temperature z-scores, and per capita log real GDP. Column 4 includes all these controls except for child gender, multiple birth and birth month. Sample includes births to women who had their first birth and had more than one birth during the study period (2000-2008).
I present results from the maternal fixed effects specification in Table 7. The coefficient
on the interaction term between forest cover and the first pregnancy indicator (column 1) is
signed as expected for the infant mortality model, but it is statistically insignificant. However,
as in the main results, a decline in forest cover significantly increases the mortality risks
experienced by first children relative to other children in the neonatal period of infancy
(column 2), but not in the post-neonatal period (column 3). The last column shows that deforestation disproportionately endangers foetuses during women’s first pregnancy,
qualitatively similar to what I find in the main sample.23 Overall, Table 7 points to the
robustness of the district fixed effects estimates. Recall, however, that due to the conditions
used to identify women for the maternal fixed effects specification, this sample is smaller
than the sample of all women giving birth in the forested districts of Indonesia during the
study period. The two samples appear to be systematically different—for example, the
comparisons in Table A3 in Appendix A show that the mothers in the maternal fixed effects
sample have more education and are wealthier. Given such differences, the magnitude of the
estimates from the maternal fixed effects specification might not be widely generalizable.
7. Discussion and Conclusion
The evidence from this analysis demonstrates that in Indonesia between 2000 and 2008,
infants born from first pregnancies faced a greater risk of mortality compared to other infants
when exposed to deforestation in utero. Of the various potential consequences of forest cover
decline, only malaria is known to have such gravidity-specific effects. I find that when forest
cover fell by one standard deviation within districts, the likelihood of death for a first
pregnancy infant relative to other infants increased by one percentage point.
To provide a sense of what the point estimate capturing the consequences of forest
decline for first pregnancies translates into in terms of actual infant deaths, I conduct some
back of the envelope calculations. The DHS 2007 country report contains several of the
indicators I need for this estimation and so I perform this exercise for the year 2007. The
crude birth rate in Indonesia was 20.9 per 1,000 individuals. Given that the 2007 population
in the study districts was about 77.4 million (this population data is from the World Bank
DAPOER dataset), the birth rate implies that there were roughly 1.6 million births in these
districts. Now to identify how many of these births were likely to have been first births, I
divide the number with Indonesia’s total fertility rate (2.6 births per woman) to reach an
estimated 621,937 live first births.24 The 0.012 coefficient on the variable of interest from the
main results (Table 2, column 5) indicates 12 deaths in 1,000 livebirths. Thus, if district
forest cover fell by one standard deviation in 2007, it would lead to 7,463 deaths among all
the live first births in the study districts.25 These deaths constitute 35 percent of the deaths
that would have occurred among first born children under the 2007 infant mortality rate in
Indonesia (34 deaths among every 1,000 live births).
It should be kept in mind that the results of this study convey the implications of
deforestation for infant mortality only within the specific context (Indonesia) and timeframe
(2000-2008) that I examine, and thus might not be widely generalizeable. Furthermore, the
24 Here I use the number of first births to proxy for the number of first pregnancies.