1
Inequality in G20 countries:
Causes, impacts, and policy responses*
International Labour Organization
Korea Institute for International Economic Policy
G20 Employment Working Group
23-25 July 2015
Cappadocia, Turkey
* This note provides a short, non-technical summary of the findings of the ILO-KIEP joint research project on “Inequality in G20 countries: Causes, impacts and policies”. A technical summary is attached as an Annex to this note. Full papers will be available on line later this year.
2 Inequality on the G20 agenda
Many G20 countries have witnessed an increase in inequality over recent decades. In most cases this is also associated with a sustained downward trend in the labour income share. These persistent trends have translated into significant losses for middle- and lower-income workers. Widening inequality and declining labour income shares not only pose challenges for social and political cohesion, but a growing body of evidence shows that these trends also have significant economic costs in terms of both the level and stability of economic growth. Therefore there is a significant risk that these trends may work against the G20 Leader’s goal of strong, sustainable and balanced growth, most notably their collective commitment to an additional 2 per cent growth by 2018. Moreover, inequality and growth are not competing objectives. Indeed, recent policy experiences show that effective policy interventions can contribute to reducing inequality while at the same time achieving better economic performance.
Against this background, the International Labour Organization (ILO) and Korea Institute for International Economic Policy (KIEP, the Republic of Korea) launched a joint research project in 2014 to investigate various dimensions of labour income share and income inequality from a wide range of perspectives. They probed the relationships between macroeconomic, fiscal, labour market, product market and income policies to inform on-going G20
discussions.
Declining labour income share tends to increase income inequality
The joint research based on a newly consolidated dataset confirms that changes in the labour income share have significant and negative impacts on personal income distribution as measured by Gini coefficients. At the G20 aggregate level, a one per cent reduction in the labour income share leads to an increase in inequality of between 0.1 and 0.2 per cent (as measured by the market income Gini index, i.e. before taxes and income transfers). The effects on disposable income, after redistributive tax and transfer policies, are smaller in most countries but disposable income inequality also rises when the labour share falls. Inequality has significant economic consequences
First, growing inequality and declining labour income share limit consumption of affected households, thus reducing overall aggregate demand. In some cases, the resulting
income/consumption squeeze can also lead to excessive household borrowing which, as the crisis demonstrated, may have adverse effects on economic stability. Second, these
negative consumption effects can in turn weaken investment, as firms do not see strong sources of future consumption demand. Third, the resulting cumulative negative effect on global demand may limit exports and reduce trade-related opportunities for economic growth. Fourth, fiscal revenues suffer as income taxes are typically the largest source of revenues, which in turn constrains public investments in infrastructure, social protection and other labour market and social measures.
3
Empirical evidence is strong on the economic costs of inequality
Our research examines the potential economic impacts of the labour income share and inequality and the results indicate that:
(i) based on long time-series data, the declining labour income share has negative impacts on economic growth in advanced G20 countries, although with significant variation across countries and over time;
(ii) inequality above a certain level (identified at a disposable income Gini index of 24.5) may have detrimental effects on growth and, in our analysis, all G20 countries have inequality levels beyond this threshold, typically well beyond it; and
(iii) inequality undermines the effectiveness of fiscal policies as fiscal multipliers tend to be smaller when inequality is higher (presumably due to consumption effects).
Labour market and social protection policies are key to reducing inequality Because declining labour share is a strong driver of rising inequality, redistribution policies alone are unlikely to be sufficient to reduce inequality and must be accompanied by policies to improve the labour income share. Indeed, our in-depth analysis of household income structure in G20 countries shows that, although some important variations between countries exist, the major source of income inequality is labour income (with tax and transfers only partially offsetting this). Policies of particular importance in this respect include ensuring wage growth in line with labour productivity growth and effective
minimum wages with strong compliance mechanisms. In addition, strengthening education and skills development programs have a role to play in increasing incomes and employability of low-skilled or vulnerable segments of the population. In terms of fiscal redistribution, important policies include improving effectiveness and coverage of social protection systems, with extension of income protection to non-standard and informal workers and making taxation system fairer and more progressive.
Competition and product market structure also play a role
Effective responses to inequality also require governments to look beyond these labour market and redistribution policies. Product markets are a case in point. The joint research project finds that lower levels of competition in product markets are associated with higher income inequality, especially at the top of the income distribution. Therefore, policies that increase competition, such as reducing firm entry costs, could also help to reduce inequality.
4 G20 action and coordination
The findings of the ILO-KIEP research project suggest that the issues of labour income share and inequality belong on the G20 policy agenda, both to increase growth and to ensure that it is more inclusive and equitable.
Appropriate policy responses span a broad range of channels from labour market to
macroeconomic and fiscal to product market and education policies. This requires effective collaboration between labour, social, financial, education and other ministries and
leadership from the heads of state and government. Thus, at the G20 level, an effective and comprehensive response would require well-coordinated discussion between the EWG, the FWG and the Sherpas.
5
ANNEX. Technical summary
ILO-KIEP Joint Research on Inequality in G20 countries: Causes, impacts and policies
This joint project aims to contribute to the on-going global debate onincome inequality, including its relationship to growth, and to explore the potential for new policy approaches in which equity, growth and stability reinforce one another. A growing body of literature has suggested that the widening inequality in recent years was one of the major causes of the Great Recession, yet there is not yet consensus on what policy measures would bring the global economy back to a sustainable growth path while also reducing inequality. The premise of this project is the explicit recognition that: (a) inequality is affected by policies and institutions, among other things; (b) inequality has both social and economic consequences; (c) therefore there is an economic as well as a social case for “regulating” inequality.
The project includes six inter-related research components:1
Measurement and sources of inequality
I. Dimensions of income distribution: labour income share (market distribution) and personal income distribution (secondary distribution)
II.Decomposing sources of household income and relationship to inequality III. Inequality and product market competition
IV. Inequality and fiscal policy effectiveness Inequality and growth
V.Inequality and growth (I): Labour income share – long-run effects
VI. Inequality and growth (II): Personal income distribution – nonlinear evidence from heterogeneous panel data
I. Dimensions of income distribution: labour income share and personal income distribution
What has happened to income distribution in G20 countries? An increasing body of
evidence shows that a widening of inequality has taken place within the income distribution of most G20 countries. However its main causes continue to be debated, in part because income inequality can be defined and measured in a number of ways and existing studies tend to look at one particular dimension of income distribution which in turn is often closely related to a particular set of policies. To address this challenge, we create a harmonized
1
6
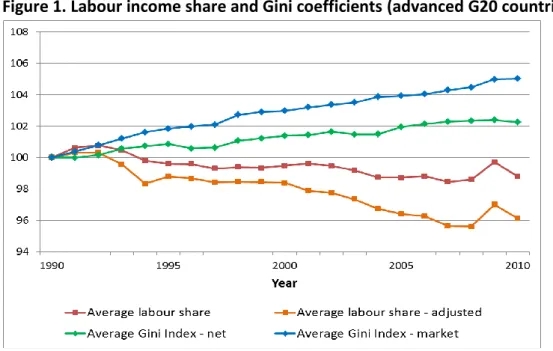
income inequality database for G20 countries and investigate the three dimensions of income inequality, notably labour income share (functional income distribution), market income distribution and disposable income distribution and their inter-relationships. We find that first, and perhaps not surprisingly, the three dimensions of income distribution have moved together in recent years. At the G20 aggregate level, reduction in the labour income share among advanced economies is strongly and negatively associated with increases in both market2 and disposable3 income Gini indexes (Figure 1).4 In other words, labour and capital incomes have become more unequally distributed over time.
Figure 1. Labour income share and Gini coefficients (advanced G20 countries)
Note: base year =1990
Source: ILO estimates (ILO inequality data set)
Second, the most significant source of widening inequality in recent years is the functional income distribution, between the labour income share and capital income share, which has witnessed a large shift in favour of capital income in almost all G20 countries. Among G20 countries it is estimated that a one per cent reduction in the labour income share leads to between 0.1 and 0.2 per cent increase in the market income Gini index (subject to
estimation methods).
Third, the disposal income (after taxes and transfers) Gini index also increases as the labour share declines, but at a smaller pace than that of the market income Gini index. This is due to the impact of redistribution measures.
2 Market income comprises labour income, capital income and private transfers.
3
Disposable income is defined as market income plus social transfers (contributory and non-contributory) minus contributions to social security and taxes.
4 Among emerging G20 countries, the story is more mixed but the general pattern of the three dimensions of
7
Fourth, the parallel movement and consistent trend witnessed among the three dimensions of income distribution at the G20 level masks considerable variation between countries. The Gini coefficient for market income inequality has risen in China, Spain, Mexico, the United Kingdom, and the United States; it has remained the same in France, Italy, and the Republic of Korea; and it has declined in Argentina, Brazil, Turkey, and South Africa. The Gini coefficient of disposable income has declined or remained the same in most of the countries over the past decade, except in Mexico and Spain, where inequality in disposable income increased. Some countries (typically, advanced economies of G20) tend to have a smaller correlation coefficient between functional and personal income distribution, while others such as China have a much larger coefficient. Such cross-country variations indicate the important role of policies and institutions in the area of income distribution.
II. Inequality, jobs, and social protection: decomposing household income
Research component II explores the contribution of different components of income to income inequality at the household level and assesses the extent to which the contribution of each factor has changed over time. We employ a micro perspective using micro data surveys.5
Increases in market income inequality have been largely driven by changes in the
distribution of wages and incomes in the majority of the countries. A detailed analysis of different sources of income shows that labour markets are central to the evolution of
market income inequality. Labour income is the most important source of income for all the G20 countries and constitutes more than 75 per cent in most emerging economies and the United States, while in the European countries and Turkey it ranges between 55 and 70 per cent. Within labour income, it is the wage income that contributes by far the most to inequality in all countries.
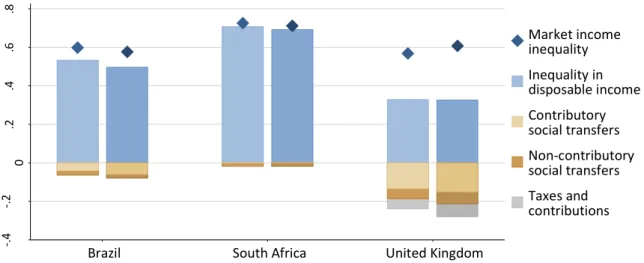
On the other hand, the analysis shows that social transfers6 and taxes have been quite effective in reducing the market income Gini coefficient, by between 10.3 percentage points in Brazil and 29 percentage points in France, depending upon the redistributive policy adopted by the country.7 In Brazil, contributory and non-contributory social transfers have played a significant role in reducing inequality, while the role of taxes and social
5
The countries for which the analysis is undertaken are: Brazil, China, France, Italy, Mexico, the Republic of Korea, South Africa, Spain, Turkey, the United Kingdom and the United States for the period mid-2000s to the latest available year. The analysis here is a point-to-point comparison which may be sensitive to the selection of years analysed, although every effort was made to minimize this potential bias. Apart from establishing the trends in inequality, we are much more interested in how different sources of incomes are associated with overall inequality.
6 Social transfers encompass contributory and non-contributory transfers such as pensions, unemployment
benefits and child support grants, which the households receive during the year. 7
8
contributions to social security8 has been very small. In South Africa, market income inequality is very high and non-contributory state transfers, especially old age and child support grants have been able to reduce inequality by 0.2 percentage points. In the United Kingdom, market income inequality is as high as in Brazil, but the disposable income inequality is comparatively lower. This is due to the redistributive policies, as contributory and non-contributory social transfers as well as taxes and social contributions all play a role in reducing inequality in the United Kingdom (Figure 2, panel A).
Figure 2: Inequality Decompositions
A. From Market inequality to disposable income inequality, mid-2000s (left bar) and latest year available (right bar)
B. Decomposition of inequality in disposable income by income source
Note: Panel A uses an accounting framework, starting from market income inequality. Contributory social transfers, followed by non-contributory social transfers are added and taxes and contributions to social security deducted to arrive at disposable income. Panel B refers to the decomposition of inequality in total household income as proposed by Lerman and Yitzhaki (1985).
Source: Based on household survey data.
However, when we use the factor decomposition method, we find that in Brazil contributory social transfers increase inequality (Figure 2, panel B), which is also observed by other
8
Contributions to social security refer to contributions made by individuals in the working age group.
-. 4 -. 2 0 .2 .4 .6 .8 G ini c o ef fi ci en t
Brazil South Africa United Kingdom
Market income inequality Inequality in disposable income Contributory social transfers Non-contributory social transfers Taxes and contributions -. 5 0 .5 1 1 .5 R e lat iv e c o n tr ibu ti o n to t o tal in eq ual it y
Brazil South Africa United Kingdom
2005 2012 2005 2012 2005 2012
Wages Self-employment Contributory social transfers Non-contributroy social transfers Capital Private transfer Contributions Taxes
9
researchers. This could be because those with relatively better employment opportunities (e.g., permanent paid employment) have access to such social transfers while workers in the informal sector or own-account workers do not and this could further increase inequality. A similar trend is found for the United Kingdom in 2011. However, in the United Kingdom taxes, social contributions, and non-contributory social transfers all contribute to reducing inequality. In South Africa, while the additive approach showed a decline in inequality due to private transfers and non-contributory social transfers, these two sources did not significantly contribute to reducing inequality.
The analysis brings out that in most of the countries where income inequality fell, it was largely due to transfers and taxes. However, as labour market inequality increases, the burden on tax and transfer to address overall inequality also rises. In most of the countries, we observe that there is polarisation in the labour market as the real wage growth declines for those in lower deciles and increases for those in higher deciles. Some countries, like South Africa and Spain, also face the additional problem of high unemployment rates which requires developing a strategy for employment growth.
A failure to redress rising inequality in the market income distribution (falling labour share and increasing inequality across wages within the labour share) increases the costs of redistribution through taxes and transfers, in some cases to an economically and/or politically unsustainable level.
III. Income inequality and product market competition
While the labour market plays a crucial role in determining income inequality, the roles of other markets such as finance and product markets may also be a factor. We examine the extent to which the competition structure of the product market is associated with
inequality.
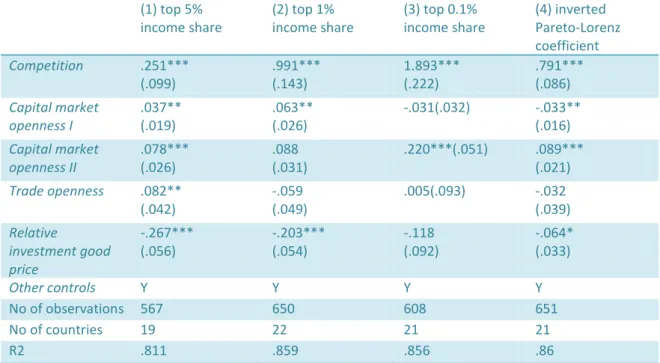
Using country-level panel data, we show that our measure of competition (i.e., mark-ups) is negatively related to labour share and positively related to income share of top income earners. Table 1 summarizes estimation results which all suggest a positive relationship between mark-ups and rising income inequality. In particular, the lack of competition (higher mark-ups) tends to be positively associated with the rise in income inequality (higher top 5%, top 1%, top 0.1% income shares, and inverted Pareto-Lorenz coefficient) after controlling for the factors which could influence income inequality (e.g., globalization and technological progress). Thus, the results suggest that policies to increase competition such as reducing entry cost and financial barriers should be an important part of inequality-reducing policy package.
10
Table 1: Regression of index for the lack of competition (mark-ups) on income inequality level (top 5%, 1%, 0.1% income shares and the inverted Pareto-Lorenz coefficient)
(1) top 5% income share
(2) top 1% income share
(3) top 0.1% income share
(4) inverted Pareto-Lorenz coefficient
Competition .251***
(.099) .991*** (.143) 1.893*** (.222) .791*** (.086) Capital market openness I .037** (.019) .063** (.026)
-.031(.032) -.033**
(.016) Capital market openness II .078*** (.026) .088 (.031)
.220***(.051) .089***
(.021)
Trade openness .082**
(.042)
-.059 (.049)
.005(.093) -.032
(.039) Relative investment good price -.267*** (.056) -.203*** (.054) -.118 (.092) -.064* (.033)
Other controls Y Y Y Y
No of observations 567 650 608 651
No of countries 19 22 21 21
R2 .811 .859 .856 .86
Notes:
(1) Analysis is limited to 22 countries for which relevant data are available (1950-2011), and robust results are obtained for the period of 1976-2011. Indices for income distribution are taken from Piketty’s World Top Income Database. To construct mark-ups, it is assumed that production function is homogeneous of degree 1 and a firm is a price taker in factor markets but has market power in output market. Then mark-ups are one divided by the sum of labour and capital shares. Two capital market openness measures in the above table are de facto and de jure measure of financial openness in Quinn and Toyoda (2008), trade liberalization index from PWT7.1, and relative investment good price come from Karabarbounis and Neiman (2014).
(2) Other controls include total factor productivity, index for financial depth, government expenditure, dummy for countries which are included in low or middle-low income countries, and dummies for country and year.
IV. Inequality and fiscal policy effectiveness
Inequality can also affect the effectiveness of government policy measures, especially fiscal policies. This issue is particularly relevant in the context of slow growth since the financial crisis, as many countries have been using monetary and fiscal policies to try to boost their economies. The effects of fiscal policy may be less (or fiscal multipliers may be smaller) where income inequality is high, due to effects on household consumption or other channels.
We compute cross-country fiscal multipliers―a change in output to a change in government spending―separately for two groups of countries in terms of income inequality: those with low and high inequality, with the threshold of 31.1 net income Gini, which is the median level of our sample countries. Our main findings (Figure 3) show that fiscal multipliers are large and significant in countries with lower inequality levels while fiscal multipliers in countries with high inequality level are small and are not significantly different from zero in our sample period. The results remain robust when analysis is done separately for high- and
11
low-income countries. Therefore, fiscal policies can have larger impacts when they include redistributive measures or are accompanied by complementary redistribution policies.
Figure 3. Fiscal multipliers by income inequality level A. Low inequality countries (<31.1 Gini)
B. High inequality countries (>31.1 Gini)
Notes:
(1) Dotted lines represent 90% confidence intervals based on 1000 Monte Carlo simulations.
(2) The sample includes a total of 42 economies for the period of 2000Q1-2007Q3. To control for income inequality across countries, the full sample is divided into two sub-samples (i.e., high and low inequality) using the median value of net-income Gini index which is 31.5%. For estimation, we use a cross-country panel Vector Auto-regression (VAR) model. The fiscal multiplier is calculated for each group over time, using the impulse-response function from the panel VAR system.
V. Inequality and growth (I): Labour income share – long-run effects
What are the economic impacts of the observed decline in the labour share of income? A number of recent studies have found a negative impact on growth of high or increasing inequality. Most of these empirical studies have relied on panel data estimation, due to the lack of available time series. However this approach has familiar limitations and produces an average coefficient across heterogeneous countries. Recently new historical time series have become available that allow us to produce single country estimations for the United Kingdom (1855-2010), France (1896-2010), and the United States (1929-2010).
We focus the analysis on how the relation between labour share and growth changes across different time spans. Both empirical studies and theoretical models tend to underline the
12
heterogeneity of the transmission channels as well as the heterogeneity of the speed at which they affect economic activities. For such analysis, we rely on wavelet analysis, which allows us to decompose a time series into its time and frequency components.
Our regression results show that although declining labour income shares may have short-term positive effects on economic growth, the relationship turns negative over the mid- to long-term. In addition, if the data are restricted to the 20th century, where the data have proven to be more reliable, falling labour income shares dampen growth even in the short-run.
Note: This table presents the regressions results across each time scale and for each country. The dependent variable is the growth rate of real GDP per capita. The independent variables are a constant and the labour share. The estimation method is HAC-OLS. The weights follow Newey-West. Long-run effects refer to the time span with 32 year or more.
VI. Inequality and growth (II): Personal income distribution – nonlinear evidence from heterogeneous panel data
Another way of looking at the economic impacts of inequality is to see how personal income distribution (e.g., Gini index) is associated with growth outcomes. This relationship has attracted much attention in recent years, but with mixed results. Departing from this conventional approach, we estimate nonlinear effects of income inequality on economic growth by panel smooth transition regression (PSTR) method.
Our analysis shows that an increase in income inequality spurs economic growth only when the Gini index is lower than a turning point of 24.5. Above that level rising inequality tends to deter growth. In 2007, only three of the countries in our sample of 77 countries
(Mauritius, Denmark, and Norway) had Gini indices below 24.5. Therefore, our result suggests that most countries are currently at levels of inequality which would slow
economic growth if inequality further worsened. The results are particularly significant for countries such as the US and China, in which inequality continues to increase. For countries with high-inequality, inequality-reducing policies would also be pro-growth.
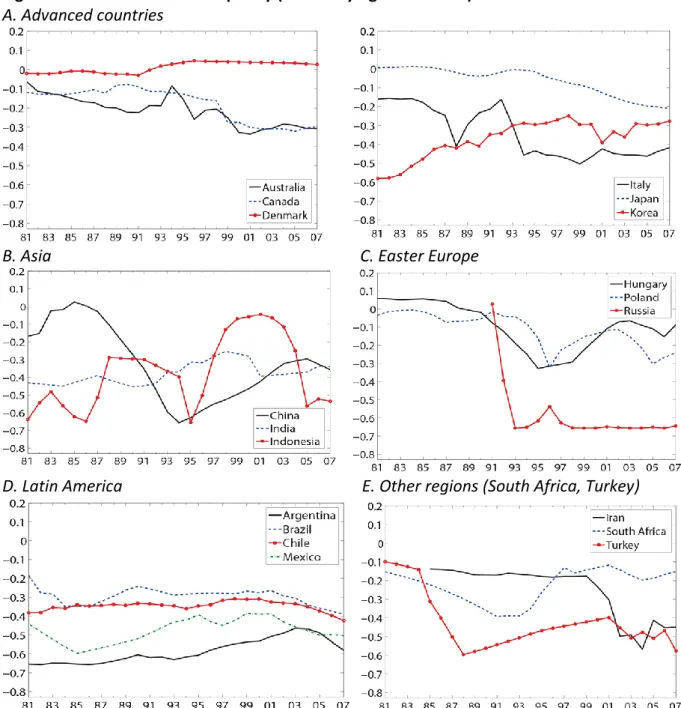
Figure 4 shows the time-trend of the growth effect of inequality for a selection of 28 countries (time-varying coefficients of the lagged Gini index). In most of the countries the
Table 2. How does the labour income share affect growth?: Regression results (long-run effects)
13
effects of inequality on growth are either negative for the whole sample period or turn from positive to negative.
Figure 4. Growth effect of inequality (time-varying coefficients): Selected countries A. Advanced countries
B. Asia C. Easter Europe
D. Latin America E. Other regions (South Africa, Turkey)
Notes: A panel smooth transition regression (PSTR) model is adopted to estimate time-varying effects of income inequality on economic growth. By using the PSTR model, it is assumed that the effects are evolving as the level of income inequality changes and that the regime switching is occurring very smoothly. The paper uses Gini index as a proxy for income inequality, and the annual Gini index is provided by ‘Standardized World Income Inequality Database (SWIID).’ The sample data covers total 77 countries (27 advanced and 50
developing countries) for the period of 1980-2007. The table below shows the level of income inequality which has been worsened in most of the country groups in the sample period.