Sharif University of Technology
Scientia IranicaTransactions A: Civil Engineering http://scientiairanica.sharif.edu
Structural damage detection using time domain
responses and Teaching-Learning-Based Optimization
(TLBO) algorithm
S. Fallahian
a;, A. Joghataie
b, and M.T. Kazemi
ba. Department of Civil Engineering, Sharif University of Technology, International Campus, Kish Island, Iran. b. Department of Civil Engineering, Sharif University of Technology, Tehran, Iran.
Received 16 November 2016; received in revised form 2 February 2017; accepted 12 June 2017
KEYWORDS Structural damage detection;
Time domain response;
Measurement noise; Teaching-Learning-Based Optimization (TLBO) algorithm; Analytical model.
Abstract. Lately, structural health monitoring has attracted much attention due to the construction of important and complex structures and their safety. One branch of structural health monitoring is damage detection, estimating the location and extent of eventual damages in the structural systems. In this study, an ecient method is introduced to determine the location and extent of damage in the frame, beam and truss structures using a time domain response and an optimization algorithm. First of all, the structural damage detection problem is formulated as a standard optimization problem. Thus, the optimization objective function is dened by using the acceleration of damaged structures and analytical model acceleration. The acceleration is obtained using the Newmark method. Damage is simulated by reducing the elasticity modulus of structural members. Then, damage problem converted to an optimization problem is solved by a Teaching-Learning-Based Optimization (TLBO) algorithm. Therefore, the exact location and extent of damage in a structure can be determined. In order to show the capabilities of the proposed approach for identifying structural damage, four illustrative test examples are considered considering measurement noise eect. The results clearly show that the proposed method is as a powerful method to detect multiple damages in structures.
© 2018 Sharif University of Technology. All rights reserved.
1. Introduction
Structures may be damaged during their operation time due to various reasons such as earthquake loading, fatigue due to loading and unloading high expected cycles, wind, and temperature changes. These damages may reduce the eciency of structures signicantly and
*. Corresponding author. Tel.: 021 66164237; Fax: 021 6601 4828
E-mail addresses: [email protected] (S. Fallahian); [email protected] (A. Joghataie); [email protected] (M.T. Kazemi).
doi: 10.24200/sci.2017.4238
lead to sudden collapse. For this reason, structural health monitoring and damage assessment are impor-tant. One of the most important stages of structural health monitoring is identifying location and determin-ing extent of damage. Damage identication methods are divided into two groups: static and dynamic meth-ods. Dynamic methods, compared with static methods, are more accurate and popular. Dynamic approaches are methods used from the dynamical response of a structure, such as natural frequencies, mode shapes, damping, etc.
During the last few years, many methods have been introduced to identify the site and extent of damage in the structural systems [1-6]. Pandey et
al. [7] provided an extensive overview on damage detection methods based on vibration. They argued that mode shape curvature could be a suitable index for damage detection in beams, for the rst time. In addition, they proposed that the curvature could be obtained numerically using modal displacement by central dierence approximation. Then, Sohn et al. [8] presented an updated version of this study. The extracted features to identify were used to classify damage identication methods in both articles. In addition to this classication, Carden and Fanning [9] presented a review of structural health monitoring literature by the papers published from 1996 to 2003. Maity and Tripathy [10] used Genetic Algorithm (GA) to detect and assess the structural damage by changing natural frequencies. Pawar and Ganguli [11] applied the genetic fuzzy system to detect the matrix crack in thin-walled composite structures based on changes in natural frequencies. Pawar et al. [12] studied the eect of damage on beams with xed boundary conditions by using Fourier analysis of mode shapes in the space domain. The damaged mode shapes expanded using a space Fourier series and a Damage Index (DI) formulated in the form of a vector of Fourier coecients. A neural network was used to detect the location and size of damage by Fourier coecients. Numerical studies showed that damage detection using Fourier coecients and neural networks has the capability to detect the site and extent of damage accurately. However, using this method has been limited only to beams with xed boundary con-ditions. Elshafey et al. [13] introduced a methodology based on which the modied normalized mode shape dierence technique can be used in the analysis of the vibratory response of beams. The results showed that the technique can be used successfully to identify the damage location. A two-stage method based on mode shape curvature and response sensitivity analysis was presented to identify damage in beams by Lu et al. [14]. Numerical simulations of dierent types of beams showed that the proposed method for damage detection is an exact and ecient method. Dawari and Vesmawala [15] presented a method based on modal curvature and modal exibility dierence for identifying and locating damage in reinforced concrete beams. In order to investigate the suitability of the method for implementing the algorithm, eigenvalues' analyses were carried out by nite-element models of the reinforced concrete beam, and the eigenvectors for dierent cases were extracted. Damage was considered as a local reduction in structural stiness, and this method detected eectively the existence of damage to locate the damage site for single and multiple damage cases in beams. Choi et al. [16] used the exibility index as a criterion in order to identify any damage in structures. They introduced a new index using changes
in the softening matrix of structure. According to the results of this study, the sensitivity of the proposed method to lower vibrational modes is more than the higher ones; this method cannot estimate the severity of damages well. Seyedpoor [17] presented a Modal Strain Energy-Based Index (MSEBI) for structural damage detection. In the rst stage, the modal strain energy was calculated using the modal analysis information extracted from a nite-element model. In the second stage, the extent of the actual damage was determined via a Particle Swarm Optimization (PSO) using the rst stage results. Numerical results indicate that the combination of MSEBI and PSO can provide a reliable tool to identify the multiple structural damages accurately. An articial neural network-based damage detection method using frequency response functions, which can eectively detect nonlinear damages for a given level of excitation, was presented by Bandara et al. [18]. Reliable results with experimental data for nonlinear damage detection were shown rendering the frequency response function-based method convenient for structural health monitoring. Zimin and Zimmer-man [19] compared time domain analysis with fre-quency domain analysis and also developed an exper-imental study based on structural health monitoring. These results showed to be a reliable indication of the existence of structural damage. This is demonstrated using simulated and actual experimental data. Studies by FU et al. [20] facilitate the identication of damages to one-cantilevered steel plates. Two illustrative test examples were considered in order to show the perfor-mance of the proposed method for identifying single or multiple damages. The eects of measurement noise and measurement point on the identication results were investigated. Studies in this paper indicated that the proposed method is ecient and robust for both single and multiple damages for plate structures. Good identied results can be obtained from the short time histories of a few number of measurement points. The investigation of various researches showed that fewer studies have been carried out on damage identication by the time domain.
Since the acceleration responses of structures can be measured simply by sensors and additional processing is not needed in comparison with extracting the other data such as modal data, FRF, etc., the main aim of the present study is to assess the potential of the acceleration response of a structure for damage detection based on an optimization problem. In this research, structural damage is assessed via the changes of acceleration response. Therefore, the response func-tion is calculated according to the principles of struc-tural dynamics via the Newmark method. Then, the structural damage detection problem is transformed into a standard form of an unconstrained optimization problem, and the nite-element method is also utilized
to evaluate the required structural response. Finally, numerical results demonstrate the eectiveness of the proposed method for structural damage localization.
2. Principles of structural dynamics and time domain response function
According to principles of structural dynamics, dier-ential equations governing the dynamical behavior of Multi-Degree Of Freedom (MDOF) structures are of second-order type as displayed in the following [21]:
M X + C _X + KX = F (t); (1) where K, M, and C are mass, stiness and damping matrix, respectively; X, _X, and X are vectors of dis-placement, velocity, and acceleration of the structure and F (t) is the external force vector.
2.1. Application of Newmark method for determining the structural response
Forced vibration responses of structures can be calcu-lated using Newmark direct integration. According to this method, we have to get displacement:
Xn+1= Ke1Fe; (2)
where Ke and Fe are equivalent stiness and force
obtained from Eqs. (3) and (4), respectively:
Ke= a0M + a1C + K; (3)
Fe=F + M(a0Xn+ a2X_n+ a3Xn)
+ C(a1Xn+ a4X_n+ a5Xn): (4)
Finally, Eqs. (5) and (6) are used to obtain acceleration and velocity vectors:
Xn+1= a0(Xn+1 Xn) a2X_n a3Xn; (5)
_
Xn+1= _Xn+ a6Xn+ a7Xn+1: (6)
In the above equation, the coecients of Newmark are obtained from:
a0= t1 2; a1= t ; a2= t1 ;
a3= 21 1; a4= 1; a5= t2
2
;
a6= t(1 ); a7= t: (7)
In addition, for coecients and , we have: = 14(1 + )2; = 1
2 + ; (8) where is considered equal to zero in this study.
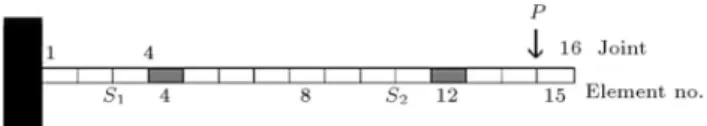
Figure 1. Cantilevered beam having a damage case induced at elements 4 and 12.
In order to compare displacement, velocity, and acceleration responses, a 15-element cantilevered beam as shown in Figure 1 is considered [1,22]. The length, thickness, and width of the beam are 2740, 6.35, and 76 mm, respectively. The mass density is 7860 kg/m3
and the elasticity modulus is 210 GPa. In this example, damage variables are dened here through a relative reduction of elasticity modulus in each element as follows:
xi= E EE i; i = 1; 2; : : : :; n; (9)
where E is the original modulus of elasticity, and Ei
is the nal modulus of elasticity of the ith element. As a damage case, the relative reduction of elasticity modulus 0.30 is induced at elements 4 and 12 of the structure as shown in Figure 1. In addition, impulsive load as shown in Figure 2 is applied to node 15. In order to determine the response of acceleration, velocity and displacement, two sensors are considered one at node 3 and the other at node 11.
In this study, responses of displacement, velocity, and acceleration of healthy and damaged structures are obtained and, then, compared with each other. The Standard Deviations (SD) of the above responses are obtained using Eq. (10) and are shown in Table 1.
Figure 2. Impulsive load applied to structures. Table 1. The standard deviation of responses obtained from two sensors.
Standard deviation Sensor Displacement
(mm)
Velocity (mm/s)
Acceleration (m/s2)
1 0.57 30 4.30
SD = v u u t 1 n n X i=1 (Ri
d Rih)2; (10)
where Rd and Rh are the responses of damaged and
healthy structures.
It is observed that the value of a standard de-viation of acceleration response is more than that of velocity and displacement response. Time-dependent acceleration of the structure contains very comprehen-sive and useful information that can be used to identify damages in structures. Any damage will lead to a change in dynamical responses such as acceleration of structures. Therefore, in this research, Eq. (5) implies the acceleration response obtained due to impulsive load, which is used to identify damages.
3. Optimization-based damage detection method
The purpose of this research is to identify any local damage in structures (beam, truss, and frame) by optimization algorithms. The optimization problem for identifying damages can be expressed as follows:
Find : XT = fx
1; x2; : : : :; xng
Minimize : W (X) Subject to : Xl X
i Xu; (11)
where XT = fx
1; x2; :::; xng is a damage variable
vector containing locations and extents of n unknown damages, and Xl and Xu are the lower and upper
bounds of the damage vector. In addition, w is an objective function that should be minimized.
The objective function can be considered as one of the most important parts of an optimization problem; moreover, that is a measure by which the convergence of the algorithm and stop times of algorithm are specied. In many researches, various correlation indices have been chosen as the objective function. In this study, according to multiple damage locations, assurance criteria introduced by Messina et al. [23] are used as the objective function given by:
W (X) = aTd:a (X)2
aT
d:ad a(X)T:a (X)
; (12)
where ad and a(X) are the acceleration vector of
damaged structure and an analytical model with re-spect to the acceleration vector of healthy structure, respectively.
The w varies from a minimum value {1 to a maximum value 0. It will be minimal when the vector of an analytical model becomes equal to the acceleration vector of the damaged structure, that is, a(x) = ad.
3.1. Teaching-Learning-Based Optimization (TLBO) algorithm
The selection of an ecient algorithm for solving the optimization-based damage detection problem is a critical issue, because the damage identication problem has many local solutions. Therefore, achieving the global optimum requires fewer structural analyses without trapping into the local optima which must be the main characteristic of the algorithm. In this study, the Teaching-Learning-Based Optimization (TLBO) algorithm is employed to properly solve the damage detection problem. The TLBO algorithm was presented by Rao et al. [24] to optimize mechanical design problems. The convenience and eectiveness of TLBO were supported by research works of other researchers published [25-27]. This method works on the eect of a teacher's inuence on learners. Similar to other nature-inspired algorithms, TLBO is also a population-based method and uses a population of solutions to proceed towards the global solution. The population is considered as a group of learners or a class of learners. The process of TLBO is divided into two parts. The rst part includes the `Teacher Phase', and the second part includes the `Learner Phase'. `Teacher Phase' means learning from the teacher and `Learner Phase' means learning through the interaction between learners. The systematic summary of the TLBO algorithm can be explained as follows:
a. The optimization problem is dened and the opti-mization parameters are initialized. The population size (Kn), number of design variables (Vn), vector
of design variables (X), and the lower and upper bounds of design variables (Xl, Xu) are initialized;
b. The population is initialized. A random population is generated according to the population size and number of design variables. For this method, the population size shows the number of learners, and the design variables show the subjects oered;
c. Teacher phase. The teacher can move up the average of a class to some extent depending on the capability of the class. The best solution in the entire population is selected as a teacher. Let Mi
be the mean result of learners and Tibe the teacher
at any iteration i. Ti increases (Mi) the knowledge
level of the whole class; thus, now, the new mean is Ti designated as Mnew. The dierence between
the result of the teacher and the mean result of the learners in each subject is expressed as follows:
Dierence Meani= ri(Mnew TFMi); (13)
where ri is the random number in the range [0, 1],
and TF is the teaching factor that decides the value
of mean to be changed. The value of TF can be
equal probability as follows:
TF = round [1 + rand (0; 1)f2 1g]: (14)
This dierence modies the existing solution ac-cording to the following expression:
Xnew;i= Xold;i+ Dierence Meani; (15)
where Xnew;i is the updated value of Xold;i.
d. Learner phase. Learners develop their knowledge by two dierent means: one through the input obtained from the teacher and the other through interaction among themselves. Learners can also gain knowledge by discussing and interacting with other learners. A learner learns something new if other learners have more knowledge than him or her. A learner's modication is expressed below.
Two learners are randomly selected: Xi and
Xj, such that i 6= j, where g (Xi) 6= g(Xj).
Xnew;i= Xold;i+ ri(Xi Xj);
If g (Xi) < g(Xj); (16a)
Xnew;i= Xold;i+ ri(Xj Xi);
If g (Xi) > g(Xj); (16b)
Xnew;i is acceptable if it gives a better function
value.
e. The convergence should be checked. In this step, solution convergence is controlled. If the solution is converged, the optimization will be stopped; otherwise, it returns to step c.
More details of TLBO can be found in the litera-tures [24,28,29]. In addition, the general process of TLBO algorithm is shown in Figure 3.
4. The executive steps of the proposed damage detection method
Damage detection steps by using time domain re-sponses and the optimization method TLBO can be as follows:
Step 1. An impulsive load as shown in Figure 2 is applied to structures;
Step 2. Analysis of a damaged structure is done using the Newmark method, and structure accel-eration is extracted at two arbitrary points. The accelerations are obtained according to Eq. (5); Step 3. According to Eq. (11), the objective func-tion is composed of a damaged structure accelerafunc-tion response and the analytical model acceleration; Step 4. The objective function obtained in the previous step is minimized using TLBO, and then location and extent of the damage are determined.
5. Test examples
In this section, the eciency and eectiveness of the proposed methods are evaluated through some numerically simulated damage identication tests; a 15-element cantilevered beam, a 24-element beam, a 56-element planar frame, and a 47-bar planar truss are considered with dierent damage scenarios for each of them. The location of sensors and applied load is obtained by engineering judgment and a trial and error method. In order to simulate the conditions of a real test, the measured parameters are perturbed numerically by 1% to 3% to consider the presence of the noise. The eect of measurement noise on the damaged structure acceleration is considered from:
RAcceleration D = Acceleration D
[1 + (2(random) 1) noise]; (17) where noise is the amount of measurement noise,
random is a positive random function and a fewer than one, Acceleration D is the damaged structure accel-eration vector, and RAccelaccel-eration D is the damaged structure acceleration vector by considering the eects of measurement noise.
5.1. Cantilevered beam
A cantilevered beam with 15 elements as shown in Figure 1 is considered as the rst example [22]. The length, thickness, and width of the beam are 2.74, 0.00635, and 0.0760 m, respectively. The mass density is 7860 kg/m3 and the elasticity modulus is 210 GPa.
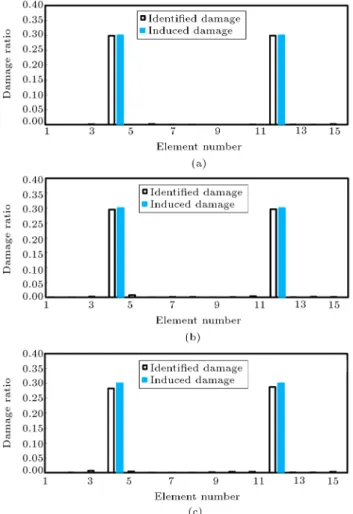
Damage in the structure is simulated here by a relative reduction of the element elasticity modulus. Therefore, the problem originally has 15 damage variables. Three dierent damage cases given in Table 2 are induced in the structure, and the proposed method is tested with considering noise. For considering the stochastic nature of the optimization-based damage detection, ten dierent optimization runs are made for each case, and the nal identied damage for Cases 1 to 3 is shown in Figures 4 to 6, respectively. The vertical solid bars indicate the true locations and extent of damages induced in the model, while the hollow bars show the identied damage variables for each element. The initial parameters of TLBO, including the popula-tion size (Kn) and number of design variables (Vn),
are set to 30 and 15, respectively. The maximum number of iterations for optimization is also set to 1000. By comparing the solutions of various cases, some interesting points can be concluded. The TLBO considering noise can properly achieve sites and extent of damage induced in all ten runs. It should be noted that the optimization process for Cases 1 to 3 converges to the actual damage after about 12 iterations (13000, 15000, and 16000 Finite-Element Analyses (FEA), respectively). The numerical results demonstrate the eciency of the method for locating the damaged elements.
5.2. Simply supported beam
This example shows the robustness of the proposed algorithm to detect the damage location and intensity of damaged sites. It includes a simple supported beam with a rectangular cross-sectional area. The nite-element model of a beam with 24 nite-elements leading to 72 degrees of freedom is considered as the second
exam-Figure 4. Final identied damage in the cantilevered beam for Damage Case 1 considering noise (a) 1%, (b) 2%, and (c) 3%.
ple [30]. The length, height, and width of the beam are 2.4, 0.24, and 0.14 m, respectively. The mass density is 2500 kg/m3 and the elasticity modulus is 25 GPa.
Figure 7 shows a sketch of the structural dimensions and the numbering of the discretized elements used in the nite-element analysis. Beam elements have three degrees of freedom per node (two translational and one rotational). Damage made to the structure is simulated as a relative reduction in the elasticity modulus of individual elements. As indicated by Table 3, three scenarios of damage in the beam are investigated. Damage is allowed to occur in dierent elements and
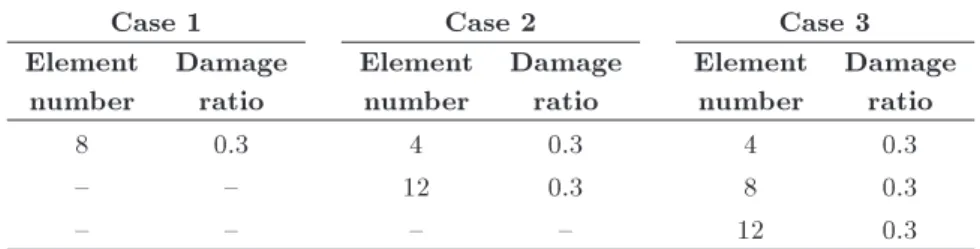
Table 2. Three dierent damage cases induced in the cantilevered beam.
Case 1 Case 2 Case 3
Element number
Damage ratio
Element number
Damage ratio
Element number
Damage ratio
8 0.3 4 0.3 4 0.3
{ { 12 0.3 8 0.3
Figure 5. Final identied damage in the cantilevered beam for Damage Case 2 considering noise (a) 1%, (b) 2%, and (c) 3%.
at one or more than one site. The parameters of the TLBO are selected as follows: The population size (Kn) is 20, the number of design variables (Vn)
is 24, and the maximum number of iterations for optimization is set to 1000. In addition, impulsive load as shown in Figure 2 is applied to node 12. In order to determine the acceleration response, two sensors are considered one at node 3 and the other at node 16.
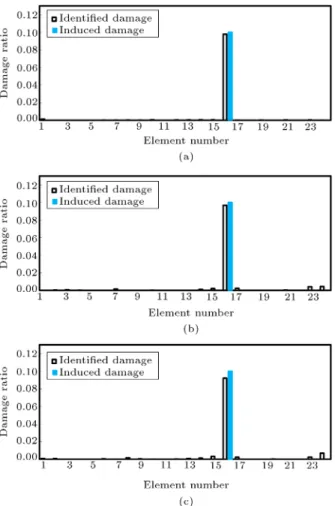
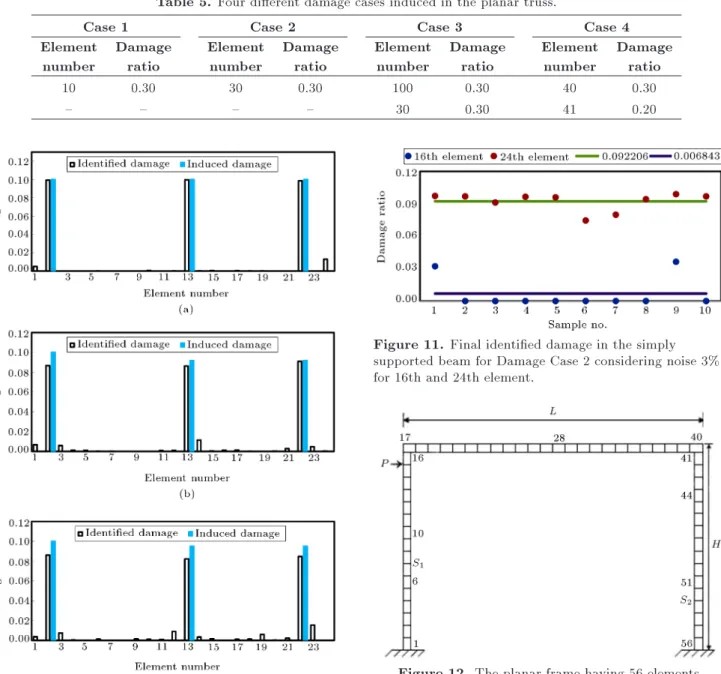
The damage identication results of dierent damage cases for 10 sample runs with considering noise are shown in Figures 8 to 10, respectively. Figure 11 shows the nal identied damage as an example for Damage Case 2 considering noise of 3% for 16th and
Figure 6. Final identied damage in the cantilevered beam for Damage Case 3 considering noise (a) 1%, (b) 2%, and (c) 3%.
Figure 7. The simply supported beam having 24 elements with rectangular cross section.
24th elements. The numerical results reported in gures demonstrate the high eciency of TLBO for determining the damaged site and damage extent. It is observed that the optimization process can obtain the actual site and extent of damage. For identication of
Table 3. Three dierent damage cases induced in the simply supported beam.
Case 1 Case 2 Case 3
Element number
Damage ratio
Element number
Damage ratio
Element number
Damage ratio
3 0.10 16 0.10 2 0.10
{ { { { 13 0.10
Figure 8. Final identied damage in the simply
supported beam for Damage Case 1 considering noise (a) 1%, (b) 2%, and (c) 3%.
Damage Cases 1, 2, and 3 by TLBO as shown in gures, 8500, 8800, and 8900 Finite-Element Analyses (FEA), respectively, are averagely required.
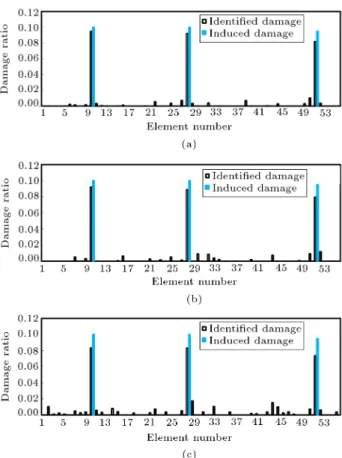
5.3. Planar frame
The third example considered in this work is a concrete portal frame to show the robustness of the proposed method [31]. The frame has a rectangular cross-sectional area with depth of h = 0:24 m, width of b = 0:14 m, lengths of L = 2:4 m , and height of H = 1:6 m. The material has an elasticity modulus of E = 25 GPa and material density of = 2500 kg/m3. Figure 12
shows a sketch of the structural dimensions and the numbering of the discretized elements used in the nite-element analysis. The 2D beam nite-element with three degrees of freedom per node (two translational and one rotational) is used for nite-element discretization of the structure. In order to investigate the methods, three damage cases created in Table 4 are simulated numerically here by reducing the elasticity modulus of some elements, and the method is tested. The nal setup parameters used in this work, including the population size (Kn) and number of design variables
Figure 9. Final identied damage in the simply
supported beam for Damage Case 2 considering noise (a) 1%, (b) 2%, and (c) 3%.
(Vn), are set to 30 and 56, respectively. The maximum
number of iterations for optimization is also set to 1000. In addition, an impulsive load as shown in Figure 2 is applied at node 16. In order to determine the acceleration response, two sensors are considered one at node 8 and the other at node 53.
The damage identication results of dierent damage cases for 10 sample runs with considering noise are indicated from Figures 13-15. It is observed that the optimization precisely detects the site and extent of the actual damage. It should be noted that the optimization process for Cases 1 to 3 converges to the actual damage after about 15 iterations (13200, 13000 and 13300 nite-element analyses, respectively). The nal results of dierent damage cases reveal the eciency of TLBO for determining the location and quantity of damage.
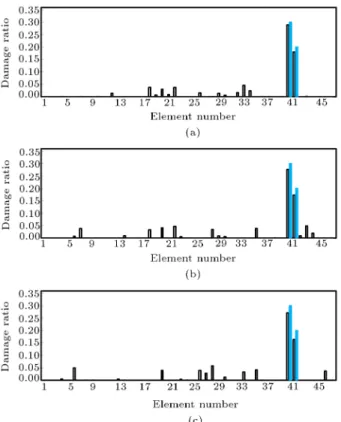
5.4. Forty-seven-bar planar truss
The 47-bar planar power line tower shown in Figure 16 is considered to show the robustness of the proposed method [5]. The structure has forty-seven members and twenty-two nodes. All members are made of steel, and the material density and modulus of elasticity are
Table 4. Three dierent damage cases induced in the planar frame.
Case 1 Case 2 Case 3
Element number
Damage ratio
Element number
Damage ratio
Element number
Damage ratio
7 0.10 44 0.10 10 0.10
{ { { { 28 0.10
{ { { { 52 0.10
Table 5. Four dierent damage cases induced in the planar truss.
Case 1 Case 2 Case 3 Case 4
Element number
Damage ratio
Element number
Damage ratio
Element number
Damage ratio
Element number
Damage ratio
10 0.30 30 0.30 100 0.30 40 0.30
{ { { { 30 0.30 41 0.20
Figure 10. Final identied damage in the simply supported beam for Damage Case 3 considering noise (a) 1%, (b) 2%, and (c) 3%.
0.3 lb/in3 and 30,000 ksi, respectively. A damage
variable in the structure is dened here via a relative reduction in the elasticity modulus of individual bars.
Figure 11. Final identied damage in the simply supported beam for Damage Case 2 considering noise 3% for 16th and 24th element.
Figure 12. The planar frame having 56 elements.
Therefore, the problem originally has 47 damage vari-ables. Four dierent damage cases given in Table 5 are induced in the structure, and the proposed method is tested with considering noise. The TLBO is now employed to solve the damage detection problem to determine the damage extent. The initial parameters of TLBO, including the population size (Kn) and
Figure 13. Final identied damage in the planar frame for Damage Case 1 considering noise (a) 1%, (b) 2%, and (c) 3%.
Figure 14. Final identied damage in the planar frame for Damage Case 2 considering noise (a) 1%, (b) 2%, and (c) 3%.
Figure 15. Final identied damage in the planar frame for Damage Case 3 considering noise (a) 1%, (b) 2%, and (c) 3%.
number of design variables (Vn), are set to 40 and
47, respectively. The maximum number of iterations for optimization is also set to 1000. In addition, the impulsive load as shown in Figure 2 is applied at node 17. In order to determine the acceleration response, two sensors are considered one at node 8 and the other at node 15.
The damage identication results for dierent damage cases obtained by TLBO are shown in Fig-ures 17-20. It is observed that the optimization process detects the site and extent of the actual damage precisely. It should be noted that the optimization process for Cases 1 to 4 converges to the actual damage after about 16 iterations (17480, 19640, 20040 and 19480 nite-element analyses, respectively). The nal results of dierent damage cases reveal the eciency of TLBO for determining the site and extent of the damage.
6. Conclusions
In this paper, an ecient optimization procedure was presented to accurately detect the site and extent of single or multiple structural damages. The structural damage detection problem was formulated rstly as a standard optimization problem aiming to minimize a
Figure 16. The 47-bar planar power line tower.
Figure 17. Final identied damage in the planar truss for Damage Case 1 considering noise (a) 1%, (b) 2%, and (c) 3%.
Figure 18. Final identied damage in the planar truss for Damage Case 2 considering noise (a) 1%, (b) 2%, and (c) 3%.
Figure 19. Final identied damage in the planar truss for Damage Case 3 considering noise (a) 1%, (b) 2%, and (c) 3%.
Figure 20. Final identied damage in the planar truss for Damage Case 4 considering noise (a) 1%, (b) 2%, and (c) 3%.
Multiple Damage Location Assurance Criterion (MD-LAC) for nding real damage variables. In this problem, the objective function was dened by using the acceleration of damaged structures and analytical model acceleration. The Newmark method was used for determining acceleration. The TLBO as a global optimization algorithm was utilized to properly solve the optimization problem. Four illustrative exam-ples considering the measurement noise were tested to assess the eciency of the proposed method for a structural damage detection. Numerical simula-tions demonstrated the eectiveness of the proposed optimization-based method for properly identifying the single and multiple damage cases.
References
1. Fallahian, S. and Seyedpoor, S.M. \A two stage method for structural damage identication using an adaptive neuro-fazzy inference system and particle swarm optimization", Asian Journal of Civil Engineer-ing (BuildEngineer-ing And HousEngineer-ing), 11(6), pp. 797-810 (2010).
2. Kourehli, S.S., Bagheri, A., Ghodrati Amiri, G., and Ghafory-Ashtiany, M. \Structural damage identica-tion method based on incomplete static response using an optimization problem", Scientia Iranica, 21(4), pp. 1209-1216 (2013).
3. Bagheri, A., Zare Hosseinzadeh, A., Rizzo, P., and Ghodrati Amiri, G. \Time domain damage localization
and quantication in seismically excited structures using a limited number of sensors", Journal of Vibra-tion and Control, 23(18), pp. 2942-2961 (2016). DOI: 10.1177/1077546315625141 jvc.sagepub.com
4. Joglekar, D.M. and Mitra, M. \Time domain analysis of nonlinear frequency mixing in a slender beam for localizing a breathing crack", Smart Materials and Structures, 26(2), 025009 (2016). DOI: 10.1088/1361-665X/26/2/025009
5. Seyedpoor, S.M. and Montazer, M. \A two-stage damage detection method for truss structures using a modal residual vector based indicator and dierential evolution algorithm", Smart Structures and Systems, 17(2), pp. 347-361 (2016).
6. Shayanfar, M.A., Kaveh, A., Eghlidos, O., and Mirzaei, B. \Damage detection of bridge structures in time domain via enhanced colliding bodies optimiza-tion", Int. J. Optim. Civil Eng., 6(2), pp. 211-226 (2016).
7. Pandey, A.K., Biswas, M., and Samman, M.M. \Dam-age detection from changes in curvature mode shapes", J. Sound. Vib., 145(2), pp. 321-332 (1991).
8. Sohn, H., Farrar, C., Hunter, N., and Worden, K., A Review of Structural Health Monitoring Literature: 1996-2001. Los Alamos National Laboratory report, (LA-13976-MS) (2004).
9. Carden, E.P. and Fanning, P. \Vibration based condi-tion monitoring: A review", Structural Health Moni-toring, 3(4), pp. 355-377 (2004).
10. Maity, D. and Tripathy, R.R. \Damage assessment of structures from changes in natural frequencies using genetic algorithm", Structural Engineering and Me-chanics, 19(1), pp. 21-42 (2005).
11. Pawar, P.M. and Ganguli, R. \Matrix crack detection in thin-walled composite beam using genetic fuzzy system", Journal of Intelligent Material Systems and Structures, 16(5), pp. 395-409 (2005).
12. Pawar, P.M., Reddy, K.V., and Ganguli, R. \Damage detection in beams using spatial Fourier analysis and neural networks", Journal of Intelligent Material Sys-tems and Structures, 18(4), pp. 347-359 (2007).
13. Elshafey, A.A., Marzouk, H., and Haddara, M.R. \Experimental damage identication using modied mode shape dierence", Journal of Marine Science and Application, 10(2), pp. 150-155 (2011).
14. Lu, X.B., Liu, J.K., and Lu, Z.R. \A two-step approach for crack identication in beam", Journal of Sound and Vibration, 332(2), pp. 282-293 (2013).
15. Dawari, V.B. and Vesmawala, G.R. \Modal curvature and modal exibility methods for honeycomb damage identication in reinforced concrete beams", Journal of Procedia Engineering, 51, pp. 119-124 (2013).
16. Choi, S., Park, S., Yoon, S., and Stubbs, N. \Nonde-structive damage identication using changes in modal compliance", NDT and E International, 38(7), pp. 529-540 (2005).
17. Seyedpoor, S.M. \A two method for structural damage detection using a modal strain energy index and particle swarm optimization", International Journal of Non-Linear Mechanics, 47(1), pp. 1-8 (2012).
18. Bandara, R.P., Chan, T.H., and Thambiratnam, D.P. \Structural damage detection method using frequency response functions", Journal of Structural Health Mon-itoring, 13(4), pp. 418-429 (2014).
19. Zimin, V.D. and Zimmerman, D.C. \Structural dam-age detection using time domain periodogram analy-sis", Journal of Structural Health Monitoring, 8(2), pp. 125-135 (2009).
20. Fu, Y.Z., Lu, Z.R., and Liu, J.K. \Damage identi-cation in plates using nite element model updating in time domain", Journal of Sound and Vibration, 332(26), pp. 7018-7032 (2013).
21. Chopra, A. \Dynamics of structures", Theory and Applications to Earthquake Engineering, Prentice-Hall, 4th Edn., New Jersey (2012).
22. Nouri Shirazi, M.R., Mollamahmoudi, H., and Seyed-poor, S.M. \Structural damage identication using an adaptive multi-stage optimization method based on a modied particle swarm algorithm", Journal of Optimization Theory and Applications, 160(3), pp. 1009-1019 (2014).
23. Messina, A., Williams, E.J., and Contursi, T. \Struc-tural damage detection by a sensitivity and statical-based Method", Journal of Sound and Vibration, 216(5), pp. 791-808 (1998).
24. Rao, R.V., Savsani, V.J., and Vakharia, D.P. \Teaching-learning-based optimization: A novel method for constrained mechanical design optimiza-tion problems", Computer-Aided Design, 43(3), pp. 303-315 (2011).
25. Dokeroglu, T. \Hybrid teaching-learning-based opti-mization algorithm for the quadratic assignment prob-lem", Computers & Industrial Engineering, 85(C), pp. 86-101 (2015).
26. Huang, J., Gao, L., and Li, X. \A teaching-learning-based cuckoo search for constrained engineering design problems", Advances in Global Optimization, 95, pp. 375-386 (2015).
27. Ouyang, H-B., Gao, L-Q., Kong, X-Y., Zou, D-X., and Li, S. \Teaching-learning based optimization with global crossover for global optimization problems", Applied Mathematics and Computation, 265, pp. 533-556 (2015).
28. Rao, R.V. and Kalyankar, V.D. \Multi-pass turn-ing process parameter optimization usturn-ing teachturn-ing- teaching-learning-based optimization algorithm", Scientia Iran-ica, 20(3), pp. 967-974 (2013).
29. Rao, R.V. and Patel, V. \An improved teaching-learning-based optimization algorithm for solving un-constrained optimization problems", Scientia Iranica, 20(3), pp. 710-720 (2013).
30. Seyedpoor, S.M., Shahbandeh, S., and Yazdanpanah O. \An ecient method for structural damage de-tection using a dierential evolution algorithm-based optimisation approach", Civil Engineering and Envi-ronmental Systems, 32(3), pp. 230-250 (2015).
31. Nobahari, M. and Seyedpoor, S.M. \An ecient method for structural damage localization based on the concepts of exibility matrix and strain energy of a structure", Structural Engineering and Mechanics, 46(2), pp. 231-244 (2013).
Biographies
Saeed Fallahian is currently a PhD candidate of the Structural and Earthquake Engineering at Sharif University of Technology, Tehran, Iran. He received his BSc and MSc degrees in 2001 and 2003, respectively, from University of Mazandaran, Babolsar, Iran. His main areas of research is structural damage detection, concrete structures, and dynamic of structures. Abdolreza Joghataie received his PhD degree from the University of Illinois at Urbana-Champaign, Illi-nois, US, in 1994 and is now a Faculty Member of the Structural and Earthquake Engineering Groups in Civil Engineering Department of Sharif University of Technology, Tehran, Iran. His research is within the elds of structural optimization, intelligent computa-tion, structural control, and concrete structures. Mohammad Taghi Kazemi is an Associate Profes-sor at the Department of Civil Engineering at Sharif University of Technology in Tehran, Iran. He received his PhD from Northwestern University, Evanston, Illi-nois, USA. His research interests include the seismic rehabilitation of existing structures and fracture me-chanics.
![Figure 3. General process of TLBO algorithm suggested by Rao et al. [24].](https://thumb-us.123doks.com/thumbv2/123dok_us/8371809.2223493/5.892.189.688.913.1125/figure-general-process-tlbo-algorithm-suggested-rao-et.webp)