Chronic Pain History and its Relationship to Executive Function and Pain Perception Dillon Taylor
UNC-Chapel Hill
A thesis presented to the faculty of The University of North Carolina at Chapel Hill in partial fulfillment of the requirements for the Bachelor of Science degree with Honors in Psychology.
Advisor________________________
Dr. Mark Hollins
Reader________________________
Dr. Beth Kurtz-Costes
Reader________________________
Acknowledgements
I would first of all like to thank my faculty advisor Dr. Mark Hollins for his steadfast support throughout my years in the lab. He is not only dedication to producing invaluable research but also to imparting his knowledge to lab members every step of the way. Both in this project and previous, he has pushed me to think critically and work diligently, helping me to develop into a better researcher.
Next, I’d like to thank my other committee members, Dr. Kristen Lindquist and Dr. Beth Kurtz-Costes, for taking the time out of their busy schedules to provide feedback on my project and offer additional viewpoints by which to understand and interpret my results. Dr. Peter Ornstein, the honors class professor, has also been instrumental in guiding me through the process of how to write a thesis that is clear, concise, and meaningful. Sam Brotkin, a fellow researcher in the lab, has also been (and continues to be) a tremendous help in running participants and providing insightful advice.
Abstract
Chronic pain is a burdensome and potentially debilitating condition that affects
approximately one-third of the United States population. A large body of research has indicated that individuals with chronic pain typically exhibit a number of deficits. Executive functioning levels are diminished, touch perception is amplified, and pain is perceived as more intense and unpleasant as compared to matched controls. While this literature is invaluable in characterizing the profile of chronic pain, little research has examined individuals with a history of chronic pain. The current study aims to fill this gap in the literature by examining executive functioning, touch perception, and conditioned pain modulation in individuals with a history of chronic pain. It was found that individuals with a history of chronic pain had better performance on an
attentional control task (Stroop test) than control participants but no difference in a working memory task (Ospan). Those with a history of chronic pain exhibited a lower threshold for tactile (pressure) unpleasantness than control subjects, under baseline conditions, but not while
Cognitive aspects of pain perception
Pain perception has long been understood as a complicated and subjective experience with differences between individuals being substantial. While this has been observed and understood for a good deal of time, the exact extent to which cognitive factors can play into this has been largely unexplored until fairly recently. Therefore, it remains a subject worthy of further exploration.
Prior to understanding the relationship between cognition and pain, researchers discovered a broader relationship between that of cognitions and perceptions of one’s body (Chapman, 1978). How we perceive ourselves can act as a level of feedback which can in turn alter our bodily states and cognitions. While people often feel as if they just simply “know” how they feel, whether that be tired, joyful, or in pain, this understanding actually arises from a number of independent factors of which we may not be explicitly aware. For instance, someone who hears them self breathe heavily while exercising can make them feel more fatigued they would otherwise. This is due to the fact that attention, whether implicit or explicit, to such physiological feedback can alter bodily states. Conversely, if attention is drawn away from such feedback, individuals find themselves less fatigued. However, the feedback that one receives does not even have to be genuine for this effect to hold true. Continuing with the exercise example, listening to someone else’s heavy breathing can produce a similar effect of increased fatigue (Chapman, 1978). Again, it is the attentional factor that drives the difference.
(Arntz, Dreessen, & Merckelback, 1991). Those who are more introspective to their bodily states generally have lower pain threshold and tolerances (Pollatos, Füstös, & Critchley, 2012). The “rubber hand illusion” is a classic example that depicts how intensely attention can alter pain (Botvinick & Cohen, 1998). In this illusion, individuals look at a rubber arm that is made to appear as if it is potentially attached to their body. While looking at this rubber arm, their real arm and their “new” arm are touched simultaneously in the same places to create the illusion that sensations are being experienced through this rubber arm. At this point, if the rubber arm is harmed, say hit by a hammer, the person will often rapidly pull back their real hand and possibly even let out a brief shout; people report experiencing a painful sensation when this happens. As this illustrates, pain can be produced in lieu of any direct physical stimulation when attention and the expectation of sensation have been properly created.
Conditioned Pain Modulation
Conditioned pain modulation (CPM) is a research paradigm that is used in order to study and better understand diffuse noxious inhibitory control (DNIC) which is the tendency for pain to inhibit pain (Moont, 2010). Better understanding DNIC is of high interest as it is an
that pain is not the only factor in the phenomenon as additional innocuous distractors can increase DNIC beyond that of just noxious distractors (Moont, Pud, Sprecher, Sharvit, & Yarnitsky, 2010).
While DNIC is observed in the general population, variation in levels of DNIC is associated with various conditions. Fibromyalgia and temporomandibular disorder are both chronic pain disorders that are associated with lower levels of DNIC as compared to age matched controls (Edwards et al., 2003; Kosek and Hansson, 1997). DNIC also decreases with age and can ultimately result in negative DNIC, an occurrence in which an additional noxious stimulus will increase the pain of a test stimulus. Furthermore, it has been shown that levels of DNIC are not associated with individuals’ pain thresholds or tolerances or psychological factors such as stress, self-efficacy, or knowledge of DNIC (Edwards et al., 2003). Pre-surgery levels of DNIC have been found to be associated with one’s likelihood to develop chronic neuropathic pain after the surgery (Granovsky, 2013). While the factors that drive DNIC remain partially unknown, it is clear that it has a strong negative relationship with chronic pain.
Chronic pain and Hypervigilance
Hypervigilance is an intensified perceptual style that is present in a number of different diseases/disorders and is one of the leading characteristics of fibromyalgia, a chronic pain disorder (McDermid, Rollman, & McCain, 1996). Hypervigilance has also been observed in people who otherwise have normal health as it is not a disorder in and of itself. Over the past few decades, much research has been done to better understand the extent of this hypervigilance. At first, it was believed that those who are hypervigilant show an intensified perception of only noxious somatosensory stimulation (Rollman & Lautenbacher, 1993). Subsequent studies have shown that this perceptual amplification is present for innocuous stimulation as well. For Example, it has been demonstrated that this perceptual amplification is present not only for somatosensory stimulation, but for auditory stimulation as well (Hollins et al., 2009). In
summation, it seems that those who show a hypervigilant style are more sensitive to both painful and non-painful stimuli of multiple modalities. While many researchers have speculated on the etiology of this perceptual style, little is actually known. As related to what was previously mentioned, it seems attention and bodily awareness plays a huge factor in the presentation of these symptoms.
Pain’s effects on cognitive functioning
severity. Another potentially less noticeable symptom is change in cognitive functioning. Those with current chronic pain often show lowered performance on tasks that measure attentional control, working memory, and general executive functioning as a whole (Abeare et al., 2010). Lastly, it is common for those with chronic pain to sleep on average a few hours less than what is recommended. It is known that failing to get enough sleep is either associated with or can
potentially cause most of the aforementioned other symptoms (Kahn-Greene, D. Killgore, Kamimori, Balkin, & W. Killgore, 2007).
In addition to the differences that are seen among chronic pain populations, there have also been some similar changes found in individuals who have experienced acute pain early in life. Acute pain during early stages of development has been shown to be associated with
cognitive and motor deficits later in life (Grunau et al., 2009; Wollgarten et al., 2009, 2011). This similarity between acute and chronic pain is important to note as it shows that such associations are not specific only to chronic pain.
Measures and implications of executive functioning
2005). The operation span task similarly requires attentional control in addition to an intensive amount of working memory. It requires the answering of math problems while memorizing a sequence of letters that must be sequentially recalled (Le Bars, Dickenson, & Besson, 1979).
Current Study
While there is a vast amount of research regarding chronic pain, executive functioning, and pain perception, studies largely focus on populations who are currently experiencing chronic pain. This is invaluable for better understanding clinical populations but restricts what can be learned about these variables on a generalizable basis. The current study aims to fill this gap in the literature by exploring the relationships between these variables in individuals who
specifically have a history of chronic pain. Doing so may reveal which symptoms are specific to current chronic pain and which can result from periods of chronic pain earlier in life.
Method Participants
Twenty six individuals, eleven with a history of chronic pain and fifteen without,
participated in the study. Chronic pain history was self-reported in the pain history questionnaire. All recruiting was done through UNC’s SONA system, a recruiting website that consists of psychology 101 students who participate in studies as a component of their class. Potential participants were excluded from the study if they did not meet the age requirement (18-25), were in a class taught by Dr. Hollins, had been diagnosed with diabetes, urticaria, Raynaud’s disease, or a peripheral vascular disease, had neurological impairment, had surgery or nerve damage to either hand or forearm, had a current injury to either hand or forearm, or were colorblind or had abnormal color vision. While it is possible some potential participants did not sign up for the study due to these exclusion criteria, no participants who signed up for the experiment were excluded by these criteria.
Apparatuses
order to alter the pressure delivered by the device. The center divider in addition to two lateral dividers hid the frame and the weights from the participants’ view.
The apparatus for the conditioned pain modulation portion of the task consisted of a small ten liter cooler, a plastic divider with holes to ensure that ice did not come into direct contact with the participants’ hands, and a small electronic bubbler (Tetra) that pumped air through a plastic tubing with rested in the cooler to help the water circulate. For the cold condition, a combination of refrigerated water, room temperature water, and ice was used in order to achieve and maintain a target water temperature of 6o centigrade as measure by a K/J thermometer (421502; Extech Instruments Corp., Nashua, NH, USA) with a K bead thermocouple (TP870; Extech Instruments Corp.). Temperatures within the range of 5.5o – 6.5o centigrade were deemed acceptable. Room-temperature tap water was used for the control condition which had a target temperature of 32o centigrade. Temperatures within the range of 31o – 33o centigrade were deemed acceptable.
Measures
The Pain History Questionnaire (PHQ) was used to determine if participants had previously experienced any chronic pain, and was used to determine if participants were in the history of chronic pain group or no history of chronic pain group. The questionnaire also asked for age(s) of onset of chronic pain, doctor diagnosis (if applicable), age and description of their earliest pain memory, typical locations of pain by body region, if pain had significantly
The Current Pain Questionnaire (CPQ) is a set of questions regarding the location and intensity of any current pain that participants may be having. It distinguishes between acute and chronic pain and also asks if the participant is taking any medication for pain. This was used also used to determine if participants had any current pain that warranted their exclusion from the study. The CPQ was produced by our lab.
The Pennebaker Inventory of Limbic Languidness (PILL) (Pennebaker, 1982) was used to determine if participants were hypervigilant. It lists a number of commonly experienced symptoms (runny nose, cough, headaches…) and asks participants to report how often they experience each symptom. It was developed to test for cognitively driven perceptions of
symptoms. Here, it is used as a measurement of hypervigilance, an intensified perceptual style in which individuals have greater frequencies of recalled symptoms as shown by the PILL, and have lowered pain and unpleasantness thresholds and tolerances (Hollins, 2009).
The first cognitive task used was the operation span (ospan) task and was completed on a computer. This computer automated version of the ospan was developed by Unsworth et al. (2005) and runs on Inquisit, an application which is used to develop and run stimuli for research. The program itself is available for free download on Millisecond’s website
recalled the letters that they were presented with in order by clicking each letter. Corrections could be made by erasing an entry and making a new one. If participants could not recall a letter they had the option of entering a “blank” at that position. Each participant completed 30 trials.
The second cognitive task, the Stroop task, was also computerized. This task required participants to state aloud the color of given text. There were two different blocks to this task, a control block and a test block. In the control block, participants stated aloud the color of a series of the capitalized letter “X”. In the test block, participants stated aloud the color of text that spelled out various colors. For example, if the word “red” appeared printed in green, the participant should respond by saying “green”. Similarly, if “XXXXXX” appeared printed in yellow, the participant should respond by saying “yellow”. There were 45 trials per block for a total of 90 trials. Times were recorded for each block, and the net difference between the two blocks was their Stroop interference level. These stimuli and methods were the same as used by Harper and Hollins (2012).
The pain perception task used the two apparatuses described above. Participants submerged their left hand in the water while pressures were applied to their right forearm.
Participants rated the intensity of sensation and unpleasantness of sensation of each weight. They also categorized each weight as painful, unpleasant but not painful, or neutral.
Procedure
instructions on screen and to ask if anything was unclear. The instructions walked the
participants through how the task would work and provided practice questions to acclimate them to the task. Once the participants completed the practice questions and fully understood how to complete the task, they continued to the test phase of the task. Each step had a time limit which was based on the average time it took each individual participant to complete the practice questions with the exception of the letter recall step, which was untimed. Additionally, participants had to maintain a minimum of 85% accuracy on the math portion of the task. Participants were explicitly told of both of these conditions.
The Stroop task was administered next at the same computer. Participants first received instruction on how to complete the task and were given a few practice trials. After they
completed the practice trials they moved onto the test trials. All participants completed the control condition first (only “XXXXXX”’s) and the Stroop condition (color words) second. If participants incorrectly identified a color, they could correct themselves and continue. Total incorrect color identifications, uncorrected incorrect color identifications, and total time were recorded.
The final task, the pressure and thermal stimulation task, was then completed. The
participant rested his/her right forearm, volar side down, on a small pillow through the apparatus. Immediately before any pressures were applied to the right forearm, the participant placed
raised off the forearm for approximately one second, resulting in approximately thirteen seconds of uninterrupted rod to forearm contact. After the weighted rod was raised off of the forearm, the participant rated the intensity of the sensation it produced on a scale from 0-100, where 0 meant “no sensation” and 100 meant “the most intense sensation imaginable.” Next, the participant classified the sensation as neutral, unpleasant but not painful, or painful. Finally, the participant rated the unpleasantness of the sensation on a 0-100 scale, where 0 meant “not at all unpleasant” and 100 meant “the most unpleasant sensation imaginable.” This was repeated for a total of six trials per participant with weights ranging from 77 grams to 1077 grams in steps of 200 grams. The orders of the weights were randomized for each participant. For the first six trials, the participant’s left hand was in neutral warm water, and for the second six trials, their hand was in the painfully cold water. Water temperature was measured and recorded both before and after each set of six trials to ensure that it consistently stayed in the acceptable temperature range. If at any point in time, the pain on either arm became intolerable, participants had the option to
Results
The study was completed by twenty-eight participants. The first two participants in the study were pilot participants and their data were not used in the analyses. The remaining twenty-six individual’s data were used for the analyses. Three of these twenty-twenty-six had their participation in the study ended early; two chose to end their participation in response to the painfully cold thermal stimulus, and one participant was unable to complete the study due to lack of enough cold water for the cold thermal stimulus. Partial data from these three participants is used where applicable. Eleven participants reported a history of chronic pain and fifteen reported no history of chronic pain. The chronic pain history group had a mean age of 19.00 (SD = 1.18) and the no chronic pain history group had a mean age of 18.93 (SD = .96); this difference was not
significant. In all statistical tests, a significance criterion of p = .05 is used.
Questionnaires
Of the eleven participants with a history of chronic pain, three had received a doctor’s diagnosis of a chronic pain condition. Besides the questions pertaining to history of chronic pain the PHQ revealed no differences between groups. Participants’ mean age of their earliest pain memory was 7.4 (SD = 4.4) and they had an average of 2.1 (SD = 1.3) typical pain locations. Eight participants reported that pain had significantly interfered with their daily life at some point in time and eight reported having regularly taken some sort of pain medication at some point in their lives.
(SD = 16.65) for the CPH group and 11.73 (SD =17.43) for the NCPH group. Mean recent pain unpleasantness was 20.73 (SD = 18.13) for the CPH group and 12.67 (SD = 21.23) for the NCPH group. Mean recent time in pain by percent of waking hours was 11.18 (SD = 10.15) for the CPH group and 10.07 (SD = 17.37) for the NCPH group. On a zero to one hundred scale mean current pain intensity was 2.91 (SD = 4.68) for the CPH group and 4.67 (SD = 9.89) for the NCPH group. Mean current pain unpleasantness was 2.64 (SD = 3.89) for the CPH group and 5.87 (SD = 11.01) for the NCPH group. Four participants reported current chronic pain and two reported that they were currently taking medication for their current pain.
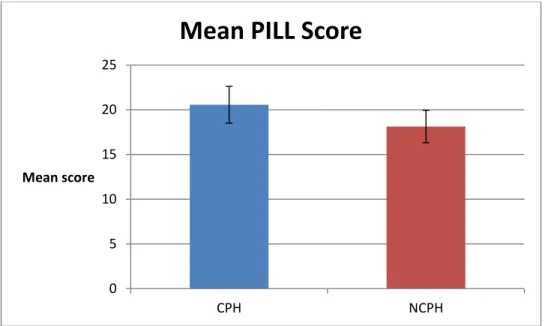
The mean score for the PILL was 19.15 (SD = 8.98). The mean score was 20.55 (SD = 9.62) for the chronic pain history group and 18.13 (SD = 8.68) for the no chronic pain history group. An independent samples t-test between groups showed no significant difference in their scores (figure 1).
Figure 1. Bar chart showing the mean PILL scores by group. Error bars give ±SEM.
Cognitive tasks
0 5 10 15 20 25
CPH NCPH
Mean score
All participants were able to maintain a score of 85% on the math portion of the ospan task, so no data were excluded. Two different scoring methods were used in this test. In the original method, a participant’s score is the sum of all letters in recalled sequences that were entirely correct. For example, if five out of five letters were recalled correctly, five points were added to the participants score. However, if six out of seven letters were correctly recalled for one set, zero points were added. Through this method of scoring, the mean scores were 44.91 (SEM = 4.30) for the chronic pain history group and 42.53 (SEM = 3.61) for the no chronic pain history group. A t-test revealed that there was no significant difference between these values. As this method of scoring results in some lost information, we also scored the test an alternative way in which each correct letter response simply corresponds to one point towards a participant’s score (Unsworth et al., 2005). By this method, the mean scores were 60.45 (SEM = 2.42) for the chronic pain history group and 60.33 (SEM = 1.73) for the no chronic pain history group. There was still, however, no significant difference between means.
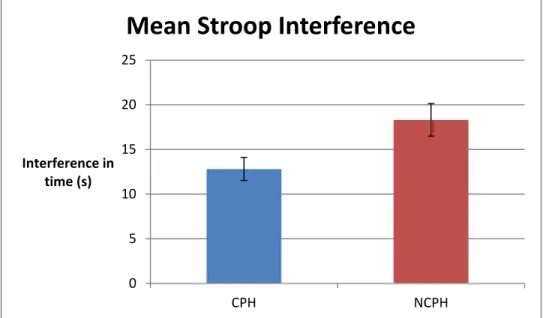
Figure 2. Bar chart showing mean Stroop interference scores by group. Error bars give ±SEM.
Touch and Pain Perception Task
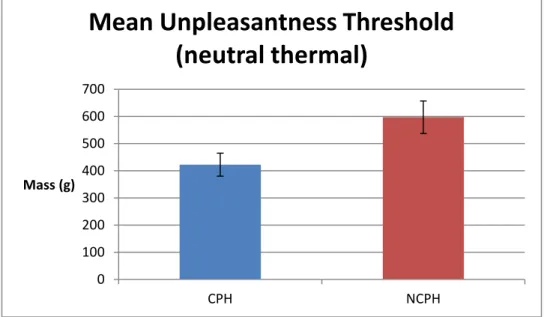
Unpleasantness thresholds for both thermal conditions were calculated. Pain thresholds could not be calculated for either thermal condition as there was not a sufficient number of participants who reported any pressures as painful. Only nine participants reported any weight as painful in the control thermal condition, and only two reported any pressure as painful in the painful thermal condition. A participant’s unpleasantness threshold was considered to be the least amount of pressure that they reported as unpleasant but not painful. In the neutral thermal stimulus condition, the CPH group had a mean unpleasantness threshold of 422g (SEM = 39g) and the NCPH group had a mean unpleasantness threshold of 597g (SEM = 73g). A t-test showed that this difference was significant, t(20.83) = -2.12, p < .05 (figure 3). In the painfully cold thermal stimulus condition, the CPH group had a mean unpleasantness threshold of 452g (SEM = 77g) and the NCPH group had a mean unpleasantness threshold of 465g (SEM = 110g). A t-test showed that these differences were not significant (figure 4).
0 5 10 15 20 25
CPH NCPH
Interference in time (s)
Figure 3. Bar chart showing mean unpleasantness threshold by group for the neutral thermal condition. Error bars give ±SEM.
Figure 4. Bar chart showing mean unpleasantness threshold by group for the painful thermal condition. Error bars give ±SEM.
0 100 200 300 400 500 600 700
CPH NCPH
Mass (g)
Mean Unpleasantness Threshold
(neutral thermal)
0 100 200 300 400 500 600
CPH NCPH
Mass (g)
For analyses using ratings on 0-100 scales, data were transformed into logarithmic form as is standard for ratio scaling experiments (Gescheider, 1997). Ratings of zero were replaced with a small nonzero number in order to allow the logarithmic transformation to successfully occur for all values. Zeros were replaced with .5, half of the smallest nonzero value (one) reported by any participant (Hollins, 2009). Four 2(chronic pain history) by 6(force) mixed model ANOVAs were performed for unpleasantness and intensity ratings for both the neutral and painfully cold thermal conditions. There was no main effect of group for either
unpleasantness or intensity ratings in the neutral thermal condition A main effect of group was found for both unpleasantness, F(1, 21) = 14.85, p < .01, and intensity, F(1, 21) = 15.28, p < .01, for the painfully cold thermal condition. A main effect of pressure was found for all four
ANOVAs. There were no significant group interactions found in any of the four ANOVAs. Figures 5-8 below plot these four analyses.
Figure 5. Line graph showing data from 2(group) by 6(mass) mixed ANOVA for unpleasantness ratings during the neutral thermal stimulus.
-0.4 -0.2 0 0.2 0.4 0.6 0.8 1 1.2 1.4 1.6
77 277 477 677 877 1077 Log
unpleasantness ratings
Mass (g)
Unpleasantness (neutral thermal)
CPH
Figure 6. Line graph showing data from 2(group) by 6(mass) mixed ANOVA for intensity ratings during the neutral thermal stimulus.
Figure 7. Line graph showing data from 2(group) by 6(mass) mixed ANOVA for unpleasantness ratings during the painful thermal stimulus.
0 0.2 0.4 0.6 0.8 1 1.2 1.4 1.6
77 277 477 677 877 1077 Log intensity
ratings
Mass (g)
Intensity (neutral thermal)
CPH NCPH -0.4 -0.2 0 0.2 0.4 0.6 0.8 1 1.2 1.4
77 277 477 677 877 1077 Log
unpleasantness ratings
Mass (g)
Unpleasantness (painful thermal)
CPH
Figure 8. Line graph showing data from 2(group) by 6(mass) mixed ANOVA for intensity ratings during the painful thermal stimulus.
Conditioned sensation intensity modulation (CSIM) and conditioned sensation
unpleasantness modulation (CSUM) scores for each pressure were calculated for each participant by subtracting painfully cold thermal stimuli scores from neutral thermal stimuli scores. These two scores are used as a substitute for CPM as not enough pressures were found painful to
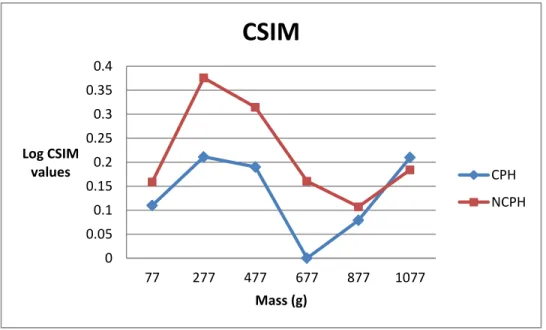
calculate CPM. Two 2(chronic pain history) by 6(force) mixed model ANOVAs were performed, one for CSIM and one for CSUM. For the CSIM ratings, there was a significant main effect for force, F(1, 24) = 5.62, p < .05, but not a main effect of group, F(1, 24) = 3.03, p = .09. The interaction between the two was not significant, F(1, 24) = 1.59, p = .167. For CSUM there was also a main effect for force, F(1, 24) = 7.57, p > .05, but not for group, F(1, 24) = 2.81, p = .11. Again, the interaction between the two was not significant, F(1, 24) = 2.04, p = .077. These data are shown below in figures 9 and 10 respectively.
-0.4 -0.2 0 0.2 0.4 0.6 0.8 1 1.2 1.4
77 277 477 677 877 1077 Log intensity
ratings
Mass (g)
Intensity (painful thermal)
CPH
Figure 9. Line graph showing data from 2(group) by 6(mass) mixed ANOVA for CSUM scores.
Figure 10. Line graph showing data from 2(group) by 6(mass) mixed ANOVA for CSIM scores
-0.05 0 0.05 0.1 0.15 0.2 0.25 0.3 0.35 0.4 0.45
77 277 477 677 877 1077 Log CSUM values Mass (g)
CSUM
CPH NCPH 0 0.05 0.1 0.15 0.2 0.25 0.3 0.35 0.4Discussion Questionnaires
The main finding from the questionnaire data was that individuals with a history of chronic pain and individuals without a history of chronic pain have comparable levels of hypervigilance, as determined by the PILL. This lack of difference is interesting since higher levels of hypervigilance are commonly associated with individuals who currently have chronic pain. Of the four participants that exhibited current chronic pain, they did not have significantly different levels of hypervigilance as compared to those without current chronic pain. This result is not unexpected however given a group size of only four. While we were unable to collect data on hypervigilance at the time of chronic pain for the rest of the participants, past research suggest that they likely were hypervigilant during this time. If this were the case, then these results support the potential for levels of hypervigilance to decrease to normal once chronic pain is absent. Alternatively, since levels of hypervigilance in adolescent chronic pain patients have not been specifically measured, it is possible that they were not hypervigilant at the time of chronic pain. If so, this would suggest that hypervigilance does not have to precede or co-occur with chronic pain. For this matter, longitudinal studies provide the best possibility of further understanding the direction of this relationship.
unpleasantness of sensation in response to a stimulus, whereas the questionnaire asked for ratings of spontaneous pain, not sensation ratings. While it is known that these two are closely related they are not synonyms with each other. Therefore, a lower unpleasantness threshold may not actually translate to increased current pain on average. Another potential explanation is that the level of attention required in the pressure experiment is different from the level of attention given to current levels of pain. It is possible that levels in current pain between these groups may vary given an attentional manipulation.
Cognitive Tasks
Both groups performed comparably on the automated operation span task. While
executive functioning is generally impaired in individuals who have chronic pain (Abeare et al., 2010), here it was found that a history of chronic pain was not associated with the difference. Similar to levels of hypervigilance, this may indicate that executive functioning impairments that exist during chronic pain can be reversed one the chronic pain has ended. Alternatively, it is possible that adolescents who develop chronic pain do not experience the same deficits that adults do. This may be because chronic pain alone is not adequate to produce such deficits in a young population.
based inhibitory control task (Abeare et al., 2010; Grisart & Plaghki, 1999). One main difference observed between these two findings is current vs past chronic pain, a discrepancy that may be responsible for the variation in results. Experiencing current chronic pain may worsen an individual’s performance on this task as the pain itself may be distracting. This alone however does not explain why the chronic pain history group outperformed the control group. We believe that this finding may be caused by better attentional control as learned through coping with past chronic pain. The ability to distract oneself from pain can be immensely helpful in reducing pain and increasing quality of life. If individuals learned such attentional strategies explicitly or implicitly during their chronic pain, it is possible that this skill could transfer over to other attentional tasks, such as the Stroop test. This could also help explain why current chronic pain sufferers perform worse at such tasks. If they have to allot cognitive attentional resources for pain inhibition, they will have fewer resources to complete such a task.
Touch and Pain Perception Tasks Conditioned Pain Modulation
Average levels of CPM were not significantly different but were approaching
CPM was not significant across groups, it seems that this may be due to insufficient power. Given the relatively small sample size and trend towards significance, it seems likely that a larger sample size would have yielded significant results. Regardless, the significant result at the force of 6.8N still provides valuable information. At least for this pressure, the two groups have a fundamentally different system of pain perception. Whether attentional or physiological,
combined noxious stimuli intensify rather than diminish pain. This difference may be vital in understanding how and why individuals develop chronic pain conditions.
Unpleasantness Threshold
The chronic pain history group showed a lower unpleasantness threshold for the neutral thermal condition but no difference in unpleasantness threshold was found for the painfully cold thermal condition. This suggests that CPM neutralized the difference in threshold between groups. Based off of the mean thresholds for both conditions between groups, it appears that the no chronic pain group experienced a decrease in threshold as caused by the CPM while the chronic pain history group’s threshold remained essentially the same. The other possible driving force would have been an increase in threshold for the chronic pain history group, but this is not the case. Rather, the baseline unpleasantness scores for the chronic pain history group look the same as the no chronic pain history group’s DNIC ratings. It essentially appears like the chronic pain history group is always under the effect of an additional noxious stimulus.
Sensation Intensity and Unpleasantness ratings
giving higher ratings in all cases. These findings are highly important as they show for the first time a significant difference in touch perception in a group on individuals that has a history of chronic pain as opposed to only current chronic pain.
Limitations and Future Directions
While the current study found multiple significant and thought provoking outcomes, as with any study, there are ways in which it could have been improved upon to provide more useful data. Given the young and generally healthy sample used, application of the findings may be in clinical populations dealing with chronic pain. However, this is still advantageous as most studies that examine chronic pain do so either with current chronic pain sufferers or older populations. Thus, the sample used here has yielded results that have not yet been displayed in those populations, providing a new invaluable perspective on chronic pain history, executive functioning, and pain perception.
One other limiting factor of this research was sample size. A larger sample would have been preferable as there was likely not sufficient power here to show some potentially significant effects, such as total CPM levels between groups. In spite of this, however, we still managed to identify many statistically significant differences which speak to the intensity of effect size for these variables.
Looking forward, future studies should aim to discern causal directions among the variables explored here. Large scale longitudinal studies appear most promising for
This information would in turn allow for better chronic pain prevention and treatment in addition to more broad knowledge regarding pain and executive functioning as a whole. With such
References
Abeare, C.A., Cohen, J.L., Axelrod, B.N., Leisen, C.C., Mosley-Williams, A., & Lumley, M.A.
(2010). Pain, executive functioning, and affect in patients with rheumatoid arthritis. The Clinical Journal of Pain, 26(8), 683-689.
Arntz, A., Dreessen, L., Merckelback, H. (1991). Attention, not anxiety, influences pain.
Behavior Research and Therapy, 29(1), 41-50.
Botvinick, M., & Cohen, J. ( 1998). Rubber hands “feel” touch that eyes see. Nature, 391, 756.
Chapman, C. R. (1978). Pain: The perception of noxious events. In R. A. Sternbach (Ed.), The psychology of pain (pp. 169-202). New York: Raven Press.
Gescheider, G.A. (1997). Psychophysics: the fundamentals. 3rd ed. Mahwah, New Jersey:
Lawrence Erlbaum.
Global Industry Analysts, Incorporated. (2011).
Grisart, J.M., & Plaghki, L.H. (1999). Impaired selective attention in chronic pain patients.
European Journal of Pain, 3, 325-333.
Grunau, R. E., Whitfield, M. F., Petrie-Thomas, J., Synnes, A. R., Cepeda, I. L., Keidar, A.,
Rogers, M., MacKay, M., Hubber-Richard, P., & Johannesen, D. (2009). Neonatal pain,
parenting stress and interaction, in relation to cognitive and motor development at 8 and
18 months in preterm infants. Pain, 143(1-2), 138-146.
Kahn-Greene, E.T., Killgore, D.B., Kamimori, G.H., Balkin, T.J., Killgore, W.D. (2007). The
effects of sleep deprivation on symptoms of psychopathology in healthy adults. Sleep Medicine, 8(3), 215-221.
Le Bars, D., Dickenson A.H., Besson J. M. (1979). Diffuse noxious inhibitory controls (DNIC).
I. Effects on dorsal horn convergent neurons in the rat. Pain, 6, 283-304.
McDermid, A. J., Rollman, G. B., & McCain, G. A. (1996). Generalized hypervigilance in fibromyalgia: evidence of perceptual amplification. Pain, 66, 133-144.
Miron, D., Duncan, G.H., Bushnell, C.M. (1989). Effects of attention on the intensity and unpleasantness of thermal pain. Pain, 39(3), 345-352.
Moont, R., Pud, D., Sprecher, E., Sharvit, G., Yarnitsky, D. (2010) ‘Pain inhibits pain’ mechanisms: Is pain modulation simply due to distraction? Pain, 150(1), 113-120. Pollatos, O., Füstös, J., & Critchley, H. D. (2012). On the 32eneralized embodiment of pain:
How interoceptive sensitivity modulates cutaneous pain perception. Pain, 153, 1680-1686.
Rollman, G. B., & Lautenbacher, S. (1993). Hypervigilance effects in fibromyalgia: Pain experience and pain perception. In H. Værøy & H. Merskey (Eds.), Progress in fibromyalgia and myofascial pain (Vol. 6). Amsterdam: Elsevier.
Stroop, J.R. (1935). Studies of interference in serial verbal reactions. Journal of Experimental Psychology, 18(6), 643-662.
Turner, M. L., & Engle, R. W. (1989). Is working memory capacity task dependent? Journal of Memory & Language, 28,127-154.
Unsworth, N., Heitz, R.P., Schrock, J.C., & Engle, R.W. (2005). An automated version of the
Wollgarten-Hadamek, I., Hohmeister, J., Demirakca, S., Zohsel, K., Flor, H., & Hermann, C.
(2009). Do burn injuries during infancy affect pain and sensory sensitivity in later
childhood? Pain, 141(1-2), 165-172.
Wollgarten-Hadamek, I., Hohmeister, J., Zohsel, K., Flor, H., & Hermann, C. (2011). Do
school-aged children with burn injuries during infancy show stress-induced activation of pain