R E S E A R C H A R T I C L E
Open Access
Frequency of HIV-testing and factors
associated with multiple lifetime
HIV-testing among a rural population
of Zambian men
B. Hensen
1*, JJ Lewis
2, A. Schaap
2,3, M. Tembo
3, M. Vera-Hernández
4, W. Mutale
5, HA Weiss
2, J. Hargreaves
1,
JSA Stringer
6and H. Ayles
3,7Abstract
Background:Across sub-Saharan Africa, men's levels of HIV-testing remain inadequate relative to women’s. Men are less likely to access anti-retroviral therapy and experience higher levels of morbidity and mortality once initiated on treatment. More frequent HIV-testing by men at continued risk of HIV-infection is required to facilitate earlier diagnosis. This study explored the frequency of HIV-testing among a rural population of men and the factors associated with more frequent HIV-testing.
Methods:We conducted a secondary analysis of a population-based survey in three rural district in Zambia, from February-November, 2013. Households (N= 300) in randomly selected squares from 42 study sites, defined as a health facility and its catchment area, were invited to participate. Individuals in eligible households were invited to complete questionnaires regarding demographics and testing behaviours. Men were defined as multiple HIV-testers if they reported more than one lifetime test. Upon questionnaire completion, individuals were offered rapid home-based HIV-testing.
Results:Of the 2376 men, more than half (61 %) reported having ever-tested for HIV. The median number of lifetime tests was 2 (interquartile range = 1-3). Just over half (n= 834; 57 %) of ever-testers were defined as multiple-testers. Relative to never-testers, multiple-testers had higher levels of education and were more likely to report an occupation. Among the 719 men linked to a spouse, multiple-testing was higher among men whose spouse reported ever-testing (adjusted prevalence ratio = 3.02 95 % CI: 1.37-4.66). Multiple-testing was higher in study sites where anti-retroviral therapy was available at the health facility on the day of a health facility audit. Among ever-testers, education and occupation were positively associated with multiple-testing relative to reporting one lifetime HIV-test. Almost half (49 %) of ever-testers accepted the offer of home-based HIV-testing.
Discussion:Reported HIV-testing increased among this population of men since a 2011/12 survey. Yet, only 35 % of all men reported multiple lifetime HIV-tests. The factors associated with multiple HIV-testing were similar to factors associated with ever-testing for HIV. Men living with HIV were less likely to report multiple HIV-tests and employment and education were associated with multiple-testing. The offer of home-based HIV-testing increased the frequency of HIV-testing among men.
Conclusion:Although men's levels of ever-testing for HIV have increased, strategies need to increase the lifetime frequency of HIV-testing among men at continued risk of HIV-infection.
* Correspondence:[email protected]
1Department of Social and Environmental Health Research, Faculty of Public Health and Policy, London School of Hygiene and Tropical Medicine, 15-17 Tavistock Place, London WC1H 9SH, UK
Full list of author information is available at the end of the article
Background
Annual HIV-testing and counselling (HTC) in high preva-lence settings is recommended for individuals at continued risk of HIV infection to support early detection of HIV-infection and initiation of anti-retroviral therapy (ART) [1]. Mathematical models suggest that the provision of
“high-quality”HTC services to all individuals will increase the HIV-prevention impact of HTC service delivery [2]. In settings where annual HTC is recommended, including Zambia, men’s levels of ever HIV-testing remain lower than is needed to link men testing HIV-positive into care [3–5]. Encouraging men to increase their lifetime fre-quency of HIV-testing may prove challenging [6].
Studies exploring risk factors for HIV-testing in sub-Saharan Africa highlight that age [3, 7–10], employment [4, 11], education [8, 10, 12] and socio-economic pos-ition [4, 12], marital status [8, 10], having heard of ART [4], community-level employment and HIV-knowledge [13] are associated with men ever-testing. Whether these factors also encourage men to test more frequently de-serves exploration, to determine whether the expansion of HTC services has increased the frequency of HTC among men at risk of HIV-infection. Such evidence would sup-port the development of strategies to reach men in need of annual HIV-testing.
This study describes the frequency of HIV-testing among a rural population of Zambian men and explores the fac-tors associated with frequent HIV-testing. We hypothe-sized that, relative to never-testers, the factors associated with multiple HIV-testing would be similar to ever-testing for HIV. Among men with a history of ever HIV-testing, we hypothesized that men reporting frequent HIV-testing would differ in socio-demographic characteristics from men reporting one lifetime HIV-test. We also explore whether an offer of home-based HIV-testing in a research setting increases the frequency of testing among men with a history of HIV-testing.
Methods
We analyzed data collected for a stepped-wedge clus-ter randomized trial (CRT): the Betclus-ter Health Outcomes through Mentoring and Assessment (BHOMA) trial, which aims to strengthen the healthcare system [14]. Details of the intervention are published elsewhere [14, 15]. Briefly, BHOMA was implemented in 42 clusters, defined as a health facility and its catchment area, in three districts in Lusaka Province, Zambia. BHOMA aims to reduce age-adjusted all-cause and under-5 mortality, and is being eval-uated through three rounds of household surveys [14]. Increasing HIV-testing is not a primary or secondary objective. However, health facilities were equipped with diagnostics and essential medicines [14], healthcare workers provided with protocols to guide adult visits alongside re-cruitment of community health workers to increase
demand for health services [14]. The majority of BHOMA study sites were rural (n= 34, 81 %). Data for the present analysis were from the mid-line evaluation (February-November, 2013) after intervention implementation in all sites.
In each cluster, squares of 900 m2 were marked within a 3.8 km of the health facility [3, 14]. Computer-generated randomization was used to determine which squares would be visited and the order of visitation. All house-holds in randomly selected squares where the survey was started were visited until 300 households were enumer-ated in each cluster.
Data collection
Data collection tools included: household enumeration, and household and individual questionnaires. Due to finan-cial constraints, households were either invited to complete a partial (household enumeration and questionnaire only) or full survey (household members asked to complete an individual questionnaire and offered measurements includ-ing blood glucose and pressure, and HIV-testinclud-ing). System-atic random sampling was used to select households for participation in the full survey, with every 2.5th household offered the full survey (n= 6788; 57 %). Personal digital as-sistants (PDAs) informed research asas-sistants which survey to offer a household prior to visitation. Data to estimate BHOMA’s primary outcome were obtained from house-hold enumeration Repeat visits were only conducted if en-tire households were absent. Questionnaires were adapted from Demographic and Health Surveys (DHS) and admin-istered using PDAs. Household questionnaires included questions on asset ownership and housing material. Indi-viduals aged 15–59 years were eligible for the individual questionnaire. After questionnaire completion, individuals were offered voluntary HIV-testing (Determine™HIV-1/2).
Statistical analysis
We restricted analyses to men. Outcomes of interest in-cluded i) never-testing, ii) ever-testing (defined as testing and receiving the result of an HIV-test), and iii) multiple-testing (defined as reporting >1 lifetime HIV-test). Ever-testers reporting one lifetime HIV-test were defined as one-time testers. Men self-reporting that they were living with HIV were defined as multiple-testers if their first HIV-test was before the test in which they received their HIV-positive diagnosis.
We described the distribution of the outcomes by socio-demographic characteristics, temporary migrancy (defined as being absent ≥1 month in the 6 months preceding the survey), and a history of TB-treatment. During household enumeration, females were asked what the number of their spouse was as listed on the enumeration form. Using this number, females were linked to their spouse. For men linked to a spouse who completed a questionnaire, we described outcomes by whether the spouse was pregnant, reported having children or ever HIV-tested. At cluster-level, we described outcomes by ART availability at the local health facility, HIV-prevalence, whether or not≥50 % of men reported employment and whether 25 % of men listed 3+ ways to prevent HIV-infection.
Data on whether unexpired ART was available at health facilities was obtained from a health facility audit (con-ducted in 2012) [16]. A household SEP indicator was de-veloped using principal components analysis (PCA) [3]. PCA was conducted on households with no missing data, regardless of whether households completed the full or partial survey, whether an eligible man was present and without taking account of district or rural/urban residence. SEP scores were divided into quintiles.
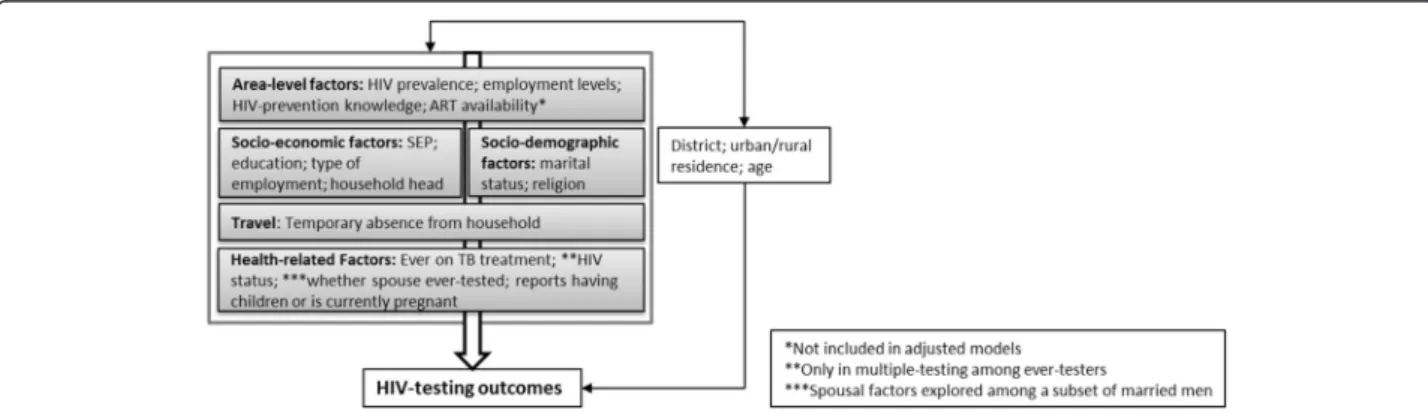
We estimated minimally-adjusted associations be-tween independent variables and outcomes controlling for age, urban residence and a fixed effect for the three districts. Factors significant at the p≤0.1 level in minimally-adjusted models were included in multivariable models based on the framework in Fig. 1. Socio-demographic factors were not adjusted for the more prox-imal factors likely to mediate their effect. Associations with community-level characteristics were estimated without adjustment for individual-level variables. Spousal character-istics were explored among the sub-set of men linked to a spouse. Multivariable models included a continuous vari-able for cluster size.
We fit random effects logistic regression models in Stata 13.0 to adjust for geographic clustering. We checked the reliability of model estimates by running the
quadchkcommand. For age, education and SEP we con-ducted a test assuming linear trend if there appeared to be a linear association. Due to the high prevalence of the outcomes, we estimated associations with preva-lence ratios (PRs) using marginal standardization to esti-mate PRs, and the delta method to estiesti-mate 95 % confidence intervals (95 % CI). We used the likelihood ra-tio test (LRT) to estimate p-values.
Missing data
Survey non-participation was high due to men being ab-sent at the time of the household survey. We used Heckman-type selection models to investigate the null hypothesis that outcomes were “missing at random” conditional on covariates available for non-participants [17–19]. We identified three variables that we theorized would be associated with survey participation but not HIV-testing: time (morning, afternoon, evening), day (Monday-Thursday, Friday, Saturday-Sunday) and sea-son (rainy, cool/dry, hot/dry) of the survey. These variables were included in a random effects model con-trolling for variables crudely associated with participation to investigate whether they were independently associated with participation (Appendix 1: Table 4) [18]. Characteris-tics of eligible participants were randomly distributed by time but not day of the survey (Appendix 3: Table 6). Time was entered in the model as a selection variable. Data available on non-participants and associated with HIV-testing in a 2011/12 survey [3] or theorized to be as-sociated were included in the outcome model. We assessed evidence for the null hypothesis using rho and its p-value [18]. Estimates of association between independ-ent variables and outcome were obtained by adjust-ing for variables as described in Fig. 1. Cluster-level variables were not adjusted for proximal factors. We investigated whether adjustment for variables in-cluded in the Heckman models affected estimates of association.
Ethics statement
BHOMA was approved by the University of Zambia Bio-ethics Committee, the London School of Hygiene and Tropical Medicine Ethics Committee and the institutional review boards at the University of Alabama at Birmingham (Birmingham, AL, USA) and University of North Carolina (Chapel Hill, NC, USA) [14]. Individuals were informed of the study objectives and asked for written informed con-sent. Consent was obtained from a parent/guardian for in-dividuals aged 15–17 years.
Results
Sample population
Of 5145 households invited to complete the full survey, 5144 consented. In these households, 6202 eligible men were enumerated of whom 29 did not have full data available and 376 were listed as absent in the month of or the month preceding the survey, leaving 5797 (93 %) men defined as eligible to participate. Among these men, 42 % (n= 2463) participated (Fig. 2). Participation ranged from 22–65 % (median: 42 %; inter-quartile range
(IQR): 34–51 %) across study sites. Men of highest SEP were less likely to participate than men of lowest SEP (PR = 0.74, 95 % CI: 0.66-0.83; Appendix 1: Table 4). Men listed as a household head were more likely to par-ticipate (PR = 1.34 95 % CI: 1.25-1.43).
Frequency of HIV-testing
Among participating men, 37 % (n= 877/2376) re-ported never-testing for HIV, and 2 % (n= 40/2376) tested but never received the result of an HIV-test. Overall, 61 % (n= 1459) of men ever-tested. Ever-testing ranged from 44–87 % (median = 62 %; IQR = 56–67 %) across study sites. Among ever-testers, 7 % (n= 98) reported themselves HIV-positive. The num-ber of lifetime HIV-tests ranged from 1–25 (median = 2; IQR = 1–3).
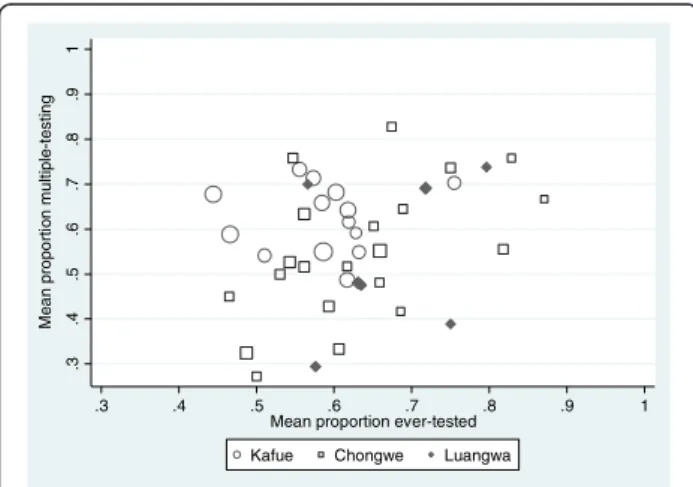
Just over half of ever-testers (57 %; n= 834/1459) were defined as multiple-testers (Fig. 2). Among ever-testers, levels of multiple-testing were 62 % in Kafue district and 55 % in Chongwe and Luangwa. There was evi-dence for correlation between multiple-testing among
ever-testers and ever-testing in Chongwe district (Chongwe r= 0.54;p= 0.01; Kafuer= 0.05;p= 0.86; Luangwar= 0.34; p= 0.46; Fig. 3). Multiple-testing ranged from 27– 83 % (median = 57 %; IQR: 48–68 %) across study sites and was clustered by study site (intra-cluster correlation coefficient (ICC) = 0.05 95 % CI: 0.03-0.11; p< 0.01). Just over half (57 %) the men living with HIV reported one-lifetime HIV-test. An estimated 14 % HIV-tested prior to the test in which they received an HIV-positive diagnosis.
The median numbers of years between first and most recent HIV-test was 2 (IQR: 1–4). Half (n= 422; 51 %) of multiple-testers and 29 % (n= 176) of one-time testers re-ported their first HIV-test between 2009 and 2011. Sixty-percent (n= 504) of multiple-testers and 31 % (n= 191) of one-time testers tested within 12 months of the survey. Over half of one-time (n= 341; 55 %) and multiple-testers (n= 498; 60 %) reported their most recent HIV-test at the local health facility.
Factors associated with multiple HIV-testing
Relative to never-testers, multiple-testing was higher among men aged 30–39 relative to men 20–29 (65 % vs 53 %; adjPR = 1.25 95 % CI: 1.12-1.39; Table 1), men with complete secondary/higher education rela-tive to men with no/primary education (65 % vs 43 %; adjPR = 1.59 95 % CI: 1.38-1.81) and among men reporting service/professional employment rela-tive to men reporting no employment (70 % vs 33 %; adjPR = 1.29 95 % CI: 1.08-1.50; Table 1). Multiple-testing was higher among married/cohabiting men relative to single men (61 % vs 32 %; adjPR = 1.23 95 % CI: 1.03-1.43) and among Protestant men (52 %) relative to men of no religion (33 %; adjPR = 0.69 95 % CI: 0.47-0.90). There was weak evidence that men of middle SEP were more likely to report multiple-testing relative to men of lowest SEP (adjPR = 1.19 95
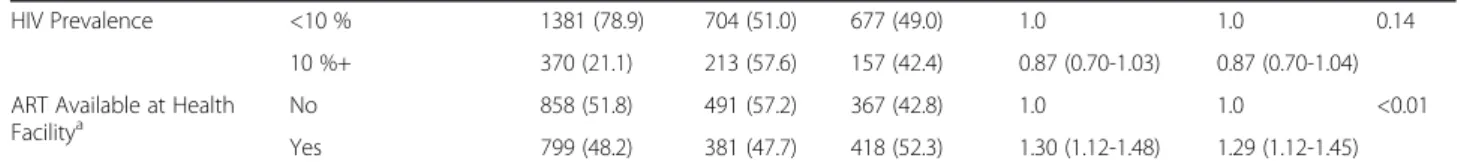
% CI: 1.02-1.37). Having a spouse who reported ever-testing was associated with multiple-ever-testing (adjPR = 3.02 95 % CI: 1.37-4.66) with little evidence that hav-ing children was associated (p= 0.20). There was little evidence that multiple-testing differed by cluster-level employment or HIV-knowledge. Multiple-testing was higher in sites where ART was available on the day of the audit (52 % vs 43 %; adjPR = 1.29 95 % CI: 1.12-1.45).
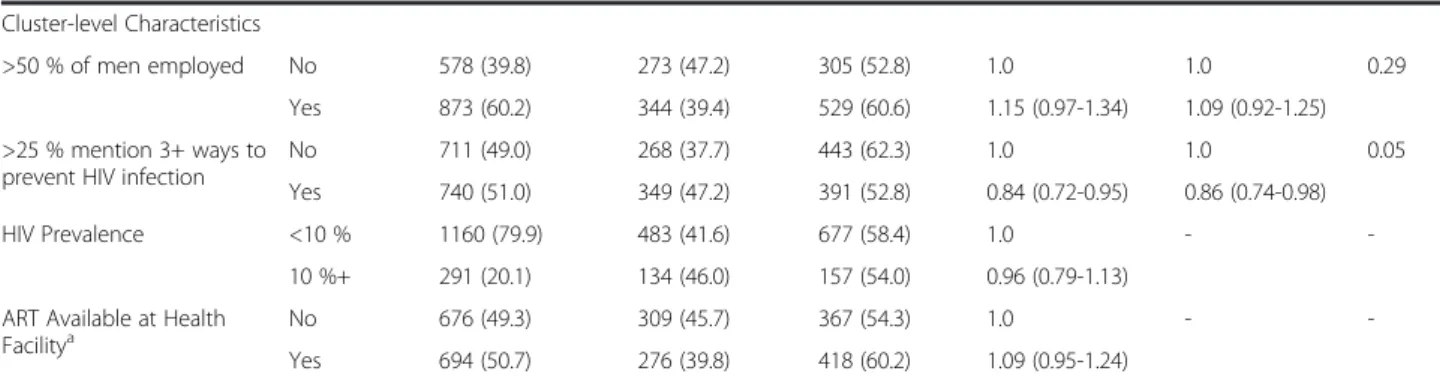
Relative to one-time testers, multiple-testers were less likely to be aged 15–19 (adjPR compared to 20–29: 0.63 95 % CI: 0.49-0.77; Table 2). Among men working on their own land, 70 % reported multiple-testing relative to 48 % of men reporting no employment (adjPR = 1.45 95 % CI 1.27-1.63). There was little evidence of an asso-ciation with marital status, a history of TB treatment or household SEP, with weak evidence that multiple-testing differed by being household head, pregnancy status of the spouse, or having children (Table 2). Men living with HIV were less likely to report multiple-tests prior to diagnosis (14 % vs 61 % among HIV-negative men; adjPR = 0.22; 95 % CI: 0.11-0.33). There was little evi-dence for an association with ART availability or cluster-level employment. Multiple-testing was lower in clusters with higher levels of HIV-prevention knowledge (53 % vs 62 %; adjPR =0.86 95 % CI: 0.74-0.98).
Acceptance of an offer of home-based HIV-testing
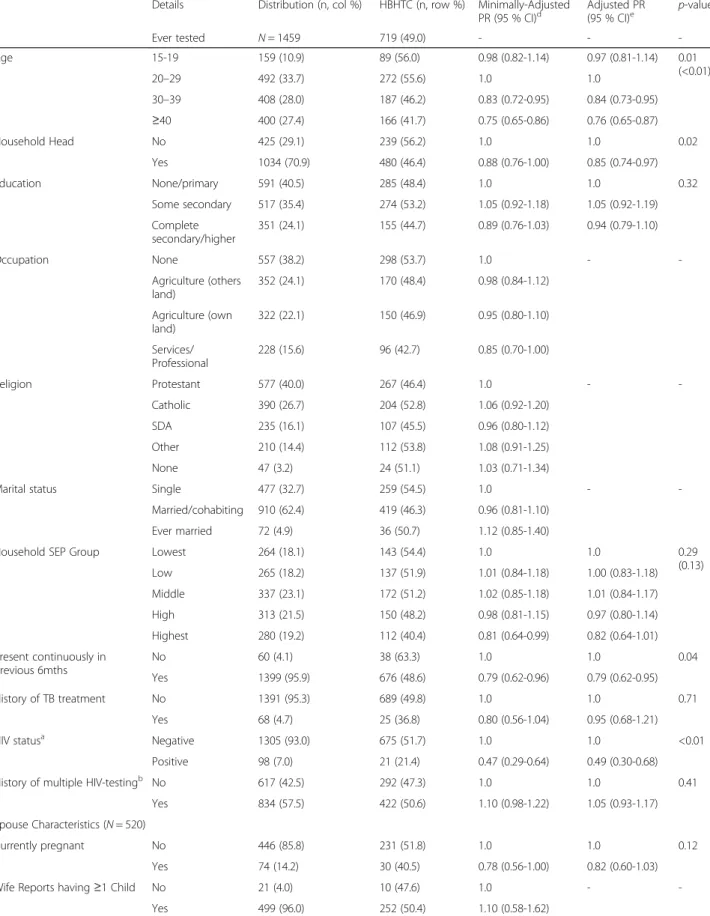
Almost half of never- and ever-testers accepted the offer of home-based HIV-testing (48 %; n= 449 & 49 %;n= 719, respectively). Acceptance among ever-testers was clustered by study site (median: 48.0 % IQR: 40.0-54.7 %; ICC = 0.06 95 % CI 0.03-0.11;p< 0.01). Acceptance was similar among multiple- (n= 422; 51 %) and one-time testers (n= 292; 47 %; adjPR = 1.05 95 % CI: 0.93-1.17; Table 3). Among men reporting themselves HIV-negative or who did not know their HIV-status, 3 % tested HIV-positive at this test.
Acceptance was lower among men aged ≥40 years relative to men aged 20–29 (42 % vs 56 %; adjPR = 0.76; 95 % CI: 0.65-0.87). There was little evidence that ac-ceptance was associated with occupation, education, reli-gion or marital status. Men present continuously in the 6 months preceding the survey were less likely to accept the offer relative to men with a period of being absent (adjPR = 0.79 95 % CI: 0.62-0.95) as were men whose spouse ever-tested (adjPR = 0.66 95 % CI: 0.50-0.81). Ac-ceptance was lower among men listed as a household head (adjPR relative to men not a head = 0.85 95 % CI: 0.74-0.97) and among men of highest SEP (40 %) relative to men of lowest SEP (54 %; adjPR = 0.82 95 % CI: 0.64-1.01) with some evidence for a linear trend with SEP (p= 0.14). There was little evidence that cluster-level employment, HIV-prevalence or ART availability
.3
.4
.5
.6
.7
.8
.9
1
Me
a
n
p
ro
p
o
rt
io
n
mu
lt
ip
le
-te
sti
n
g
.3 .4 .5 .6 .7 .8 .9 1
Mean proportion ever-tested
Kafue Chongwe Luangwa
Table 1Distribution of characteristics by never- and multiple-testers and factors associated with multiple HIV-testing relative to never-testers (N= 1751)
Details Multiple-testers & never-testers (n, col %)
Never-Testers (n, row %)
Multiple Testers (n, row %)
Minimally-adjusted PR (95 % CI)b
Adjusted PR (95 % CI)c
p-valued
Age 15-19 387 (22.1) 328 (84.8) 59 (15.2) 0.28 (0.21-0.36) 0.29 (0.22-0.37) <0.01
20-29 553 (31.6) 259 (46.8) 294 (53.2) 1.0 1.0
30-39 391 (22.3) 137 (35.0) 254 (65.0) 1.23 (1.09-1.36) 1.25 (1.12-1.39) (<0.01) ≥40 420 (24.0) 193 (46.0) 227 (54.0) 1.02 (0.89-1.14) 1.04 (0.91-1.16)
Head of household No 680 (38.8) 472 (69.4) 208 (30.6) 1.0 1.0 0.06
Yes 1071 (61.2) 445 (41.5) 626 (58.5) 1.28 (1.09-1.46) 1.15 (0.97-1.32)
Religion Protestant 684 (39.1) 332 (48.5) 352 (51.5) 1.0 1.0 0.01
Catholic 435 (24.8) 229 (52.6) 206 (47.4) 0.89 (0.78-1.00) 0.91 (0.80-1.01)
SDA 257 (14.7) 122 (47.5) 135 (52.5) 1.01 (0.88-1.15) 0.98 (0.85-1.11)
Other 305 (17.4) 187 (61.3) 118 (38.7) 0.78 (0.66-0.90) 0.83 (0.71-0.96)
None 70 (4.0) 47 (67.1) 23 (32.9) 0.59 (0.38-0.79) 0.69 (0.47-0.90)
Marital status Single 762 (43.5) 522 (68.5) 240 (31.5) 1.0 1.0 0.02
Married/cohabiting 913 (52.1) 361 (39.5) 552 (60.5) 1.33 (1.12-1.53) 1.23 (1.03-1.43)
Ever married 76 (4.3) 34 (44.7) 42 (55.3) 1.26 (0.94-1.59) 1.30 (0.99-1.61)
Education No/Primary 745 (42.5) 426 (57.2) 319 (42.8) 1.0 1.0
Incomplete secondary 649 (37.1) 366 (56.4) 283 (43.6) 1.29 (1.13-1.44) 1.26 (1.11-1.40) <0.01
Secondary or higher 357 (20.4) 125 (35.0) 232 (65.0) 1.61 (1.41-1.81) 1.59 (1.38-1.81) (<0.01)
Occupation None 802 (45.8) 536 (66.8) 266 (33.2) 1.0 1.0 <0.01
Agriculture (others land) 378 (21.6) 182 (48.1) 196 (51.9) 1.17 (0.99-1.34) 1.11 (0.94-1.27)
Agriculture (own land) 357 (20.4) 134 (37.5) 223 (62.5) 1.39 (1.19-1.60) 1.30 (1.11-1.48)
Services/Professional 214 (12.2) 65 (30.4) 149 (69.6) 1.53 (1.30-1.77) 1.29 (1.08-1.50)
SEP Group Lowest 343 (19.6) 184 (53.6) 159 (46.4) 1.0 1.0 0.06
Low 331 (18.9) 188 (56.8) 143 (43.2) 1.01 (0.83-1.18) 0.99 (0.93-1.14)
Middle 365 (20.8) 179 (49.0) 186 (51.0) 1.24 (1.03-1.44) 1.19 (1.02-1.37)
High 361 (20.6) 189 (52.4) 172 (47.6) 1.21 (1.01-1.42) 1.09 (0.92-1.26)
Highest 351 (20.0) 177 (50.4) 174 (49.6) 1.32 (1.08-1.55) 1.04 (0.84-1.25)
Present continuously previous 6mths
No 87 (5.0) 50 (57.5) 37 (42.5) 1.0 -
-Yes 1664 (95.0) 867 (52.1) 797 (47.9) 1.12 (0.85-1.40)
History of TB treatment No 1702 (97.2) 899 (52.8) 803 (47.2) 1.0 -
-Yes 49 (2.8) 18 (36.7) 31 (63.3) 1.15 (0.88-1.43) -
-Spousal Characteristics (N= 511)
Currently pregnant No 447 (87.6) 179 (40.0) 268 (60.0) 1.0 -
-Yes 63 (12.4) 19 (30.2) 44 (69.8) 1.16 (0.95-1.38)
Has Children No 27 (5.3) 14 (51.9) 13 (48.2) 1.0 1.0 0.20
Yes 483 (94.7) 183 (37.9) 300 (62.1) 1.34 (0.76-1.91) 1.26 (0.76-1.76)
Wife previously HIV-tested No 56 (11.0) 46 (82.1) 10 (17.9) 1.0 1.0 <0.01
Yes 454 (89.0 151 (33.3) 303 (66.7) 3.53 (1.50-5.57) 3.02 (1.37-4.66)
Cluster-level Characteristics
>50 % of men employed No 684 (39.1) 379 (55.4) 305 (44.6) 1.0 -
-Yes 1067 (60.9) 538 (50.4) 529 (49.6) 1.10 (0.91-1.29) -
->25 % mention 3+ ways to prevent HIV infection
No 878 (50.1) 435 (49.5) 443 (50.5) 1.0 -
-were associated with acceptance. There was weak evi-dence that acceptance was higher in clusters with higher HIV-prevention knowledge (55 % vs 43 %; adjPR = 1.12 95 % CI: 0.95-1.30).
Heckman-type selection modelling
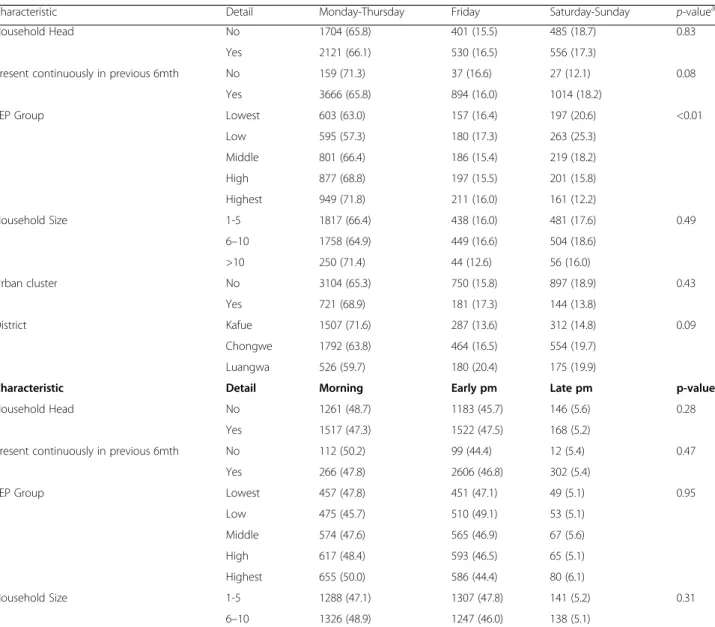
Participation was somewhat higher among men visited on Saturday/Sunday (48 %) relative to Monday-Thursday (41 %) and among men visited in the after-noon (45 %) relative to the morning (41 %; adjPR = 1.08 95 % CI 1.01-1.14; (Appendix 2: Table 5)). There was little evidence for unobserved factors influencing sur-vey participation and HIV-testing outcomes (ever-testing: rho =−0.12 95 % CI:-0.93 to 0.88; p= 0.88; multiple-testing: rho = 0.20 95 % CI:-0.87 to 0.94;p= 0.80) however, confidence intervals were very wide. Results were similar when day of the week was included in the selection models Estimates of association between independent variables and multiple-testing were similar when adjusting for vari-ables included in the Heckman-type selection model.
Discussion
In this large, population-based survey of predominantly rural men, 61 % (95 % CI: 58-64 %) of men were defined as ever-testers. Over half the men with a history of HIV-testing reported more than one lifetime HIV-test. Factors associated with multiple-testing were similar to factors as-sociated with ever-testing [3, 8, 10, 12]. The offer of home-based HIV-testing increased the lifetime frequency of HIV-testing among half of one-time and never-testers.
Limitations of this study are that, as data were cross-sectional, temporal relationships cannot be inferred. Data were self-reported and collected retrospectively. Men may have over-reported HIV-testing and there are likely to be errors in recalling dates of HIV-tests. As a secondary analysis of data collected for an unrelated CRT, the study had limited capacity to explore whether men were HIV-testing annually as data were collected on years since first and most recent test, and number of HIV-tests. Nonetheless, most multiple-testers first tested in 2009 or later, suggesting that recent expansions of HTC services, including PITC, have increased men’s fre-quency of HIV-testing. In the absence of data on sexual
behaviours we had limited ability to explore whether multiple-testers were at increased risk of HIV-infection. However, we found that few men living with HIV re-ported HIV-testing prior to diagnosis. Although this measure is subject to limitations as multiple-testing was inferred from date of first test and of HIV-diagnosis, with almost 60 % of HIV-positive men reporting one lifetime test, findings suggest that a high proportion of men continue to be diagnosed on their first HIV-test. Further exploration of multiple-testing behaviours alongside data on sexual behaviours is needed. Some 60 % of married men were linked to their spouse; associations with spousal characteristics may be biased if characteristics of spouses linked dif-fered from those not linked. Generalisability may be limited as the health system strengthening interven-tion, implemented in all sites at the time of data col-lection, may have contributed to increased frequency of HIV-testing.
Finally, outcomes were at risk of bias due to non-participation. Studies have shown that Heckman-type selection models can be used to correct HIV-prevalence estimates where refusal to HIV-test is high [18, 20]. We used Heckman-models as we theorised that non-participation, largely due to absence, may be related to HIV-testing behaviours. The models sug-gested that there was no evidence for unobserved fac-tors associated with participation and HIV-testing outcomes. However, we had limited ability to model selection due to limited individual-level data on non-participants. The selection variables were weak predic-tors of participation and may not be valid exclusion restrictions [21], as survey timing within clusters was not randomly determined. Aspects of survey conduct may independently affect outcomes [18]; hence our estimates of correlation (rho) between outcome and participation had little precision.
Despite limitations, this study includes a large population of rural Zambian men whose multiple-testing behaviours have been understudied to date. The study provides important insights into the contri-bution of expanded HIV-testing service delivery to in-creasing men’s lifetime frequency of HIV-testing.
Table 1Distribution of characteristics by never- and multiple-testers and factors associated with multiple HIV-testing relative to never-testers (N= 1751)(Continued)
HIV Prevalence <10 % 1381 (78.9) 704 (51.0) 677 (49.0) 1.0 1.0 0.14
10 %+ 370 (21.1) 213 (57.6) 157 (42.4) 0.87 (0.70-1.03) 0.87 (0.70-1.04)
ART Available at Health
Facilitya No 858 (51.8) 491 (57.2) 367 (42.8) 1.0 1.0 <0.01
Yes 799 (48.2) 381 (47.7) 418 (52.3) 1.30 (1.12-1.48) 1.29 (1.12-1.45) a
94 missing dataN= 1657;bAdjusted for age, urban/rural residence and district;cAdjusted for variables higher in the conceptual framework (Fig.1);dFor adjusted model and based on LRT,p-value in brackets is assuming linear trend
e
Table 2Distribution of characteristics by one- and multiple-testers and factors associated with multiple HIV-testing relative to one-time testers (N= 1451)
Details Men with a history of ever-testing
One-time Testers (n, row %)
Multiple Testers (n, row %)
Minimally-adjusted PR (95 % CI)b
Adjusted PR (95 % CI)c
p-valued
Age 15-19 159 (11.0) 100 (62.9) 59 (37.1) 0.62 (0.48-0.76) 0.63 (0.49-0.77) <0.01 (0.03)
20-29 489 (33.7) 195 (39.9) 294 (60.1) 1.0 1.0
30-39 405 (27.9) 151 (37.3) 254 (62.7) 1.06 (0.95-1.18) 1.05 (0.94-1.16) ≥40 398 (27.4) 171 (43.0) 227 (57.0) 0.95 (0.84-1.06) 0.95 (0.84-1.06)
Head of household No 424 (29.2) 216 (50.9) 208 (49.1) 1.0 1.0 0.06
Yes 1027 (70.8) 401 (39.0) 626 (61.0) 1.15 (1.00-1.30) 1.13 (0.98-1.28)
Religion Protestant 575 (39.6) 223 (38.8) 352 (61.2) 1.0 1.0 0.15
Catholic 386 (26.6) 180 (46.6) 206 (53.4) 0.87 (0.77-0.98) 0.89 (0.79-0.99)
SDA 235 (16.2) 100 (42.6) 135 (57.4) 0.90 (0.78-1.03) 0.89 (0.77-1.01)
Other 208 (14.3) 90 (43.3) 118 (56.7) 0.92 (0.79-1.05) 0.99 (0.86-1.11)
None 47 (3.2) 24 (51.1) 23 (48.9) 0.78 (0.54-1.02) 0.86 (0.62-1.09)
Marital status Single 475 (32.7) 235 (49.5) 240 (50.5) 1.0 -
-Married/ cohabiting
905 (62.4) 353 (39.0) 552 (61.0) 1.15 (0.99-1.31)
Ever married 71 (4.9) 29 (40.8) 42 (59.2) 1.13 (0.87-1.40)
Education No/Primary 589 (40.6) 270 (45.8) 319 (54.2) 1.0 1.0
Incomplete secondary
515 (35.5) 232 (45.0) 283 (55.0) 1.08 (0.96-1.21) 1.11 (0.99-1.24) <0.01 (<0.01)
Secondary or higher
347 (23.9) 115 (33.1) 232 (66.9) 1.26 (1.11-1.41) 1.29 (1.13-1.44)
Occupation None 555 (38.2) 289 (52.1) 266 (47.9) 1.0 1.0 <0.01
Agriculture (others land)
351 (24.2) 155 (44.2) 196 (55.8) 1.11 (0.96-1.27) 1.10 (0.95-1.26)
Agriculture (own land)
320 (22.1) 97 (30.3) 223 (69.7) 1.46 (1.28-1.65) 1.45 (1.27-1.63)
Services/ Professional
225 (15.5) 76 (33.8) 149 (66.2) 1.27 (1.09-1.46) 1.19 (1.00-1.37)
SEP Group Lowest 263 (18.1) 104 (39.5) 159 (60.5) 1.0 -
-Low 264 (18.2) 121 (45.8) 143 (54.2) 0.91 (0.77-1.04)
Middle 336 (23.2) 150 (44.6) 186 (55.4) 0.90 (0.77-1.04)
High 311 (21.4) 139 (44.7) 172 (55.3) 0.92 (0.78-1.06)
Highest 277 (19.1) 103 (37.2) 174 (62.8) 1.05 (0.88-1.21)
Present continuously previous 6mths
No 60 (4.1) 23 (38.3) 37 (61.7) 1.0 -
-Yes 1391 (95.9) 594 (42.7) 797 (57.3) 0.91 (0.72-1.09)
History of TB treatment No 1383 (95.3) 580 (41.9) 803 (58.1) 1.0 1.0 0.62
Yes 68 (4.7) 37 (54.4) 31 (45.6) 0.76 (0.55-0.97) 1.06 (0.84-1.28)
HIV Status Negative 1297 (93.0) 507 (39.1) 790 (60.9) 1.0 1.0 <0.01
Positive 98 (7.0) 84 (85.7) 14 (14.3) 0.20 (0.10-0.31) 0.22 (0.11-0.33)
Spousal Characteristics (N= 517)
Currently pregnant No 443 (85.7) 175 (39.5) 268 (60.5) 1.0 – –
Yes 74 (14.3) 30 (40.5) 44 (59.5) 0.97 (0.77-1.17)
Has Children No No 20 (3.9) 13 (65.0) 1.0 -
-Yes Yes 497 (96.1) 299 (60.2) 0.93 (0.60-1.26)
Wife previously HIV-tested
No 24 (4.6) 14 (58.3) 10 (41.7) 1.0 1.0 0.32
To our knowledge, there are relatively few population-based surveys exploring the factors associ-ated with multiple-testing. In a 2007 population-based survey conducted in communities in Soweto, South Africa, 50 % of male ever-testers reported more than one lifetime test [4]. Multiple-testing was higher among individuals who had heard of ART [4]. In our study, multiple-testing was higher in clusters where ART was available at the health facility suggesting that expanded ART availability contributes not only to ever-testing [22], but to increased frequency of HIV-testing. In South and Central Province, Zambia (2010/11), 36 % of men ever-tested among whom 50 % reported >1 lifetime HIV-test [23]. In a 2012 nationally representative survey, 63 % of Kenyan males aged 15–64 years ever-tested with a median of 3 tests (IQR: 2–4) per person [10].
By the time of this study, HIV-testing services had been expanded across Zambia, couples HTC was recommended in ANC [24] and there was increased service promotion. Men whose spouse ever-tested were more likely to report multiple-tests. Similar to other settings, these findings sug-gest that HTC in ANC has provided men with access to HTC and may provide frequent access to HTC [12, 25]. Yet, few men attend ANC [25]. Considering the risk of HIV transmission among sero-discordant cohabiting/mar-ried couples, there remains a need to strengthen the deliv-ery of HTC services to men through ANC [26–28].
Similar to a survey in South Africa, multiple-testers in this study were more likely to have complete sec-ondary/higher education [4]. Employed men in this study were more likely to report multiple HIV-tests unlike in South Africa [4]. Formal employment may provide access to HTC services through the work-place thereby removing opportunity and financial costs of accessing facility-based HTC [29]. Alterna-tively, employed men may be encouraged by their employer or motivated by their role as providers to
access health services [30]. Men of lower socioeco-nomic markers may face unique barriers to accessing HTC services that influence their frequency of HIV-testing. Lower health literacy likely contributes to lower levels of multiple-testing among men with less education. Other contributing factors, such as ability to access available services, stigma associated with HIV-testing within social networks or as experienced from healthcare workers, may also influence men’s frequency of HIV-testing [31]. Understanding why so-cioeconomic factors continue to influence men’s HIV-testing behaviors in the context of expanded service availability, the need for regular HIV-testing by socio-economic factors and how to encourage men with lower levels of education or no formal employment to regularly test for HIV needs exploration.
Evidence suggests that men continue to access care at later stages of HIV-infection [32]. Regular-testing facilitates earlier diagnosis and opportunities to pro-vide risk reduction counselling to HIV-negative indi-viduals at higher risk of infection. In a facility-based cohort in South Africa, repeat-testers were less likely to be HIV-infected relative to first-time testers [33]. . In Uganda, South Africa and Zimbabwe, studies found that individuals at lower risk of HIV are more likely to ever- or repeat-test [4, 12, 34]. Conversely, in sero-logical surveys in Tanzania, high-risk individuals were more likely to repeatedly accept VCT [35]. In this study, 40 % of ever-testers reported one-lifetime HIV-test and few men living with HIV HIV-tested before their diagnoses. With investment in delivering community-based HTC [36], there is a need to monitor whether those in greatest need of annual HIV-testing are acces-sing services and the effects of frequent HIV-testing on sexual behaviors [37]. Traditional “know your sta-tus” messaging may require reframing to emphasize the importance of annual HIV-testing if at ongoing risk of HIV-infection.
Table 2Distribution of characteristics by one- and multiple-testers and factors associated with multiple HIV-testing relative to one-time testers (N= 1451)(Continued)
Cluster-level Characteristics
>50 % of men employed No 578 (39.8) 273 (47.2) 305 (52.8) 1.0 1.0 0.29
Yes 873 (60.2) 344 (39.4) 529 (60.6) 1.15 (0.97-1.34) 1.09 (0.92-1.25)
>25 % mention 3+ ways to prevent HIV infection
No 711 (49.0) 268 (37.7) 443 (62.3) 1.0 1.0 0.05
Yes 740 (51.0) 349 (47.2) 391 (52.8) 0.84 (0.72-0.95) 0.86 (0.74-0.98)
HIV Prevalence <10 % 1160 (79.9) 483 (41.6) 677 (58.4) 1.0 -
-10 %+ 291 (20.1) 134 (46.0) 157 (54.0) 0.96 (0.79-1.13)
ART Available at Health
Facilitya No 676 (49.3) 309 (45.7) 367 (54.3) 1.0 -
-Yes 694 (50.7) 276 (39.8) 418 (60.2) 1.09 (0.95-1.24) a
81 missing dataN= 1370;bAdjusted for age, urban/rural residence and district;cAdjusted for variables higher in the conceptual framework (Fig.1);dFor adjusted model and based on LRT,p-value in brackets is assuming linear trend
e
Table 3Acceptance of an offer of home-based HIV-testing by socio-demographic characteristics and factors associated with acceptance among ever-testers (N= 1459)
Details Distribution (n, col %) HBHTC (n, row %) Minimally-Adjusted PR (95 % CI)d
Adjusted PR (95 % CI)e
p-valuef
Ever tested N= 1459 719 (49.0) - -
-Age 15-19 159 (10.9) 89 (56.0) 0.98 (0.82-1.14) 0.97 (0.81-1.14) 0.01
(<0.01)
20–29 492 (33.7) 272 (55.6) 1.0 1.0
30–39 408 (28.0) 187 (46.2) 0.83 (0.72-0.95) 0.84 (0.73-0.95)
≥40 400 (27.4) 166 (41.7) 0.75 (0.65-0.86) 0.76 (0.65-0.87)
Household Head No 425 (29.1) 239 (56.2) 1.0 1.0 0.02
Yes 1034 (70.9) 480 (46.4) 0.88 (0.76-1.00) 0.85 (0.74-0.97)
Education None/primary 591 (40.5) 285 (48.4) 1.0 1.0 0.32
Some secondary 517 (35.4) 274 (53.2) 1.05 (0.92-1.18) 1.05 (0.92-1.19)
Complete secondary/higher
351 (24.1) 155 (44.7) 0.89 (0.76-1.03) 0.94 (0.79-1.10)
Occupation None 557 (38.2) 298 (53.7) 1.0 -
-Agriculture (others land)
352 (24.1) 170 (48.4) 0.98 (0.84-1.12)
Agriculture (own land)
322 (22.1) 150 (46.9) 0.95 (0.80-1.10)
Services/ Professional
228 (15.6) 96 (42.7) 0.85 (0.70-1.00)
Religion Protestant 577 (40.0) 267 (46.4) 1.0 -
-Catholic 390 (26.7) 204 (52.8) 1.06 (0.92-1.20)
SDA 235 (16.1) 107 (45.5) 0.96 (0.80-1.12)
Other 210 (14.4) 112 (53.8) 1.08 (0.91-1.25)
None 47 (3.2) 24 (51.1) 1.03 (0.71-1.34)
Marital status Single 477 (32.7) 259 (54.5) 1.0 -
-Married/cohabiting 910 (62.4) 419 (46.3) 0.96 (0.81-1.10)
Ever married 72 (4.9) 36 (50.7) 1.12 (0.85-1.40)
Household SEP Group Lowest 264 (18.1) 143 (54.4) 1.0 1.0 0.29
(0.13) Low 265 (18.2) 137 (51.9) 1.01 (0.84-1.18) 1.00 (0.83-1.18)
Middle 337 (23.1) 172 (51.2) 1.02 (0.85-1.18) 1.01 (0.84-1.17)
High 313 (21.5) 150 (48.2) 0.98 (0.81-1.15) 0.97 (0.80-1.14)
Highest 280 (19.2) 112 (40.4) 0.81 (0.64-0.99) 0.82 (0.64-1.01)
Present continuously in previous 6mths
No 60 (4.1) 38 (63.3) 1.0 1.0 0.04
Yes 1399 (95.9) 676 (48.6) 0.79 (0.62-0.96) 0.79 (0.62-0.95)
History of TB treatment No 1391 (95.3) 689 (49.8) 1.0 1.0 0.71
Yes 68 (4.7) 25 (36.8) 0.80 (0.56-1.04) 0.95 (0.68-1.21)
HIV statusa Negative 1305 (93.0) 675 (51.7) 1.0 1.0 <0.01
Positive 98 (7.0) 21 (21.4) 0.47 (0.29-0.64) 0.49 (0.30-0.68)
History of multiple HIV-testingb No 617 (42.5) 292 (47.3) 1.0 1.0 0.41
Yes 834 (57.5) 422 (50.6) 1.10 (0.98-1.22) 1.05 (0.93-1.17)
Spouse Characteristics (N= 520)
Currently pregnant No 446 (85.8) 231 (51.8) 1.0 1.0 0.12
Yes 74 (14.2) 30 (40.5) 0.78 (0.56-1.00) 0.82 (0.60-1.03)
Wife Reports having≥1 Child No 21 (4.0) 10 (47.6) 1.0 -
Home-based HIV-testing increased the lifetime fre-quency of HIV-testing among men in this study. As in other studies, there was little evidence that accept-ance differed by markers of SEP [38, 39]. The rela-tively high refusal in our study relative to others [3, 40] likely reflects service delivery in the context of research, where the priority was data collection, ra-ther than the acceptability of a home-based HTC programme [3]. In this study, multiple-testing was lower, but acceptance of home-based HIV-testing higher, in communities with higher HIV-prevention knowledge. These findings contribute to suggestions that poor accessibility influences men’s uptake of HTC services [38, 41]. Home-based HTC remains an important strategy to increase the frequency of HIV-testing among rural Zambian men with less access to services [3, 39]. However, with most men not home during household visits, a cost-effective strategy for offering regular home-based HIV-testing in rural set-tings requires exploration [40].
Conclusion
Effective strategies to reach men with HTC services are available [28], and levels of ever-testing increased among this population of men [3]. However, only 35 % of all men reported multiple HIV-tests and few men living with HIV reported HIV-testing before being di-agnosed. More effective implementation and delivery of available HTC services is required to reach men in need of frequent HTC [42]. Novel alternatives to en-courage never-testers to access existing HTC services should be explored [28]. These strategies could in-clude self-testing and incentivised testing, shown to be acceptable and feasible among men [43–45]. Add-itional research to investigate models for delivery,
yield of these strategies and whether they are effective at increasing HIV-testing among HIV-negative men at high risk of infection is required [46, 47].
Appendix
Table 4Characteristics of eligible men & Factors Associated with Participation (N= 5797)
Characteristic Detail Distribution (n, col %)
Participants (n, row %)
Crude PRa (95 % CI)
All men 5797 - 2463 (42.5)
-Age category 15-24 2303 (39.7) 934 (40.6) 1.0
25-60 3494 (60.3) 1529 (43.8) 1.08 (1.02-1.15)
Head of household
No 2590 (44.7) 921 (35.6) 1.0
Yes 3207 (55.3) 1542 (48.1) 1.34 (1.25-1.43)
Present continuously previous 6mths
No 223 (3.8) 116 (52.0) 1.0
Yes 5574 (96.2) 2347 (42.1) 0.80 (0.69-0.91)
SEP Lowest 957 (16.5) 463 (43.4) 1.0
Low 1038 (17.9) 471 (45.4) 0.96 (0.87-1.06)
Middle 1206 (20.8) 536 (44.4) 0.93 (0.84-1.02)
High 1275 (22.0) 517 (40.6) 0.84 (0.76-0.93)
Highest 1321 (22.8) 476 (36.0) 0.74 (0.66-0.83)
Household size 1-5 2736 (47.2) 1325 (48.4) 1.0
6–10 2711 (46.8) 1029 (38.0) 0.78 (0.73-0.83)
>10 350 (6.0) 109 (31.1) 0.64 (0.53-0.75)
Urban cluster No 4751 (82.0) 2042 (43.0) 1.0
Yes 1046 (18.0) 421 (40.3) 0.94 (0.75-1.13)
District Kafue 2106 (36.3) 886 (42.1) 1.0
Chongwe 2810 (48.5) 1122 (39.9) 0.95 (0.81-1.10)
Luangwa 881 (15.2) 455 (51.7) 1.23 (1.01-1.45)
Table 3Acceptance of an offer of home-based HIV-testing by socio-demographic characteristics and factors associated with acceptance among ever-testers (N= 1459)(Continued)
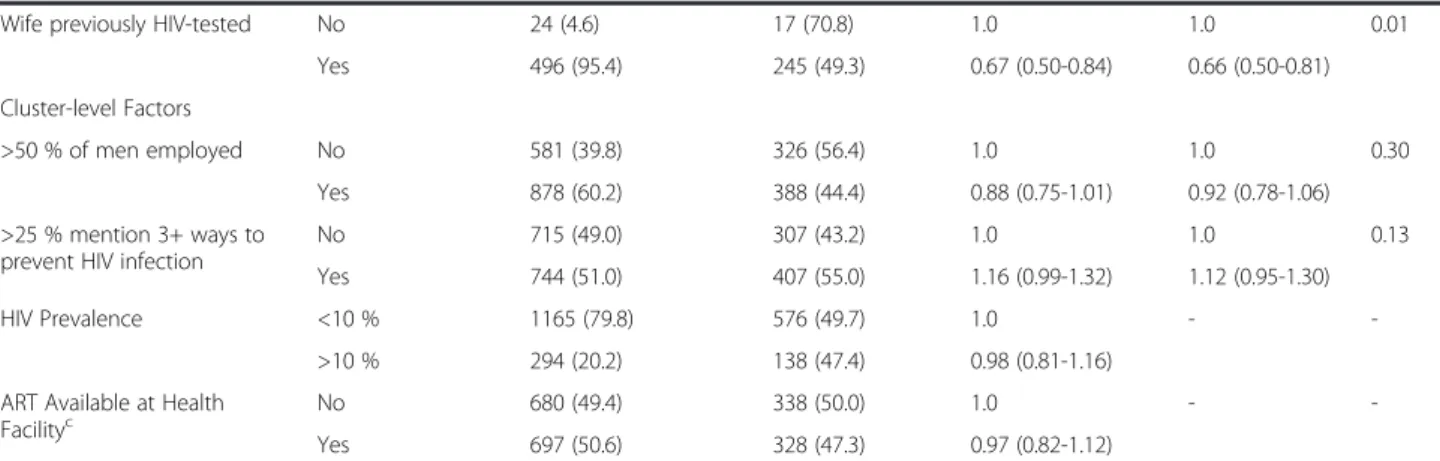
Wife previously HIV-tested No 24 (4.6) 17 (70.8) 1.0 1.0 0.01
Yes 496 (95.4) 245 (49.3) 0.67 (0.50-0.84) 0.66 (0.50-0.81)
Cluster-level Factors
>50 % of men employed No 581 (39.8) 326 (56.4) 1.0 1.0 0.30
Yes 878 (60.2) 388 (44.4) 0.88 (0.75-1.01) 0.92 (0.78-1.06)
>25 % mention 3+ ways to prevent HIV infection
No 715 (49.0) 307 (43.2) 1.0 1.0 0.13
Yes 744 (51.0) 407 (55.0) 1.16 (0.99-1.32) 1.12 (0.95-1.30)
HIV Prevalence <10 % 1165 (79.8) 576 (49.7) 1.0 -
->10 % 294 (20.2) 138 (47.4) 0.98 (0.81-1.16)
ART Available at Health Facilityc
No 680 (49.4) 338 (50.0) 1.0 -
-Yes 697 (50.6) 328 (47.3) 0.97 (0.82-1.12)
Number missing data:b
8 men missing data on dates of first and last test N=1451 a 56 missing HIV status data;N= 1395;c
82 missing data;d
Adjusted for age, urban/rural residence and district;e
Adjusted for variables higher in the conceptual framework (Fig.1);f
Table 5Distribution of eligible men by selection variables and association between participation and selection variables (N= 5797)
Selection Variables Description Distribution Participants Crude PR Adjusted PRa p-valueb
Time of Survey Morning (630–1159) 2778 (47.9) 1140 (41.0) 1.0 1.0 0.02
Afternoon (12–1559) 2705 (46.7) 1204 (44.5) 1.09 (1.02-1.16) 1.08 (1.01-1.14)
Late pm (16–1830) 314 (5.4) 119 (37.9) 0.92 (0.78-1.06) 0.94 (0.80-1.07)
Day of Survey Mon-Thurs 3825 (66.0) 1581 (41.3) 1.0 1.0 <0.01
Friday 931 (16.1) 378 (40.6) 0.97 (0.89-1.06) 0.97 (0.88-1.05)
Sat-Sun 1041 (18.0) 504 (48.4) 1.15 (1.06-1.24) 1.14 (1.05-1.23)
Season of Survey Rainy (Dec-Apr) 1566 (27.0) 694 (44.3) 1.0 1.0 0.20
Cool, dry (May-Aug) 2646 (45.6) 1123 (42.5) 0.92 (0.78-1.05) 0.93 (0.81-1.05)
Cool, hot (Sept-Nov) 1586 (27.4) 646 (40.7) 0.89 (0.72-1.05) 0.87 (0.73-1.01) a
Adjusted for household head, whether present all months in previous 6, household SEP and size, urban/rural residence and district;bFor adjusted PR and based on LRT
Table 6Distribution of characteristics of eligible men by selection variables (N= 5797)
Characteristic Detail Monday-Thursday Friday Saturday-Sunday p-valuea
Household Head No 1704 (65.8) 401 (15.5) 485 (18.7) 0.83
Yes 2121 (66.1) 530 (16.5) 556 (17.3)
Present continuously in previous 6mth No 159 (71.3) 37 (16.6) 27 (12.1) 0.08
Yes 3666 (65.8) 894 (16.0) 1014 (18.2)
SEP Group Lowest 603 (63.0) 157 (16.4) 197 (20.6) <0.01
Low 595 (57.3) 180 (17.3) 263 (25.3)
Middle 801 (66.4) 186 (15.4) 219 (18.2)
High 877 (68.8) 197 (15.5) 201 (15.8)
Highest 949 (71.8) 211 (16.0) 161 (12.2)
Household Size 1-5 1817 (66.4) 438 (16.0) 481 (17.6) 0.49
6–10 1758 (64.9) 449 (16.6) 504 (18.6)
>10 250 (71.4) 44 (12.6) 56 (16.0)
Urban cluster No 3104 (65.3) 750 (15.8) 897 (18.9) 0.43
Yes 721 (68.9) 181 (17.3) 144 (13.8)
District Kafue 1507 (71.6) 287 (13.6) 312 (14.8) 0.09
Chongwe 1792 (63.8) 464 (16.5) 554 (19.7)
Luangwa 526 (59.7) 180 (20.4) 175 (19.9)
Characteristic Detail Morning Early pm Late pm p-value
Household Head No 1261 (48.7) 1183 (45.7) 146 (5.6) 0.28
Yes 1517 (47.3) 1522 (47.5) 168 (5.2)
Present continuously in previous 6mth No 112 (50.2) 99 (44.4) 12 (5.4) 0.47
Yes 266 (47.8) 2606 (46.8) 302 (5.4)
SEP Group Lowest 457 (47.8) 451 (47.1) 49 (5.1) 0.95
Low 475 (45.7) 510 (49.1) 53 (5.1)
Middle 574 (47.6) 565 (46.9) 67 (5.6)
High 617 (48.4) 593 (46.5) 65 (5.1)
Highest 655 (50.0) 586 (44.4) 80 (6.1)
Household Size 1-5 1288 (47.1) 1307 (47.8) 141 (5.2) 0.31
Abbreviations
HIV:Human Immunodeficiency Virus; HTC: HIV testing and counselling; ART: Anti-retroviral therapy; CRT: Cluster randomised trial; BHOMA: Better Health Outcomes through Mentoring and Assessment; PDAs: Personal digital assistant; DHS: Demographic and Health Surveys; SEP: Socioeconomic position; TB: Tuberculosis; PCA: Principal components analysis; PR: Prevalence ratio; adjPR: Adjusted prevalence ratio; LRT: Likelihood ratio test; ICC: Intra-cluster correlation; IQR: Interquartile range.
Competing interests
The authors declare that they have no competing interests.
Authors’contributions
BH conceived this study, conducted the analyses, interpreted the data and drafted the first manuscript. JH conceived the study, advised on data analyses and made original text contributions. JL and HW participated in data interpretation and made original text contributions . JL also provided guidance on data analyses. AS, MT and WM participated in data acquisition and preparation for analyses. MvH participated in the Heckman analyses and the interpretation of these findings. JS and HA conceived and designed the CRT and made original text contributions All authors provided critical revisions to the manuscript and approved the final draft.
Authors’information
Not applicable.
Availability of data and materials
Not applicable.
Acknowledgements
BH was supported by an ESRC award ES/J500021/1
Author details
1Department of Social and Environmental Health Research, Faculty of Public Health and Policy, London School of Hygiene and Tropical Medicine, 15-17 Tavistock Place, London WC1H 9SH, UK.2MRC Tropical Epidemiology Group, Faculty of Epidemiology and Population Health, London School of Hygiene and Tropical Medicine, London, UK.3ZAMBART Project, Ridgeway Campus, University of Zambia, Nationalist Road, Lusaka, Zambia.4University College London and Institute for Fiscal Studies, London, UK.5Department of Public Health, University of Zambia School of Medicine, Lusaka, Zambia.6Global Women’s Health Division, Department of Obstetrics & Gynecology; Institute for Global Health and Infectious Diseases, School of Medicine, University of North Carolina, Chapel Hill, North Carolina, USA.7Department of Clinical Research, Faculty of Infectious and Tropical Diseases, London School of Hygiene and Tropical Medicine, London, UK.
Received: 13 April 2015 Accepted: 11 September 2015
References
1. Cremin I, Nyamukapa C, Sherr L, Hallett TB, Chawira G, Cauchemez S, et al. Patterns of self-reported behaviour change associated with receiving voluntary counselling and testing in a longitudinal study from Manicaland, Zimbabwe. AIDS & Behavior. 2010;14(3):708–15.
2. Hallett TB, Dube S, Cremin I, Lopman B, Mahomva A, Ncube G, et al. The role of testing and counselling for HIV prevention and care in the era of scaling-up antiretroviral therapy. Epidemics. 2009;1(2):77–82.
3. Hensen B, Lewis JJ, Schaap A, Tembo M, Mutale W, Weiss HA, et al. Factors Associated with HIV-Testing and Acceptance of an Offer of Home-Based Testing by Men in Rural Zambia. AIDS Behav. 2015;19(3):492–504. 4. Venkatesh KK, Madiba P, De Bruyn G, Lurie MN, Coates TJ, Gray GE. Who
gets tested for HIV in a South African urban township? Implications for test and treat and gender-based prevention interventions. J Acquir Immune Defic Syndr. 2011;56(2):151–65.
5. Hayes R, Ayles H, Beyers N, Sabapathy K, Floyd S, Shanaube K, et al. HPTN 071 (PopART): Rationale and design of a cluster-randomised trial of the population impact of an HIV combination prevention intervention including universal testing and treatment–a study protocol for a cluster randomised trial. Trials. 2014;15:57.
6. Cawley C, Wringe A, Isingo R, Mtenga B, Clark B, Marston M, et al. Low Rates of Repeat HIV Testing Despite Increased Availability of Antiretroviral Therapy in Rural Tanzania: Findings from 2003–2010. PLoS One. 2013;8(4):e62212. 7. Huchko MJ, Montandon M, Nguti R, Bukusi EA, Cohen CR. The Association
of HIV Counseling and Testing with HIV Risk Behaviors in a Random Population-based Survey in Kisumu, Kenya. AIDS Behav. 2011;15:718–24. 8. Peltzer K, Matseke G, Mzolo T, Majaja M. Determinants of knowledge of HIV
status in South Africa: results from a population-based HIV survey. BMC Public Health. 2009;9:174.
9. Kranzer K, van Schaik N, Karmue U, Middelkoop K, Sebastian E, Lawn SD, et al. High prevalence of self-reported undiagnosed HIV despite high coverage of HIV testing: A cross-sectional population based sero-survey in South Africa. PLoS One. 2011;6(9):e25244.
10. Ng’ang’a A, Waruiru W, Ngare C, Ssempijja V, Gachuki T, Njoroge I, et al. The Status of HIV Testing and Counseling in Kenya: Results From a Nationally Representative Population-Based Survey. J Acquir Immune Defic Syndr. 2014;66 Suppl 1:S27–36.
11. Bwambale FM, Ssali SN, Byaruhanga S, Kalyango JN, Karamagi CAS. Voluntary HIV counselling and testing among men in rural western Uganda: implications for HIV prevention. BMC Public Health. 2008;8:263. 12. Gage AJ, Ali D. Factors associated with self-reported HIV testing among
men in Uganda. AIDS Care. 2005;17(2):153–65.
13. Stephenson R, Elfstrom KM, Winter A. Community Influences on Married Men’s Uptake of HIV Testing in Eight African Countries. AIDS Behav. 2012;17(7):2352–66.
14. Stringer JSA, Chisembele-Taylor A, Chibwesha CJ, Chi HF, Ayles H, Manda H, et al. Protocol-driven primary care and community linkages to improve population health in rural Zambia: the Better Health Outcomes through Mentoring and Assessment (BHOMA) project. BMC Health Serv Res. 2013;13 Suppl 2:S7. 15. Mutale W, Godfrey-Faussett P, Tembo Mwanamwenge M, Kasese N, Chintu
N, Balabanova D, et al. Measuring Health System Strengthening: Application of the Balanced Scorecard Approach to Rank the Baseline Performance of Three Rural Districts in Zambia. PLoS One. 2013;8(3):e58650.
16. Mutale W, Stringer JS, Chintu N, Chilengi R, Tembo Mwanamwenge M, Kasese N, et al. Application of Balanced Scorecard in the Evaluation of a Complex Health System Intervention: 12 Months Post Intervention Findings from the BHOMA Intervention: A Cluster Randomised Trial in Zambia. PLoS One. 2014;9(4):e93977.
17. Heckman JJ. Sample selection bias as a specification error. Economtrica. 1979;47:153–61.
18. Barnighausen T, Bor J, Wandira-Kazibwe S, Canning D. Correcting HIV Prevalence Estimates for Survey Nonparticipation Using Heckman-type Selection Models. Epidemiology. 2011;22(1):27–35.
19. Fitzsimons E, Malde B, Mesnard A, Vera-Hernandez M. Nutrition, information, and household behaviour: experimental evidence from Malawi. IFS Working Paper. 2014;14:2.
Table 6Distribution of characteristics of eligible men by selection variables (N= 5797)(Continued)
>10 164 (46.9) 151 (43.14) 35 (10.0)
Urban cluster No 2279 (48.0) 2194 (46.2) 278 (5.9) 0.55
Yes 499 (47.7) 511 (48.9) 36 (3.4)
District Kafue 993 (47.2) 980 (46.5) 133 (6.3) 0.42
Chongwe 1352 (48.1) 1318 (46.9) 140 (5.0)
Luangwa 433 (49.2) 407 (46.2) 41 (4.7)
ap
20. Hogan DR, Salomon JA, Canning D, Hammitt JK, Zaslavsky AM, Barnighausen T. National HIV prevalence estimates for sub-Saharan Africa: controlling selection bias with Heckman-type selection models. Sex Transm Infect. 2012;88:i17–23. 21. Barnighausen T, Bor J, Wandira-Kazibwe S, Canning D. Interviewer identity
as exclusion restriction in epidemiology. Epidemiology. 2011;22(3):446. 22. Warwick Z. The influence of antiretroviral therapy on the uptake of HIV
testing in Tutume. Botswana Int J STD AIDS. 2006;17(7):479–81.
23. Gari S, Malungo JRS, Martin-Hilber A, Musheke M, Schindler C, Merten S. HIV Testing and Tolerance to Gender Based Violence: A Cross-Sectional Study in Zambia. PLoS One. 2013;8(8):e71922.
24. The Zambian Ministry of Health and National AIDS Council. National Protocol Guidelines. Integrated Prevention of Mother-to-Child Transmission of HIV/AIDS. Lusaka, Zambia, 2007.
25. Msuya SE, Mbizvo EM, Hussain A, Uriyo J, Sam NE, Stray-Pedersen B. Low male partner participation in antenatal HIV counselling and testing in northern Tanzania: implications for preventive programs. AIDS Care. 2008;20(6):700–9.
26. Curran K, Baeten JM, Coates TJ, Kurth A, Mugo NR, Celum C. HIV-1 Prevention for HIV-1 Serodiscordant Couples. Curr HIV/AIDS Rep. 2012;9(2):160–70. 27. Dunkle KL, Stephenson R, Karita E, Chomba E, Kayitenkore K, Vwalika C, et al.
New heterosexually transmitted HIV infections in married or cohabiting couples in urban Zambia and Rwanda: an analysis of survey and clinical data. Lancet. 2008;371(9631):2183–91.
28. Hensen B, Taoka S, Lewis JJ, Weiss H, Hargreaves J. Systematic review of strategies to increase men's HIV-testing in sub-Saharan Africa. AIDS. 2014;28(14):2133–45.
29. Corbett EL, Dauya E, Matambo R, Cheung YB, Makamure B, Bassett MT, et al. Uptake of workplace HIV counselling and testing: a cluster-randomised trial in Zimbabwe. PLoS Medicine / Public Library of Science. 2006;3(7):e238. 30. Skovdal M, Campbell C, Madanhire C, Mupambireyi Z, Nyamukapa C,
Gregson S. Masculinity as a barrier to men's use of HIV services in Zimbabwe. Glob Health. 2011;7:13.
31. Aarnio P, Aarnio P, Olsson P, Chimbiri A, Kulmala T. Male involvement in antenatal HIV counseling and testing: exploring men’s perceptions in rural Malawi. AIDS Care. 2009;21(12):1537–46.
32. Hoffman S, Wu Y, Lahuerta M, Kulkarni SG, Nuwagaba-Biribonwoha H, El Sadr W, et al. Advanced disease at enrollment in HIV care in four sub-Saharan African countries: change from 2006 to 2011 and multilevel predictors in 2011. AIDS. 2014;28:2429–38.
33. Regan S, Losina E, Chetty S, Giddy J, Walensky RP, Ross D, et al. Factors Associated with Self-Reported Repeat HIV Testing after a Negative Result in Durban, South Africa. PLoS ONE. 2013;8(4):e62362. 34. Sherr L, Lopman B, Kakowa M, Dube S, Chawira G, Nyamukapa C, et al.
Voluntary counselling and testing: uptake, impact on sexual behaviour, and HIV incidence in a rural Zimbabwean cohort. AIDS. 2007;21(7):851–60. 35. Isingo R, Wringe A, Todd J, Urassa M, Mbata D, Maiseli G, et al. Trends in the
uptake of voluntary counselling and testing for HIV in rural Tanzania in the context of the scale up of antiretroviral therapy. Tropical Med Int Health. 2012;17(8):E15–25.
36. World Health Organization. Service Delivery Approaches to HIV Testing and Counselling (HTC): a Strategic HTC Policy Framework. Geneva, 2012. 37. Fonner VA, Denison J, Kennedy CE, O’Reilly K, Sweat M. Voluntary counseling
and testing (VCT) for changing HIV-related risk behavior in developing countries. Cochrane Database Syst Rev. 2012;9:CD001224-CD.
38. Helleringer S, Kohler HP, Frimpong JA, Mkandawire J. Increasing uptake of HIV testing and counseling among the poorest in sub-Saharan countries through home-based service provision. J Acquir Immune Defic Syndr. 2009;51(2):185–93.
39. Mutale W, Michelo C, Jurgensen M, Fylkesnes K. Home-based voluntary HIV counselling and testing found highly acceptable and to reduce inequalities. BMC Public Health. 2010;10:347.
40. Sabapathy K, van den Bergh R, Fidler S, Hayes R, Ford N. Uptake of Home-Based Voluntary HIV Testing in Sub-Saharan Africa: A Systematic Review and Meta-Analysis. PLoS Med. 2012;9:12.
41. Obermeyer CM, Osborn M. The Utilization of Testing and Counseling for HIV: A Review of the Social and Behavioral Evidence. Am J Public Health. 2007;97(10):1762–74.
42. Dovel K, Yeatman S, Watkins S, Poulin M. Men’s heightened risk of AIDS-related death: the legacy of gendered HIV testing and treatment strategies. AIDS. 2015;29(10):1123–5.
43. Nglazi MD, van Schaik N, Kranzer K, Lawn SD, Wood R, Bekker L-G. An incentivized HIV counseling and testing program targeting hard-to-reach unemployed men in Cape Town, South Africa. JAIDS. 2012;59(3):e28–34. 44. Choko AT, Desmond N, Webb EL, Chavula K, Napierala-Mavedzenge S,
Gaydos CA, et al. The uptake and accuracy of oral kits for HIV self-testing in high HIV prevalence setting: a cross-sectional feasibility study in Blantyre, Malawi. PLoS Med. 2011;8:10.
45. Lee R, Cui RR, Muessig KE, Thirumurthy H, Tucker JD. Incentivizing HIV/STI Testing: A Systematic Review of the Literature. AIDS Behav. 2014;18:905–12. 46. Johnson C, Baggaley R, Forsythe S, Van Rooyen H, Ford N, Napierala
Mavedzenge S, et al. Realizing the Potential for HIV Self-Testing. AIDS Behav. 2014;18:S1.
47. Kranzer K, Govindasamy D, van Schaik N, Thebus E, Davies N, Zimmermann MA, et al. Incentivized recruitment of a population sample to a mobile HIV testing service increases the yield of newly diagnosed cases, including those in need of antiretroviral therapy. HIV Medicine. 2012;13(2):132–7.
Submit your next manuscript to BioMed Central and take full advantage of:
• Convenient online submission
• Thorough peer review
• No space constraints or color figure charges
• Immediate publication on acceptance
• Inclusion in PubMed, CAS, Scopus and Google Scholar
• Research which is freely available for redistribution