Abstract
Introduction
Cyanobacteria pose a threat to ecosystem health and human health worldwide. High nutrient inputs can fuel the explosive growth of cyanobacteria, spurring the formation of
cyanobacterial blooms (Paerl et al. 2011). Increases in cyanobacterial dominance and abundance could be deleterious to the ecosystems they inhabit. Paerl and Huisman (2009) state that
cyanobacteria blooms are a threat to the ecological integrity and sustainability of water bodies. Blooms can play a key role in the eutrophication of water bodies, cause hypoxia in waters following the decomposition of the bloom material, and smother the underlying aquatic system with the thick mats that form during blooms. Blooms can cause cause light limitation and the death of competing phytoplankton species and rooted aquatic vegetation. Cyanobacteria are often of low food preference for herbivores when compared to other phytoplankton (Paerl and Paul 2011; Paerl 1996). An increase in cyanobacterial dominance in total phytoplankton biomass will lead to poor energy flow up the trophic levels because of the low palatability of cyanobacteria for zooplankton (Elliot 2011). This could adversely affect ecosystem function, and can lead to decreased diversity (Huisman et al. 2005).
Some species of cyanobacteria produce harmful secondary metabolites that are toxic and make them unpalatable to grazers (Codd 1995). These toxins also have complications for human health, and ingesting them can result in liver damage, tumor promotion, gastroenteritis, sodium channel blockage, and neurotoxic effects. If cyanobacterial toxins contaminate drinking water supplies, they can be difficult and costly to remove (Hitzfeld et al. 2000). Illnesses attributed to cyanobacterial toxins have been documented on all continents except Antarctica (Chorus and Bartram 1999). These toxins impact estuarine systems, as well: toxins can accumulate in the tissues of the consumers of phytoplankton, such as zooplankton and fish. Many of species of fish spend some part of their life cycle in estuaries. Additionally, toxic freshwater cyanobacteria that are transported into estuaries may succumb to salt stress and lyse, releasing intra-cellular toxins into the surrounding waters.
The worldwide alterations wrought by a changing climate highlight the susceptibility of estuarine systems and the adaptability of cyanobacteria to successfully capitalize upon these changes. Estuaries contain a delicate balance of dichotomies – like salt water and fresh water, and N-limitation and P-limitation – that could be altered by climatic changes. As drought conditions increase in frequency and severity worldwide, more saline conditions are likely to occur in estuaries because of decreased freshwater input from rivers and higher rates of evaporation (Paerl and Paul 2011). Reports of blooms in brackish waters are on the rise (Paerl and Huisman 2009), and changing environmental conditions create a great potential for the resilient genetic diversity of cyanobacterial assemblages to emerge (Yannarell et al. 2006). Billions of years of evolution have equipped cyanobacteria with a wide array of adaptive features and a vast genetic potential for continued adaptation to environmental changes (Schopf 2000). Cyanobacteria are well-adapted to a wide variety of conditions and are likely to have a
competitive advantage as the climate continues to change in coming years (Paerl and Huisman 2009; Paerl et al. 2011; Posch et al. 2012). At temperatures above 25° C, cyanobacteria have been shown to competitively dominate eukaryotic algae (Paerl et al. 2011). Some cyanobacteria genera are capable of forming gas vesicles, giving them a buoyant advantage to adjust to optimal irradiance, particularly under vertically-stratified conditions (Reynolds 1987; Huisman et al. 2004; Posch et al. 2012). The physical presence of surface blooms can also shade out competing phytoplankton. Cyanotoxins may also have allelopathic effects, inhibiting the growth of other organisms, including macrophytes (Pflugmacher 2002).
The combination of nutrient-enhanced bloom potentials in estuaries, coupled with the ability of cyanobacteria to outcompete other phytoplankton in a warmer world, spotlights estuaries as an area of increasing concern in terms of ecological and human health. Knowledge of how nuisance bloom-forming species react to salt is vital to fully understand their invasive potential and to take measures to prevent the spread of harmful freshwater species into estuaries (Paerl 1996). This study examines the salinity tolerance of two nuisance genera, the nitrogen-fixing Anabaena oscillarioides and the non-nitrogen-fixing Microcystis aeruginosa.
Methods
Cultures utilized were Anabaena oscillarioides, originally isolated from the Waikato River, New Zealand (Lam 1977) and since then maintained in the Paerl Lab at the UNC-CH Institute of Marine Sciences, and the UTEX LB 2386 strain of Microcystis aeruginosa, isolated from Little Rideau Lake, Ontario, Canada. Cultures were non-axenic. A. oscillarioides cultures and experimental flasks were maintained on a grow table with 3 Grow-Lux lights and 1 Warm White light, in a light-dark cycle of 12 h:12 h. Light levels on the growth table were from 40 to 48 μmolm-2
s-1, measured with a LI-COR model LI 193SA spherical quantum sensor. The
White light, with light levels in the incubator ranging from 57 to 70 μmolm-2s-1,measured with a Biospherical Instruments Inc. model QSL 2100 light meter and Logger 2100 software. Flasks for both species were swirled daily to maintain oxygenation and keep cells in suspension. Three replicate Erlenmeyer flasks for each treatment were prepared to a final volume of 50 mL for all experimental runs. Additions of salt were made from a 100 g/L NaCl concentrated stock solution. For pulse runs, the final concentration of salt was added in one dose on Day 0. For gradual runs, salt was added in four equal doses at the same time of day on Days 0 to 3. Labels refer to the final concentration for each treatment. For the gradual runs, see Table 1 for daily salt addition volumes.
In vivo fluorescence of Anabaena oscillarioides was measured under subdued lighting with a Turner Designs Trilogy fluorometer (Turner Designs, Sunnyvale, CA, USA), Trilogy module CHL-A NA, calibrated with deionized water as a blank and a solid secondary standard.
In vivo fluorescence for Microcystis aeruginosa was measured under subdued lighting with a Turner Designs TD700 fluorometer (Turner Designs, Sunnyvale, CA, USA) using specific filters for a Chl-a with a mercury vapor lamp light source, and calibrated with deionized water as a blank and with two solid secondary standards. Readings were recorded in μg/L, though this does not represent the true concentration of chlorophyll. Deionized water proved to be a good
reference for the fluorescence of the media for both types of cyanobacteria. Flasks were swirled before each sampling time for even distribution of sample. A 2-mL subsample was sacrificed from each A. oscillarioides flask at each sample time and pipetted into a test tube for
fluorometric measurements. A 2.2-mL subsample was used for M. aeruginosa. Unless otherwise stated, measurements of fluorescence were made using this protocol.
Results
Salt additions had a significant effect on all Pulse and Gradual treatments for both
Anabaena oscillarioides and Microcystis aeruginosa. All p-values from the single-factor ANOVAs performed from each experiment were highly significant and less than 0.001.
Groupings for the Tukey-Kramer Honest Significant Difference post-hoc analysis can be found in Tables 2 and 3.
The in vivo method of fluorescence measurement was determined to be a good proxy for extraction readings, though it would best be used in comparative rather than quantitative studies (Figure 1). For in vivo readings of less than 21 μg/L, there was a linear correlation between the extraction values and the in vivo readings with a correlation coefficient of r = 0.827633517, and a linear regression with an r2 value of 0.685. Above 21 μg/L in vivo fluorescence reading, this correlation becomes skewed, indicating that the relationship might vary exponentially or inconsistently beyond this value. This would likely be due to quenching of the light by the high concentration of chlorophyll-a in solution.
Figure 1 – Graph showing the correlation between in vivo fluorescence measurements and chlorophyll a
concentrations found with the in vitro extraction method, both in μg/L. Trendline shown for in vivo measurements below 21 μg/L.
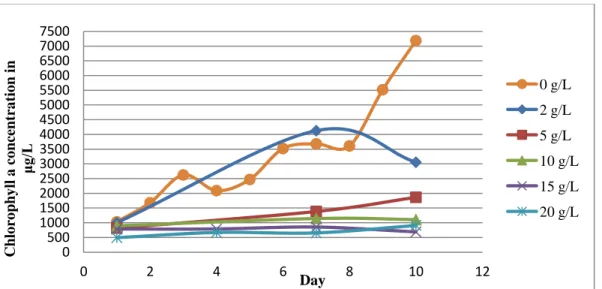
For the Anabaena oscillarioides pulse run, salt additions had a significant effect on the average growth rate at Day 8 with a p-value of <0.001 from a single-factor ANOVA. Groups were then compared with a Tukey-Kramer post-hoc analysis. The 0 g/L, 2 g/L, and 5 g/L treatments all increased in fluorescence up to Day 8 and were not significantly different from each other (Figure 2). The 10 g/L, 15 g/L, and 20 g/L treatments all declined in fluorescence, with a small upturn in the growth of the 10 g/L treatment toward the end of the experiment. The 10 g/L and 15 g/L treatments were not significantly different from each other, while both were significantly different from the 20 g/L treatment.
0 500 1000 1500 2000 2500 3000 3500 4000 4500
0 10 20 30
Chlo
ro
ph
y
ll
a
co
ncent
ra
tio
n
μ
g
/L
In vivo Fluorsecence in μg/L
< 21 μg/L in vivo
Figure 2 – In vivo fluorescence measured daily for the pulse run of Anabaena oscillarioides in μg/L of chlorophyll a. Error bars show standard error, and some are too small to be seen.
For the A. oscillarioides Gradual run, salt additions were shown to have a significant effect on the average growth rate at Day 8 with a p-value of <0.001 from a single-factor
ANOVA. The in vivo method was deemed not to be a good proxy for fluorescence for the 0 g/L treatment due to the variability of the measurements and the intense aggregation of filaments (Figure 3). The 0 g/L, 2 g/L, and 5 g/L treatments increased in fluorescence over the course of 10 days. While the 10 g/L, 15 g/L, and 20 g/L treatments increased in fluorescence during the days of the salt additions, once the final concentration was reached growth could not be maintained and die-off occurred, resulting in an overall negative growth rate for the 15 g/L and 20 g/L, and a growth rate of approximately 0 μg/L/day for the 10 g/L treatment. The in vivo measurements of the 0 g/L treatment were not included in the ANOVA or the Tukey-Kramer post-hoc analysis because they were not considered reliable. The 2 g/L and 5 g/L treatments were not significantly different from each other, while they were significantly different from the 10 g/L, 15 g/L, and 20 g/L, which were all significantly different from each other. Extractions were performed for all sample groups over the course of the A. oscillarioides gradual run, with at least three extraction values per run for all treatments (Figure 4).
0 5 10 15 20 25
0 2 4 6 8 10
μg
/L
Day
Figure 3 - In vivo fluorescence measured daily for the gradual run of Anabaena oscillarioides in μg/L of chlorophyll a. Error bars represent standard error, and some are too small to be seen.
Figure 4 - Chlorophyll a concentration determined viaextraction method of the A. oscillarioides gradual run in μg/L.
For Microcystis aeruginosa, pulse salt additions were found to have a significant effect on the average growth rate at Day 7 with a p-value of <0.001 from a single-factor ANOVA. The 0 g/L and the 2 g/L treatments increased in fluorescence over the course of 7 days, while all other treatments decreased in fluorescence and approached zero (Figure 5). In a Tukey-Kramer Honest Significant Difference test, the 0 g/L and the 2 g/L treatments were significantly different
0 5 10 15 20 25 30
0 2 4 6 8 10
μg /L Day 0 g/L 2 g/L 5 g/L 10 g/L 15 g/L 20 g/L 0 500 1000 1500 2000 2500 3000 3500 4000 4500 5000 5500 6000 6500 7000 7500
0 2 4 6 8 10 12
from each other, and were both significantly different from the similar group of 5 g/L, 10 g/L, 15 g/L, and 20 g/L.
Figure 5 - In vivo fluorescence measured daily for the pulse run of Microcystis aeruginosa in μg/L of chlorophyll a.
Error bars show standard error, and some are too small to be seen.
With gradual salt additions, salinity was shown to have a significant effect on the average growth rate at Day 7 of Microcystis aeruginosa, with a p-value of <0.001 from a single-factor ANOVA. The 0 g/L, 2 g/L, and 5 g/L treatments all showed positive rates of growth and increasing fluorescence, while the 10 g/L, 15 g/L, and 20 g/L treatments all decreased in
fluorescence (Figure 6). This is in contrast to the pulse experiment, where only the 0 g/L and the 2 g/L treatments exhibited positive growth. In a Tukey-Kramer Honest Significant Difference test, the 2 g/L treatment was significantly different from the similar group containing the 0 g/L and 5 g/L treatment, which were both significantly different from the similar group of 10 g/L, 15 g/L, and 20 g/L.
0 2 4 6 8 10 12 14 16 18
0 1 2 3 4 5 6 7 8
μg
/L
Day
0 g/L
2 g/L
5 g/L
10 g/L
15 g/L
Figure 6 - In vivo fluorescence measured daily for the gradual run of Microcystis aeruginosa in μg/L of chlorophyll a. Error bars represent standard error, and some are too small to be seen.
Discussion
Anabaena oscillarioides exhibited a 10 g/L threshold of salt tolerance above which it could no longer grow. For both the pulse and the gradual treatments, this threshold could not be overcome, and resulted in a decrease in fluorescence for concentrations higher than 10 g/L, and subsistence at 10 g/L. Zhao and He (1999) observed A. oscillarioides in Lake Kulun in North Hebei, China at a salinity of 10.5 g/L (see Table 4 for a comparison of the findings of this experiment to the results of previous studies). Moisander et al. (2002) found that another
Anabaena species, A. aphanizomenoides was able maintain growth in an experimental setting at salinities up to 15 g/L, a higher concentration than this experiment showed for A. oscillarioides. However, A. aphanizomenoides is not found at these salinities in the Neuse River Estuary, where the culture was isolated from. This indicates that salinity is not a restriction for the expansion of this particular species into estuaries, and this may hold true for other cyanobacteria species as well. Coutinho and Seeliger (1984) found A. oscillarioides at a sample site with salinities ranging from 7 g/L to 15 g/L in the Patos Lagoon estuary in Brazil, though the specific salinity at which
A. oscillarioides was observed was not given. In my experiments, 15 g/L produced significant die-off for A. oscillarioides, implying that strain variability within a species may produce a range of salinity tolerances. Longer-term studies with a narrower range of salinities around 10 g/L may better serve to elucidate the exact threshold as well as levels of tolerance and hence the adaptive potential of A. oscillarioides.
Microcystis aeruginosa shows a differential response to salt depending on the method of exposure. For immediate salt-shock conditions, this experiment showed that there is substantial die-off above 2 g/L. However, when salt is added more gradually, M. aeruginosa can
0 2 4 6 8 10 12 14 16
0 2 4 6 8
μg
/L
Day
0 g/L
2 g/L
5 g/L
10 g/L
15 g/L
survive at salinities of 5 g/L, and likely has a threshold between 5 g/L and 10 g/L. This
difference in response to salt based on rate of exposure shows that M. aeruginosa could have a high adaptive capacity if gradually exposed to increasing salinities.
Orr et al. (2004) found that M. aeruginosa cultures were able to grow at salt
concentrations up to 9.8 g/L within the time span of 20 hours. Tonk et al. (2007) observed that
M. aeruginosa (strain PCC 7806) growth was not affected by salinity levels up to 10 g/L, but it collapsed when exposed to concentrations above 10 g/L for several weeks. In contrast to these findings, this experiment showed a significant impact on the growth rate of M. aeruginosa within the range of 0 g/L to 10 g/L, even at concentrations as low as 2 g/L. The salt shock experiments by Tonk et al. showed that even when exposed to 10 g/L of salt with no acclimatization period (analogous to my pulse experiments), growth rates for M. aeruginosa recovered within a week. For my pulse experiments, the 10 g/L treatment showed no signs of a recovery in growth rate and was still declining in fluorescence. Tonk et al. also found that M. aeruginosa could withstand salinities up to 17.5 g/L for nine days.
Atkins et al. (2001) observed that a Microcystis aeruginosa bloom in the Swan River in Australia collapsed after exposure to salinities above 10 g/L. Sellner et al. (1988) found that in the Potomac River, M. aergusinosa lost photosynthetic ability and declined in cell concentration after exposure to salinities as low as 1 to 2 g/L. Otsuka et al. (1999) found that one Japanese strain of M. aeruginosa could persist at up to 7 g/L salt concentration. There is no conclusive agreement about the threshold of salinity tolerance for M. aeruginosa, for either pulse or gradual exposures. Otsuka et al. (1999) found that different strains of Microcystis sp. had differing salinity tolerances that did not correspond to the species distinctions. For Otsuka et al.’s (1999) experiments, the two strains that showed the highest salinity tolerance did not belong to the same species. This supports the conclusion that salinity tolerance can be highly variable even between strains of the same species, and that any establishment of a threshold would likely be strain-specific.
The results of this experiment show that some species that have traditionally been labeled as “freshwater” could potentially play a role in estuarine cyanobacterial communities. In these experiments, Anabaena oscillarioides demonstrated the ability to subsist at about 1/3 of the salt (as NaCl) concentration of ocean water. This creates a potentially large invasion area for
brackish estuarine and coastal systems, in which these cyanobacteria may be able to proliferate. Salinity is not the only factor governing cyanobacterial expansion, and a wide range of
environmental variables (such as temperature, nutrient and light availability, and turbulent mixing) may explain why we do not currently see many freshwater species inhabiting estuaries in large numbers (N. Hall, Pers. Comm.) (c.f., Paerl 1990). As seen in the Microcystis
species to take hold and proliferate. Nature is incredibly adaptive and resilient, and billions of years of evolution have given cyanobacteria a great genetic potential for survival and persistence in the face of extreme climatic changes.
Tables
Table 1 – Daily salt addition volumes for Gradual treatments Treatment Initial amount of
culture
Salt addition volume per day
0 g/L 50 mL 0 mL
2 g/L 49 mL .25 mL
5 g/L 47.5 mL .625 mL
10 g/L 45 mL 1.25 mL
15 g/L 42.5 mL 1.875 mL
20 g/L 40 mL 2.5 mL
Table 2 – Groupings from Tukey-Kramer Honest Significant Difference post-hoc analysis for
Anabaena oscillarioides. The 0 g/L treatment of the Gradual Addition was not included in the analysis because its fluorescence measurements were not considered to be reliable.
Treatment Pulse Addition Gradual Addition
0 g/L A ----
2 g/L A A
5 g/L A A
10 g/L B B
15 g/L B C
20 g/L C D
Table 3 - Groupings from Tukey-Kramer Honest Significant Difference post-hoc analysis for
Microcystis aeruginosa.
Treatment Pulse Addition Gradual Addition
0 g/L A A
2 g/L B B
5 g/L C A
10 g/L C C
15 g/L C C
Table 4 – Comparison of the findings of this experiment with other studies. Author Year Species Studied Results of Previous
Study
Findings of this Experiment
Moisander et al. 2002 Anabaena
aphanizomenoides
Growth maintained at up to 15 g/L
A. oscillarioides
has a growth threshold of 10
g/L Zhao and He 1999 A. oscillarioides Found at 10.5 g/L
Tonk et al. 2007 Microcystis
aeruginosa
Not affected by up to 10 g/L
With pulse salt additions, M. aeruginosa can Exposure to >10 g/L
for weeks yields a collapse in growth rates
Zero-growth threshold is likely between Growth can continue
for 9 days at 17.5 g/L
2 g/L and 5 g/L Orr et al. 2004 Microcystis
aeruginosa
No cell lysis for 20 hours at 9.8 g/L
With gradual salt additions, Atkins et al. 2001 Microcystis
aeruginosa
Bloom observed to collapse at 10 g/L
M. aeruginosa
can grow at 5 g/L
Otsuka et al. 1999 Microcystis
aeruginosa
Strains of Microcystis sp. have differing salinity tolerances that did not correspond with
species distinctions
Zero-growth threshold is likely between 5
g/L and 10 g/L One M. aeruginosa
strain survived at 7 g/L
M. aeruginosa
shows adaptive Sellner et al. 1988 Microcystis
aeruginosa
Loss of photosynthetic ability at 1-2 g/L
potential for salinity
Acknowledgements
References
Arar, E.J., W.L. Budde, and T.D. Behymer. 1997. Methods for the determination of chemical substances in marine and environmental matrices. EPA/600/R-97/072. Cincinnati: National Exposure Research Laboratory, US Environmental Protection Agency.
Atkins, R., Rose, T., Brown, R. S., and Robb, M. 2001. The Microcystis cyanobacteria bloom in the Swan River – February 2000. Water Science and Technology. 43(9): 107-114. Chorus, I., and Bartram, J. 1999. Toxic Cyanobacteria in Water. A Guide to Their Public Health
Consequences, Monitoring and Management. Geneva: World Health Organization. Codd, G. A. 1995. Cyanobacterial Toxins: Occurrence, Properties, and Biological Significance.
Water Science and Technology. 32(4): 149-156.
Coutinho, R. and Seeliger, U. 1984. The horizontal distribution of the benthic algal flora in the Patos Lagoon estuary, Brazil, in relation to salinity, substratum and wave exposure.
Journal of Experimental Marine Biology and Ecology. 80(3): 247–257.
Elliot, J. Alex. 2011. Is the future blue-green? A review of the current model predictions of how climate change could affect pelagic freshwater cyanobacteria. Water Research.
46(2012): 1364-1371.
Hitzfeld, B. C., Höger, S. J., and Dietrich, D. R. 2000. Cyanobacterial Toxins: Removal during Drinking Water Treatment and Human Risk Assessment. Environmental Health
Perspectives. 108(1): 113 – 122.
Huisman, J., Sharples, J., Stroom, J., Visser, P. M., Kardinaal, W. E. A., Verspagen, J. M. H., et al. 2004. Changes in turbulent mixing shift competition for light between phytoplankton species. Ecology. 85:2960–70.
Huisman, J.M., Matthijs, H.C.P., Visser, P.M. 2005. Harmful cyanobacteria. Springer Aquatic Ecology Series 3. Springer, Dordrecht, The Netherlands, 243p.
Moisander, P. H., McClinton III, E., and Paerl, H. W. 2002. Salinity Effects on Growth, Photosynthetic Parameters, and Nitrogenase Activity in Estuarine Planktonic Cyanobacteria. Microbial Ecology. 43: 432-442.
Otsuka, S., Suda, S., Li, R., Watanabe, M., Oyaizu, H., Matsumoto, S., Watanabe, Makoto M.. 1999. Characterization of morphospecies and strains of the genus Microcystis
(Cyanobacteria) for a reconsideration of species classification. Phycological Research.
47: 189–197.
Paerl, H. W. 1990. Physiological ecology and regulation of N2 fixation in natural waters. Advances in Microbial Ecology 11:305-344.
Paerl, H. W. 1996. A comparison of cyanobacterial bloom dynamics in freshwater, estuarine, and marine environments. Phycologia. 35 (Supplement 6): 25-35.
Paerl, H. W. 2009. Controlling Eutrophication along the Freshwater–Marine Continuum: Dual Nutrient (N and P) Reductions are Essential. Estuaries and Coasts. 32:593-601.
Paerl, H. W., Hall, N. S., and Calandrino, E. S. 2011. Controlling harmful cyanobacterial blooms in a world experiencing anthropogenic and climatic-induced change. Science of the Total Environment. 409: 1739-1745.
Paerl, H. W. and Huisman, J. 2009. Climate change: a catalyst for global expansion of harmful cyanobacterial blooms. Environmental Microbiology Reports. 1(1): 27-37.
Paerl, H. W. and Paul, V. J. 2011. Climate change: Links to global expansion of harmful Cyanobacteria. Water Research. 46(2012): 1349-1363.
Pflugmacher, Stephan. 2002. Possible allelopathic effects of cyanotoxins, with reference to microcystin-LR, in aquatic ecosystems. Environmental Toxicology. 17(4): 407-413. Posch, T., Köster, O., Salcher, M. M., and Pernthaler, J. 2012. Harmful filamentous
cyanobacteria favoured by reduced water turnover with lake warming. Nature Climate Change. 2: 809-813.
Reynolds, C. S. 1987. Cyanobacterial water blooms. Advances in Botanical Research. 13: 67-143.
Schopf, J.W. 2000. The fossil record: tracing the roots of the cyanobacterial lineage. The Ecology of Cyanobacteria. Whitton, B.A., and Potts, M. (eds). Dordrecht, the Netherlands: Kluwer Academic Publishers, p 13–35.
Sellner, K.G., Lacouture, R.V., Parrish, C.R. 1988. Effects of increasing salinity on a cyanobacteria bloom in the Potomac River estuary. Journal of Plankton Research.
10 (l): 49-61.
Welschmeyer, N.A. 1994. Fluorometric analysis of chlorophyll a in the presence of chlorophyll b and pheopigments. Limnology and Oceanography 39: 1985–1992.
Yannarell, A. C., Steppe, T. F., and Paerl, H. W. 2006. Disturbance and recovery of microbial community structure and function following Hurricane Frances. Environmental Microbiology. 9(3): 576-583.