Paper for the M.S. in I.S. degree. April, 2012. 86 pages. Advisor: Jane Greenberg
This thesis reports the results of a survey of entomologists assessing the utility of different ways to present entomological collections online. Respondents viewed real-world examples of three different digitization techniques—detailed images of individual specimens, a database of label information, and detailed images of entire drawers of specimens—and rated the usefulness of each for a variety of purposes. The survey also collected information on respondents’ use of print and online resources, the online resources they use most frequently, and the features and resources most wanted in online resources. Respondents rated drawer images least useful for entomological research, but still useful, and nearly as useful, or more useful, than the other two methods for informing loan
requests, education, and outreach. Drawer images also appeared useful for specimen identification. Although significant issues remain, relatively quick and inexpensive digitization methods such as drawer images can be useful for
entomological collections.
Headings:
Surveys -- Internet resources.
by
Babi A. Hammond
A Master’s paper submitted to the faculty of the School of Information and Library Science of the University of North Carolina at Chapel Hill
in partial fulfillment of the requirements for the degree of Master of Science in
Information Science.
Chapel Hill, North Carolina April 2012
Approved by
Table of Contents
Introduction ...2
Background & Objective ...7
Methods ...12
Development and Distribution of the Survey ... 12
Main Comparison Questions ... 13
Identification Task ... 18
Limitations of the Study ... 20
Results and Discussion ...23
Characteristics of Those Who Completed the Survey ... 23
Research Specialties ... 24
Institutional Affiliations ... 25
Insect Order Specialties ... 26
Age of Respondents ... 27
Geographical Distribution of Respondents ... 28
Use of Entomological Collections and Online Resources ... 30
Comparison of Online Presentation Methods ... 35
Comparison of Presentation Methods For Different Purposes ... 37
Comparison of Responses by Order Specialties ... 39
Differences Among Responses By Geographic Location ... 41
Desired Features in Hypothetical Presentation Methods ... 43
ID task performance ... 46
Conclusions ...48
Works Cited ...52
Appendix 1: Full Text and Results of Online Survey ...54
Introduction
The hundreds of millions of specimens in natural history collections around the world hold a wealth of information about the current state and history of life on earth. Digitizing these collections can vastly expand researcher access to these indispensable resources, and facilitate new insights through aggregation of data within and across collections. Important digitization efforts are underway, but progress is slow. The resources available for digitization are far outweighed by size of the collections to be digitized. Digitization at the specimen level is expensive and labor-intensive, but very few institutions have examined simpler means of digitizing their collections.
In 2011, the National Science Foundation launched a $10 million, 10-year program to fund the digitization of the nation’s biological collections.1 These
collections—stuffed birds and mammals, snakes and fish preserved in jars of alcohol, leaves and lichens pressed between sheets of paper, and numerous other kinds of specimens—constitute an invaluable record of the world’s biodiversity, and are essential resources for many natural sciences. The 2011 digitization effort is one of the latest to help bring the unique information about the natural world contained in hundreds, if not thousands, of museums into the digital age. Older
1 Advancing Digitization of Biological Collections (ADBC), NSF 11-567,
efforts, including the Global Biodiversity Informatics Foundation (GBIF) and the Taxonomic Databases Working Group (TDWG), focus on developing
standards for databases of biological information, from gene sequences to species catalogs. The goal of these efforts is to make the world’s biological data available online, in easily searchable and usable access systems.
One of the largest programs funded by the digitization effort is a regional consortium of Midwestern institutions to create Invernet, an online virtual museum of biological specimens.2
The program will use an innovative imaging technology to help speed the delivery of online content. Rather than
painstakingly photographing single specimens, entire drawers of specimens will be photographed at one time, with many high-resolution images stitched
together in a Google Earth-like interface. Users will be able to pan and zoom into the image to reveal the details they are more interested in.
Will this system—and others like it—result in resources useful to the scientists who rely on collections for their research? Can less expensive and faster digitization methods, like drawer images, meet the needs of researchers as well as more traditional (and more expensive) methods of digitization, such as imaging single specimens and transcribing label data? If faster, cheaper
digitization methods are not as useful as more elaborate systems, are they still useful enough to justify the time and money their development will consume? These are the principle questions this study addresses.
Although the Invertnet initiative will be the largest effort to date to use drawer imaging technology to digitize biological collections, it is not the only
such effort, nor the oldest. The NCSU Insect Museum adopted such an
approach to digitizing their collection of some 1.5 million specimens by taking high-resolution photographs of entire drawers of specimens and posting the images online.3 The GigaPan system allows users to virtually browse the
collection and to add annotated "snapshots" of image details. These snapshots are visible to other users, thus not only can users gain information from the Museum, they can also add information and interact with other users. Museum staff hypothesize that the GigaPan images will result in better informed loan requests and increased interest in donations, curation advice from expert users, and increased public engagement with the collections.4
Early results have been promising, but a comprehensive analysis of the value of the mass digitization effort, and ways to maximize its usefulness to researchers and the institution, remains to be done.
This thesis reports the results of an online survey of entomologists to examine the utility of relatively simple mass digitization techniques such as the GigaPan system for entomological research and other purposes. My hypothesis is that while such techniques might not be ideal for all kinds of research, their benefits can be substantial for many researchers and curators. The adoption of such techniques could make entomological collections available online much more rapidly, and at much lower cost, than is achievable through specimen-level digitization.
3 http://www.gigapan.org/profiles/23796/
4 Matthew A. Bertone, and Andrew R. Deans. "Remote Curation and Outreach: Examples from
This study was prompted by discussions with staff at the NCSU Insect Museum, where I served an internship in the summer of 2011. The museum staff would like to improve the GigaPan project, but do not know whether the benefits of those improvements will be worth the time and expense of implementing them. This study was designed to, first, help them prioritize their efforts, whether they be in revising the GigaPan system, or concentrating resources on other means of digitization. But the study also gathers wider information about the use of various online resources by entomologists, and examines how the needs for online resources differ among different entomological sub-disciplines, and specialists of different insect orders. The results of the study may thus have a wider relevancy for curators of entomological collections who are considering their own digitization efforts, regardless of their chosen presentation method. The study may have wider application to other types of natural history
collections, as well.
To help develop the survey, I interviewed several entomologists connected to the NCSU Insect Museum about their work, and their use of online resoucres. The interviewees had a wide range of reactions to the GigaPan system. Some believed the system was highly useful, both for their own work and for
entomological research in general. Others were more skeptical. One of the goals of the survey is to examine how various characteristics of respondents correlate with reactions to the GigaPan system, and with different needs for online resources and features. There may be a generational divide among
characteristics will be helpful to collection managers as they develop online resources. The survey also asked respondents to complete a simple identification task using the GigaPan system, and collected information about the chief
Background & Objective
Entomologists—particularly taxonomists, though others as well—depend for much of their work on an international network of large and small collections of insects. The size of these collections varies from thousands to millions of
specimens. There is no comprehensive catalog of the number of insect
collections in the world and the specimens they contain. A recent estimate of all natural history specimens put the figure at 2-3 billion, of which 40% were
entomological specimens.5 There are likely, then, at least a billion insects in the
world’s entomological collections, only a fraction of which have any representation online.
Digitization of these collections is an enormous task, and is usually carried out by individual institutions on a largely ad-hoc basis. Digitization can refer to several different techniques. In general, these fall into three categories:
transcription of specimen label information into an electronic database, digital imaging of individual specimens, and imaging of sets of specimens. The first is most common.6
A 2008 survey of collections that had received support from the National Science Foundation found that of 49 entomological collections
5 Arturo H. Arino, "Approaches to Estimating the Universe of Natural History Collections,"
Biodiversity Informatics, 7 (2010): 81-92; Table 1, p. 88.
6 Chris Dietrich, "Traditional Approaches to Collection Digitization," 2010,
responding, 13 had at least half of their collection represented in an online database. Only one had more than half of their collection represented by online images, and 46 had imaged 5% or less of their collection.7
Imaging of sets of specimens was not identified in the survey, but at least two institutions—the NCSU Insect Museum and the London Natural History Museum—have experimented with the method,8 and, as mentioned above,
Invernet is planning to use a drawer imaging system to digitize its large collection of biological specimens.9
To date, the NCSU Insect Museum has made the most extensive use of the method, and has posted online images of more than 1200 drawers of pinned specimens. This method of digitizing specimens is much faster and cheaper than specimen-level digitization. The equipment and
software necessary cost a few thousand dollars, and with minimal training staff can image a drawer and post the image online in 15 minutes. In contrast,
imaging of single specimens can take hours, and much more expensive equipment.10
Most digitization efforts emphasize databases of label information
7 Pamela Ebert Flattau, et al. "Preliminary Findings from the NSF Survey of Object-Based
Scientific Collections." Washington DC: Science and Technology Policy Institute (2008): 106-107.
8 Matthew A. Bertone, and Andrew R. Deans. "Remote Curation and Outreach: Examples from
the NCSU Insect Museum GigaPan Project." Paper presented at the Fine International Conference on Gigapixel Imaging for Science, Carnegie Mellon University, Pittsburgh, Pennsylvania, 11-13 November 2010. !Vladimir Blagoderov, Ian Kitching, Thomas Simonsen, and Vincent Smith. "Report of Trial of SatScan Tray Scanner System by SmartDrive Ltd." Nature Precedings, 2010.
9 A short announcement with links to media coverage of the digitization effort is here:
http://illinois.edu/lb/iList/518#ADBC, and the still-developing Website of the digitized collection is here: http://invertnet.dyndns.org/.
10 Jay Longson, et al. "Adapting Traditional Macro and Micro Photography for Scientific
Gigapixel Imaging." Paper presented at the Fine International Conference on Gigapixel Imaging for Science, Carnegie Mellon University, Pittsburgh, Pennsylvania, 11-13 November
and "enriched metadata" of collections rather than imaging.11 But even here,
lack of funding and staff time is hampering digitization efforts. A 2009 survey of institutions with ongoing or recent digitization efforts found that the
"overwhelming barrier to digitizing collections was a lack of funding or issues directly related to funding," including lack of staff and time.12
Entomological collections present unique challenges to digitization efforts. The storage technology for pinned specimens has evolved slowly since the 1700s, when pinned specimens with labels impaled on the pins beneath the specimen appear to have originated.13 With good preparation and curation, pinned
specimens can be preserved for research for decades, even hundreds of years. But the specimens can be very fragile, and often, important taxonomic
information is contained in body parts not readily visible without dissection. Data about individual specimens is generally not kept in a central location, such as a ledger or card file. To image a specimen in more than one axis requires removing the specimen from its drawer. Reading label information can be impossible without removing the specimen, and older specimens often have
11 Roger Baird, "Leveraging the Fullest Potential of Scientific Collections through Digitization,"
Biodiversity Informatics, 7 (2010): 130-36. Walter G. Berendsohn, Vishwas Chavan, and James Macklin, "Summary of Recommendations of the GBIF Task Group on the Global Strategy and Action Plan for the Digitisation of Natural History Collections," Biodiversity Informatics, 7 (2010): 67-71.
12 Ana Vollmar, James A. Macklin, and Linda S. Ford, "Natural History Specimen Digitization:
Challenges and Concerns," Biodiversity Informatics, 7 (2010): 93-112.
13 The history of the technology for storing insect collections is not well documented, but it
appears that pinning insects arose about as early as the first insect collections. The use of standard-sized drawers and, later, unit trays, dates from the late 19th and mid-20th centuries,
respectively. See Roger C. Smith, "The Tray System for Insect Collections," Transactions of the Kansas Academy of Science 31 (1928): 77-81a; paper delivered at 1926 meeting of the Academy; J. M. Aldrich, "The Division of Insects in the United States National Museum," Annual Report of the Board of Regents of the Smithsonian Institution, 1919: 367-379, p. 372; Henry Townes, "A
hand-written labels that can be difficult to decipher.14 Even the collection of
basic label information and the assignment of unique identifiers to specimens usually requires handling of each specimen. The technology for storing insect collections, while it was served well the needs of previous generations of entomologists, is not well suited for digitization with near-complete data capture. Digitization using traditional methods usually requires handling of thousands, sometimes millions, of individual specimens, many of which are extremely delicate.
Various methods have been proposed to help institutions prioritize digitization efforts, but this advice has been based only on discussions among collection managers. Surveys enquiring about the state of digitization efforts have been distributed to institutions and collection managers, but no research has been done on actual users of these collections. Consortia of collections have spearheaded digitization efforts, and there is a laudable impulse to make data from all collections interoperable among many domains, but little attention has been paid to the needs of domain-specific users, or to study how users interact with existing or planned resources. Researchers in information and library science have recently begun to reshape their understanding of how best to structure information systems through greater attention to user needs, and research in information behavior has shown that scientists increasingly rely on online resources, from electronic journals to Google, for their work.15 It is highly
14 Ana Vollmar, James A. Macklin, and Linda S. Ford, “Natural History Specimen Digitization:
Challenges and Concerns,” Biodiversity Informatics, 7 (2010): 106-107.
15 Xi Niu, Bradley M. Hemminger, Cory Lown, Stephanie Adams, Cecelia Brown, Allison Level,
likely that entomologists do not stand apart from other types of researchers in this regard. But information needs and interaction with information resources can be highly domain-specific.16
No study, so far as I know, has looked at specifically at entomologists and how they use online resources. Greater
attention to the needs of domain-specific users may reveal better ways to digitize collections.
Even if digitization methods like the GigaPan system are not ideal, they may be adequate for enough users to justify their costs. Certainly, if more elaborate digitization efforts have not proved feasible for most or many institutions, simpler, perhaps less ideal, methods could still increase access to collection information, and expose collections to new users, even new user groups. Archivists have recently confronted similar issues. Faced with growing backlogs of unprocessed collections, archives began adopting a "more product, less process" approach, abandoning long-held standards of archival processing in favor of more flexible, much faster, processing techniques. 17
Entomological collections—and perhaps natural history collections more generally—may have reached a similar point. A better understanding of to what extent "more product, less process" techniques can meet the needs of users is the primary goal of this study.
American Society for Information Science and Technology, 61 (2010): 869-90.
16 Jenny Fry, and Sanna Talja, "The Intellectual and Social Organization of Academic Fields and
the Shaping of Digital Resources," Journal of Information Science, 33 (2007): 115-33. !Rob Kling, Geoffrey McKim, and Adam King, "A Bit More to It: Scholarly Communication Forums as Socio-Technical Interaction Networks," Journal of the American Society for Information Science and
Technology, 54 (2003): 47-67.
17 Mark A. Greene, and Dennis Meissner, "More Product, Less Process: Revamping Traditional
Method
s
The study used an online survey to assess the utility of mass digitization techniques for entomological research, and to explore how online discovery of and access to entomological collections via simpler digitization methods might be improved. The survey asked respondents to assess the utility for their research of three different methods for presenting entomological collections online, to give general information about their use of and needs for online resources, and to attempt a simple identification task using a GigaPan image. This section discusses the development of the survey, its distribution, and possible limitations of the study.
Development and Distribution of the Survey
To develop the survey, I conducted interviews with entomologists at NCSU about their work with entomological collections, and their use of online resources. From this information, and in collaboration with staff at the NCSU Insect Museum, I drafted the survey questions and created the survey using Qualtrics online tools.18
The full survey was then pilot tested by entomologists at NCSU, and revised in response to their suggestions.
18 http://www.qualtrics.com/. Access to Qualtrics is provided by the Odum Institute at UNC,
Insect Museum staff felt that other entomologists would more likely respond to a message from one of their colleagues, rather than from an Information Science student. So, to maximize the response, the messages soliciting participation were sent from one of them, Katja Seltmann, and the message text referenced the NCSU Insect Museum and Andrew Deans’ research group at NCSU. The full text of the solicitation message is reprinted in
Appendix 2. The link to the online survey was distributed to members of the Entomological Collections Network listserv, to members of the Entomo-L listserv (the most popular general entomology listserv), and directly to some colleagues of NCSU Insect Museum staff, who were believed to be interested in the project and capable of stimulating further responses.19
Main Comparison Questions
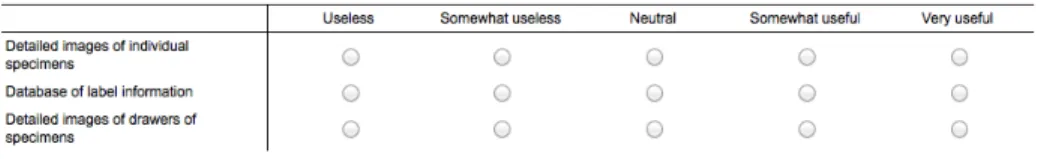
The full text of the survey can be read in Appendix 1, but let me here discuss in more depth how the survey attempts to fulfill the goals of the study. Evaluating the usefulness of relatively simple digitization systems is the primary goal of the survey. The survey presented respondents with three different ways entomological collections can be represented online: through detailed images of individual specimens; a database of label information, with few or no images; and finally the GigaPan system, representing a “more product, less process” digitization method. The survey gave respondents both a static screenshot of each system, and a link that opened the representative system in another
19 Unfortunately, the survey did not ask respondents how they had heard about the study. This
window. A screenshot of the question and accompanying images as they
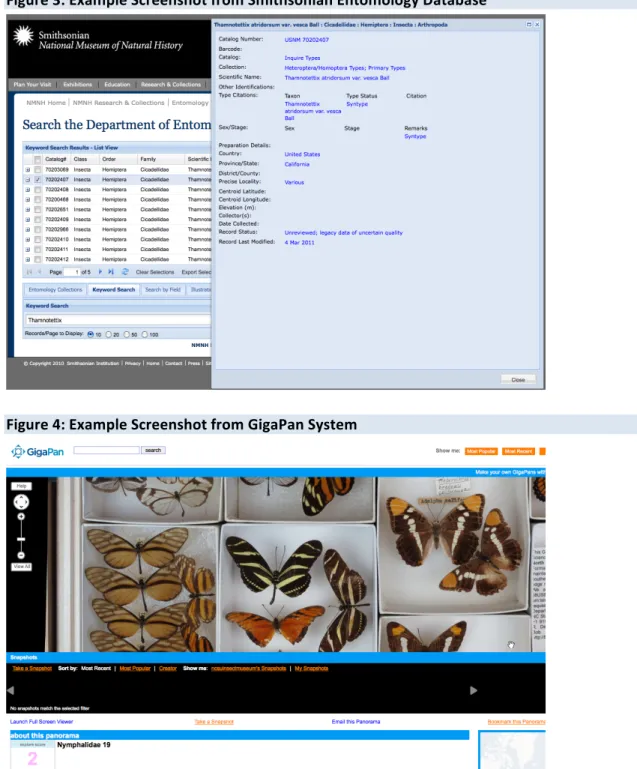
appeared on the survey is shown in Figure 1. The representative examples of the three digitization methods were chosen from my own exploration of available online resources, and a review of my choices by entomologists at NCSU Insect Museum. We chose AntWeb.org20
as an example of detailed images of individual specimens, and the Smithsonian Entomology Collection as an
example of an online database.21 Both of these are well-known resources among
entomologists. The GigaPan image linked to, and provided in a screenshot, was a drawer of butterfly specimens, the Nymphalidae.22 The specimens are fairly
large, but as respondents were not asked to make any identifications, or to extract any other information from the systems, other than to imagine how useful such a system might be for their own work, the choice of the GigaPan image to link was not, I feel, likely to affect the survey results. All three screenshots are reproduced below.
20 http://www.antweb.org/specimen.do?name=casent0177104 21 http://collections.nmnh.si.edu/search/ento/
Figure 1: Screenshot of Main Comparison Question
Figure 3: Example Screenshot from Smithsonian Entomology Database
Answering the comparative question required a bit of imagination from respondents, in that it was impossible to link to a representative system or screen pertinent to the research and order specialties of each respondent. If the
representative system was not relevant to their particular sub-domains of knowledge, respondents had to imagine how useful a relevant system of a similar kind is or would be. Another complication was that for the database system, it was impossible to link directly to a page with data. Only the entry point to the database could be linked to. To explore that system, respondents would have to browse or do a simple query on their own in order to see how the system presented data. The static screenshot, however, showed a page with data, so respondents could get an idea of how the database presented
information without having to browse the system themselves.
Identification Task
To supplement the comparative questions, we included in the survey a simple identification task using GigaPan images. I wanted this task to help introduce respondents to the GigaPan system, and to help us gauge how easily
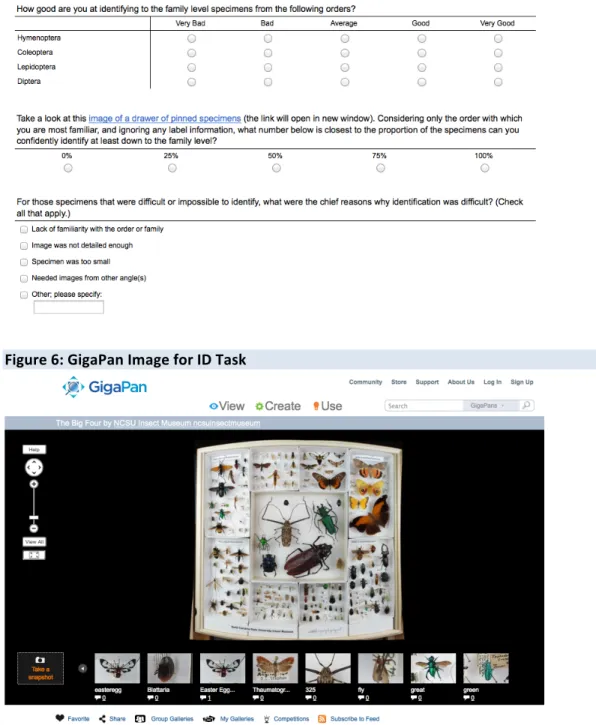
respondents could extract identifying information from GigaPan images. The identification task was presented before the main comparative question, and Figure 5 shows a screenshot of the question as it appeared in the survey. It linked to a GigaPan image of a drawer of the four common orders of insects— Hymenoptera, Coleoptera, Lepidoptera, and Diptera23—and asked respondents
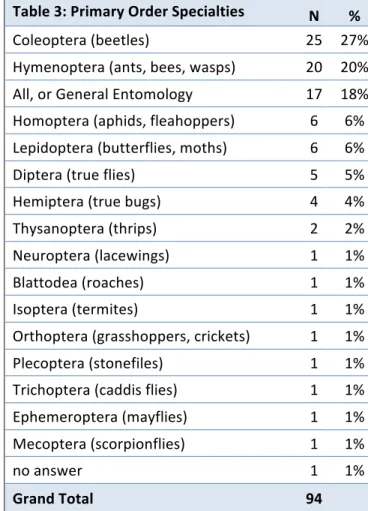
to estimate the percent of the specimens they could identify to at least the family level, considering only the group in the image the respondent was most familiar with. The linked-to image is shown in Figure 6. A later question in the survey gave respondents the opportunity to volunteer for a follow-up study to
investigate in more depth the use of GigaPan images for specimen identification. Thirty-nine respondents volunteered for the follow-up study, which asked them to identify specimens from the insect group they were most familiar with. This follow-up study is still on-going, and results are not yet available. Our
hypothesis is that even if the GigaPan system is not rated highly in comparison to more elaborate systems, the identification tasks would help show whether or not the GigaPan images were useful, in an absolute sense, for online identification of specimens.
Figure 5: ID Task Using GigaPan Image
Limitations of the Study
In designing the survey, I attempted to present representative examples of online presentation methods for comparison, and to test the usefulness of the GigaPan images both in comparison to other systems, and in isolation for a simple specimen identification task. Potential problems with these measures were, I feel, adequately addressed. But some other potential problems with the study I could not address, and the extent to which they affect the results and conclusions of this study are unknown.
The first of these is a lack of information about the representativeness of the study sample. The survey collected basic information about respondents’ degrees, institutional affiliations, and research and insect order specialties. But I have not been able to find statistics about the distribution of such characteristics among the entomological community as a whole. Thus it is impossible to judge how accurately the sample reflects the population. The survey questions about institutional affiliation, work specialty, and insect order specialty, were based on similar questions on the Entomological Society of American (ESA) membership form,24 and the entomologists whom I worked with in designing the survey
found the categories sufficient to encompass the wide range of entomological work as they knew it. But I was able to obtain from the ESA only geographical information about their membership,25
and, in any case, the ESA appears not to collect information about work and order specialties from all their members,
24 https://online.entsoc.org/esassa/censsacustmast.insert_page? The ESA is the world’s largest
entomological organization, with some 6,400 members (ESA, “About ESA” Webpage, http://www.entsoc.org/about_esa, accessed January 2012).
only from those who complete the online form from the ESA Website.26
Without such information from the ESA or a similarly large entomological organization, I have no way to test whether or not the study sample is representative of entomologists in general.
A second potential limitation is that the many sub-specialties of
entomology may have very different preferences as users of digitized collections. Researchers looking primarily at biodiversity, for example, will likely be most interested in digitized label information and broader metadata about collections. Taxonomists of some families may require detailed images of certain body parts that a system like GigaPan cannot easily capture. A question asking a
respondent to judge the utility of the GigaPan system will be judged differently according to how closely the specimens shown as examples are related to a respondent's specialty. A specialist on ants may judge the usefulness of the GigaPan system differently if shown an example of a drawer of moth specimens than if shown a drawer of ant specimens. Unfortunately, there was no way for a single survey to allow all respondents to view images of specimens pertinent to their research specialties. The follow-up study will address this in a limited way, but the diversity of needs within the entomological community will have to be the subject of further research. The survey results will also only apply to a certain type of entomological specimen—the dry, pinned specimen. Other kinds of specimens, such as those mounted on slides or preserved in vials of alcohol, are
26 The paper membership form, and the downloadable PDF of the form, do not ask for
information about work or order specialties
not represented in the survey, and the drawer imaging system included in the evaluation does not have any obvious application to collections of those types.
Finally, there may be a significant group of entomologists who are not comfortable using online systems, and they are likely to be underrepresented in an online survey distributed via listserv. In interviews with six entomologists at NCSU in preparation for this study, there seemed to be a generational divide in terms of the use of online resources. Older entomologists I spoke to rarely used the Internet for their work, relying instead on printed publications and physical specimens. Younger entomologists were more likely to access information online, and were in general more enthusiastic about the GigaPan project. The online survey may thus overstate the usefulness to entomologists as a whole of any digitization technique, although comparisons among different techniques would still be useful.
Results and Discussion
This section reports findings from the principle components of the survey, discusses those results, and examines how responses differed among various groups. A simple tabulation of all complete survey responses is presented in Appendix 1. Below, I look first at what we know about who took the survey, including their research specialties, institutional affiliations, the insect orders they specialize in, and their use of online resources. The next section examines responses to the comparison of online presentation methods, the utility of each method for different purposes. I then examine the difficulties in determining whether insect order specialties might have impacted the survey results, and how responses differ by the geographic location of the respondent. Next, I look at what features in online presentations respondents desired most, and how respondents performed on the survey’s simple identification task.
Characteristics of Those Who Completed the Survey
The analysis of the data was primarily done using JMP Pro 9 statistical software, with some additional use of Excel and Qualtrics’ analysis tools.
Research Specialties
The survey asked respondents to report their primary and secondary fields of work or research, the year they completed the degree that qualified them to work in their field, their institutional affiliation, and the primary and secondary insect order they specialized in. To make
comparisons among the groups easier, I divided the specialties into three larger categories based on whether the respondents identified taxonomy or systematics as either a primary or secondary specialty. The results are shown in Table 1. Non-taxonomists did not list either taxonomy or systematics as their primary or secondary specialty.
Semi-taxonomists listed either taxonomy or systematics as their secondary, but not primary, specialty. Taxonomists listed taxonomy or systematics as their primary specialty. Since I could not definitively say whether the specialty “curatorial” involved taxonomy or
Table 1: Respondents’ Primary Specialties Non-‐taxonomists 29
not, any respondent who did not fall into the Taxonomist category or Semi-taxonomist category, but who gave curatorial as their primary or secondary specialty, I assigned to the Unclassified category.
Most of the respondents—44 of 94, or about 47%—identified themselves as working in either taxonomy or systematics. Another 11 respondents (12%) listed taxonomy or systematics as their secondary specialty. Non-taxonomists accounted for 29 (31%) of the respondents, and 10 (11%) fell into the Unclassified category. Respondents listed a diverse array of specialties aside from taxonomy and systematics. Ecology (6 respondents), agricultural entomology (5), and curatorial (8) were the most common primary specialties. No other specialty was reported more than 3 times. While I do not, as noted above, have any data about the mix of specialties among entomologists as a whole, it is probably safe to say that the survey sample is not representative in its plethora of entomologists concerned with taxonomy.
Institutional Affiliations
Most of the respondents are affiliated with a college or university, either as staff/faculty, or as students. Of the 94 complete surveys, 34 respondents (36%) were university or college staff or faculty, and three out of four of these hold PhDs. College students and museum workers were the next largest contingents among respondents, each accounting for 22% of the total number of completed surveys. Other affiliations were far less numerous, with only 10 respondents reporting affiliation with a federal or state agency, and four respondents
affiliations represented demonstrate the variety of work and research roles occupied by entomologists, and the corresponding difficulty of designing a single digitization system to suit the needs of all of them. See Table 2, below, for a complete breakdown of the responses.
Insect Order Specialties
Given the incredible morphological variation among insect species, it seemed logical to me that specialists in some orders would find particular digitization methods more useful than others. Representatives of some orders are generally much larger than representatives of other orders, or have (like Lepidoptera) features important for classification that are easier to capture in digital images. See Table 3 for a list of all primary order specialties. Two groups accounted for nearly half of the responses. Specialists in Coleoptera (Beetles) were 25 of the 94 respondents (27%), and specialists in Hymenoptera (Ants, bees, and wasps) were 20 of the respondents (21%). The only other large specialty group was the All, or General Entomology, group, with 17 respondents (18%). Expertise among the
Table 2: Respondents’ Institutional Affiliations and Degrees Held
Affiliation BA/BS PhD MA/MS None Total University or College Staff or Faculty 1 26 7 34 Museum (private, government, or
remaining respondents is
distributed among 14 other insect orders, with only 5 order specialties represented by more than a single respondent.
Age of Respondents
Based on my initial interviews of entomologists for this project, I believed that older entomologists would find online tools less useful than younger entomologists. The survey asked respondents to report the year they had obtained the highest degree that qualified them
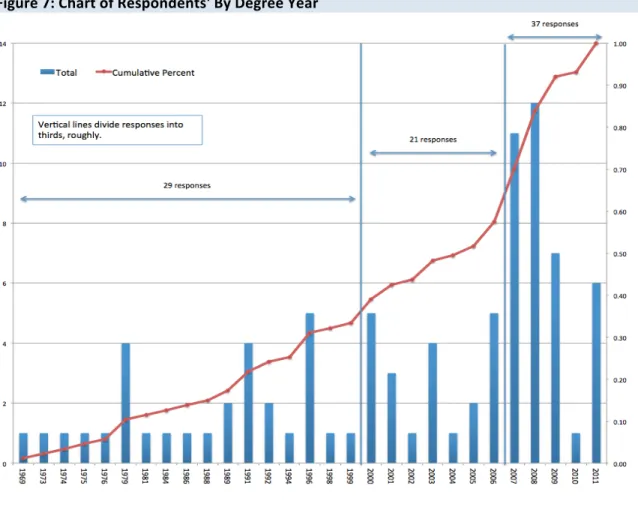
for work in entomology as a proxy for age. See Figure 7: Chart of Respondents' By Degree Year, for a complete breakdown of the responses. Most of the
respondents reported receiving their qualifying degrees quite recently. More than one third (37 respondents, or 43% of all respondents) received their degree in 2007 or after. Another 21 respondents (24%) received their degrees between 2000 and 2006. Finally, a long tail of respondents (29, or 33%) received their degrees between 1969 and 1999. Seven respondents did not have a qualifying degree, and so did not answer this question. As shown in more depth below (see page 34), year-of-degree did not have any apparent affect on how respondents rated the usefulness of online resources. Ratings for the usefulness of online
resources given by entomologists who received their professional degrees before 2000 were nearly identical to the ratings given by respondents who received their degrees more recently.
Figure 7: Chart of Respondents' By Degree Year
Geographical Distribution of Respondents
After the results of the survey began to come in, the entomologists I was working with to design the survey were curious about possible international differences in responses to the digitization methods the survey presented. They
more useful than their US-based colleagues. Although the survey did not ask respondents to supply information about their geographical location or nationality, the Qualtrics software captured the IP addresses of respondents, and using a simple online lookup tool I was able to resolve these to country and city from which the respondent was accessing the survey. This is, of course, not a direct measure of the
nationality of respondents, and even the geographic location of a respondent’s IP
address may not match the location where he or she was actually taking the survey. But without repeating the survey with an additional
question about nationality, using the IP address is the best we can do. It is not entirely unreasonable to assume that most respondents took the survey within the city and country where they commonly work.27
With those caveats in mind, then, let us look at the geographic location of the respondents. The vast majority of respondents were completing the survey from the US: 65 of 94 respondents (69%) had a US-based IP address. This makes the respondents slightly more international than the general membership of the
27 Note that in the survey results appended to this thesis, the IP addresses of respondents are not
listed, as doing so would unduly compromise the anonymity of some respondents. Geographic location is instead given only according to the three broad categories used in the data analysis: US respondents from states other than North Carolina, US respondents from North Carolina, and Non-US respondents.
Table 4: Location of Respondents, Based on IP Address
Country Total %
Entomological Society of America, which reports that 85% of its members are from the US.28 US responses came from 28 different states, with the largest
groups from North Carolina (16 responses, 25% of US responses, and 17% of all responses) and California (12 responses, 18% of US, 13% of total). To test
possible differences between respondents in Raleigh and respondents elsewhere in the US and abroad, I separated responses from Raleigh into their own group. Raleigh respondents are highly likely to be affiliated with NCSU, and somewhat likely to be NCSU Insect Museum staff, or at least acquainted with the Museum and its activities. Because of this, they might be more favorably inclined toward the GigaPan digitization system, and if so, their responses would skew the overall results.
Use of Entomological Collections and Online Resources
A large majority of respondents reported finding online resources, print
resources, and specimens very useful for their work. There were no significant differences in how respondents rated the usefulness of the five categories of resources included on the survey (Question 8). Online books and/or journals were rated most useful. On a scale of 1 (useless) to 5 (very useful), online books and journals had a mean score of 4.74. Online resources specifically for
entomology, other than books and journals, were rated least useful, with a mean score of 4.49. This could reflect the fact that online resources for entomology tend to be designed for specialists in a particular type of work or order of insect.
28 Personal communication from Chris Stelzig, ESA Member Services, 14 June 2011. Op. cit., note
The survey alone does not give us a good picture of how entomologists use online resources. A more in-depth study, involving more ethnological
methods, would be helpful in that regard. But the survey did ask respondents to name the “online resources specifically for entomology” they use in their work. Eighty respondents answered that question, specifying up to 222 resources, ranging from general Google searches to sophisticated Websites devoted to particular insect orders and/or geographical regions. The original text of all the responses is reproduced in Appendix 1 (question 9). I say “up to 222 resources,” because parsing some of the responses into individual resources, and grouping synonymous terms, involved some subjective interpretation of the respondents’ intent. Grouping the responses into simple groups also proved difficult, because of the variety of possible uses many of the resources support. The list is also impressionistic because respondents were asked to recall resources in a very unstructured way. Several respondents noted in their response that there were
Table 5: How Useful for Your Work are the Following Kinds of Resources?
Resource Useless
Somewhat
useless Neutral
Somewhat
useful useful Very N Mean
Online books and/or
journals 0 1 2 17 74 94 4.74 Printed books and/or
journals 0 2 2 20 70 94 4.68 Google or other all-‐
purpose online resources
0 1 5 23 65 94 4.62
Specimens (borrowed or in your possession)
1 2 9 13 68 93 4.56
Online resources specifically for
entomology (other than online books or
journals)
many other resources they were not listing, or that there were simple “too
many to list.” To accept the responses as meaningful, we have to assume that the resources the respondents listed were foremost in their minds because of the frequency of their use and/or their importance for the work of the respondents. This assumption is not unreasonable, I believe, but it is certainly open to
question.
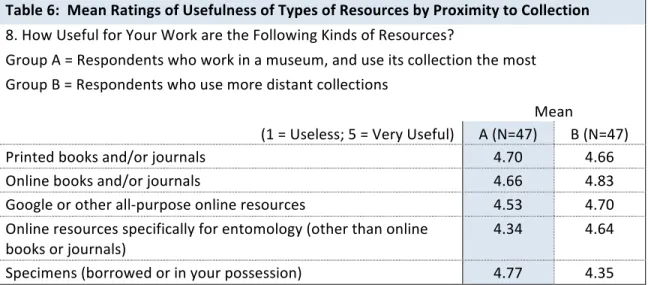
Table 6: Mean Ratings of Usefulness of Types of Resources by Proximity to Collection
Nonetheless, one of the striking things about the list of resources is the prevalence of Websites that feature simple images of insects. The unambiguous leader of the listed resources is BugGuide.net, which was listed by 25 of the 80 respondents. Similar, or even simpler, image resources, such as Google Images, Wikipedia, Wikimedia, and Flickr were also among the resources listed. From these results, it seems clear that simple imaging systems to help entomologists quick ID specimens can be highly useful.
The survey also tried to gauge the usefulness to respondents of physical entomological collections, and how proximity to collections might influence their use of online resources. As we have seen above, a large majority of respondents
8. How Useful for Your Work are the Following Kinds of Resources?
Group A = Respondents who work in a museum, and use its collection the most Group B = Respondents who use more distant collections
(1 = Useless; 5 = Very Useful) A (N=47) Mean B (N=47) Printed books and/or journals 4.70 4.66 Online books and/or journals 4.66 4.83 Google or other all-‐purpose online resources 4.53 4.70 Online resources specifically for entomology (other than online
reported that entomological specimens were very important to their work. Question 20 asked respondents “How important to your work are collections of entomological specimens.” Again, a large majority—70 of 93 respondents, or 75%—reported that collections were “very important.” Borrowing specimens, however, was not as widespread, as 31% of respondents reporting (Question 21) that they had not borrowed any specimens from an entomological collection in the past year. Those who had borrowed specimens tended to borrow from only a few collections, as 78% of respondents who had borrowed specimens reported borrowing from less than five collections in the last year (Question 22). More than half (51%) of those who use collections work at the institution that houses the collection they use the most, and a further 22% work within a short distance from the collection they use the most (Question 23). Even those respondents who work within the institution that houses the collection they use the most, however, used online resources extensively in their work. Respondents who work most with a collection were only slightly less likely to rate online resources as “very important” as were respondents who worked with more distant
collections. The differences in rankings between the groups were not, however, statistically significant.
online resources as did those who received their degrees in 2000 or after. There were no statistically significant differences in the ratings in Question 8 between those who had received their degrees before 2000 and more recent (and presumably younger) degree recipients.
Table 7: Mean Ratings of Usefulness of Types of Resources by Year of Highest Professional Degree
8. How Useful for Your Work are the Following Kinds of Resources?
Group A = Respondents who received their highest professional degree before 2000. Group B = Respondents who received their highest professional degree in 2000 or after.
(1 = Useless; 5 = Very Useful) A (N=29) Mean B (N=58) Printed books and/or journals 4.86 4.55 Online books and/or journals 4.62 4.79 Google or other all-‐purpose online resources 4.55 4.62 Online resources specifically for entomology (other than online
Comparison of Online Presentation Methods
The heart of the survey was a series of questions asking respondents to rate the usefulness of three different ways to present entomological collections online. (See page 13 and forward for a full discussion of how this part of the survey was structured.) Overall ratings for the usefulness of the GigaPan system were
disappointingly low, although respondents reported high levels of success on the simple ID task using only a GigaPan image.
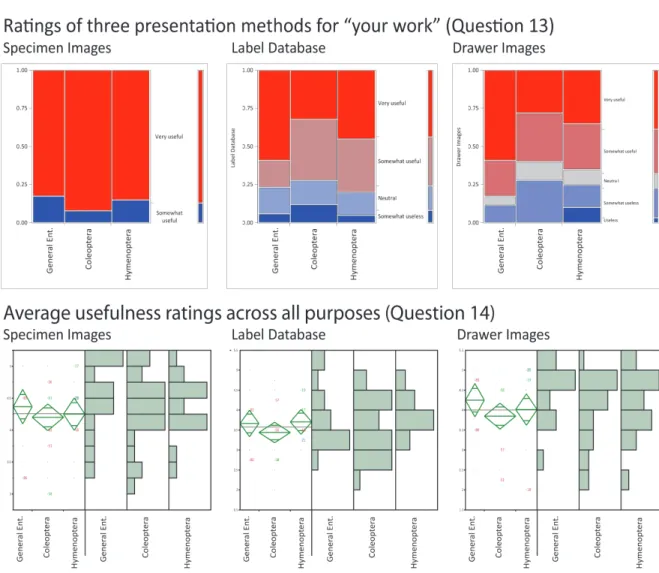
As I described in an earlier section, the main comparison question (Question 13) asked respondents to view three representative presentations of entomological collections, and then to rate how useful they thought each type of system would be for their own work. Detailed images of individual specimens (represented by AntWeb.org in the survey), was rated highest, with 77 of 94 respondents (82%) rating it as “very useful,” the highest rating possible on the survey. The system’s mean rating was 4.8 out of a possible 5. Databases of label
information were ranked second, with a mean rating of 4.2, while the Detailed images of drawers of specimens were rated lowest, with a mean rating of only 3.7. Only 33 of 94 respondents felt neutral toward drawer images or rated them useless or somewhat useless, indicating entomologist would find them useful, just not as useful as the other two methods shown.
Taxonomists and Non-taxonomists had nearly identical ratings for the usefulness of individual specimen images and label databases, but rated the usefulness of drawer images quite differently.29
Non-taxonomists were likely to find the drawer images more useful than taxonomists. The difference is
statistically significant at the .05 level using a Chi-square test, though only just (P=0.0489). Using the more conservative Pearson calculation of Chi-square the differences are not significant (P=0.0569).
29 I describe how respondents were grouped into “taxonomist” and “non-taxonomist” groups
above, under Research Specialties.
Table 9: Usefulness of Presentation Types by Taxonomists (N=44) and Non-‐taxonomists (N=32)
Detailed images of
individual specimens Database of label information drawers of specimens Detailed images of
Comparison of Presentation Methods For Different Purposes
This raises the question of what purposes taxonomists and non-taxonomists felt the drawer imaging system was useful, or not useful, for. In Question 14,
respondents rated the usefulness of the three different presentation types for four purposes: finding out if a collection has specimens you’d like to borrow; teaching K-12 or undergraduates; educational outreach to the general public; and doing entomological research. The ratings for all respondents are shown in Figure 8. Here, drawer images were rated more useful than individual specimen images for investigating possible loan requests, and nearly as useful as individual specimen images for education and outreach. But the only dramatic differences
among the methods were that a database of label information was rated much less useful than the other two methods for teaching and outreach, while drawer images were (again) rated much less useful for entomological research.
Interestingly, ratings for doing entomological research were lower for all three methods in this second question than in Question 13, and rated most useful were databases of label information, rather than detailed images of individual specimens. This may reflect the different wording of the two questions—the first asked respondents to rate the usefulness for “your work,” while the second asked them to rate the usefulness for “entomological research,” which not all respondents would necessarily consider their work.
Differences between taxonomists and non-taxonomists can be clearly seen in the usefulness ratings for different purposes. As shown in Figure 9, non-taxonomists were more likely to rate both single-specimen images and drawer images as more useful than taxonomists. The largest differences were in ratings
for drawer images. Both taxonomists and non-taxonomists rated drawer images as least useful for entomological research, but non-taxonomists thought the method would be significantly more useful than taxonomists.
Non-taxonomists also had a more positive reaction to drawer images for teaching and outreach, though the differences between the two groups were not as large as for research. The ratings of the other two presentation methods given by
taxonomists and non-taxonomists for doing entomological research do not differ significantly.
Comparison of Responses by Order Specialties
It is more difficult to say whether differences in primary order specialties had a significant relationship to how various presentation methods were rated. There are too few responses, too many different order specialties represented among the respondents (many with only one representative; see Table 3: Primary Order Specialties, above), and no meaningful way to consolidate the order specialties into larger groups. To simplify the data, I looked again at usefulness ratings for the three different presentation methods (Questions 13-1 through 13-3) and at average usefulness ratings for each system for all purposes (Questions 14-16). But this time, I excluded all order specialties except the three most common— Coleopterists (N=25), Hymenopterists (20), and General entomologists (17). Together, these account for 66% of all respondents. As shown in Figure 10, the differences in the responses of these three specialties were slight, and in no case statistically significant. The only marked difference was that General
consolidating usefulness ratings into either “neutral to useless” or “somewhat or very useful” did not reveal any significant differences among the three specialties, either. I tentatively conclude from these data that order specialty is not as strongly related to respondents’ usefulness ratings as respondents’ sub-disciplines (taxonomist/non-taxonomist).
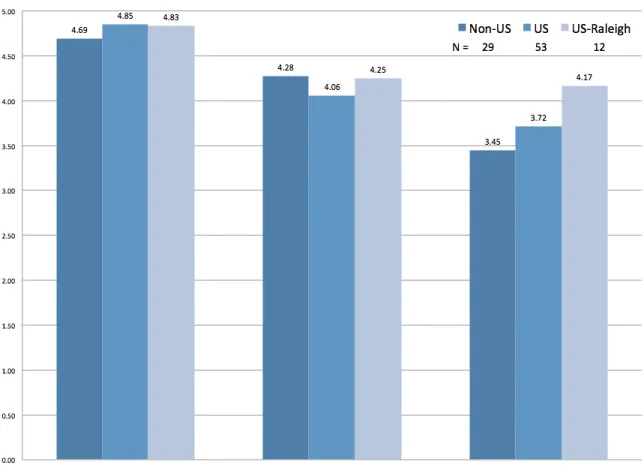
Differences Among Responses By Geographic Location
As mentioned above, the survey collected the IP addresses of respondents as a proxy for both nationality and likely connection to the NCSU Insect Museum. The entomologists at NCSU were interested to see if respondents from countries other than the US rated presentation methods as more or less useful than their US-based counterparts. I was also concerned that, because staff from the NCSU Insect Museum were among the survey respondents, their responses might be more positive toward the drawer imaging system their institution had
developed, and thus would skew the overall results. Accordingly, I analyzed the data to look for significant differences among respondents taking the survey in Raleigh, in other locations in the US, and in other countries.
usefulness of the presentation methods, or the ratings for the methods for different purposes. The Raleigh-based respondents may have had a slight bias toward the drawer images, but it did not significantly affect the overall results.
Contrary to my and my collaborators’ expectations, non-US respondents tended to rate both single-specimen images and drawer images lower than did US and US-Raleigh respondents. The differences for the specimen images ratings are only slight, but they are more pronounced in the ratings for the drawer images method, particularly between non-US and US-Raleigh
respondents. Again, the differences are not statistically significant, but given the relatively low number of respondents, it is a difference that may bear further investigation.
Desired Features in Hypothetical Presentation Methods
Questions 17-19 asked respondents a variety of features that could be built into any hypothetical online presentation of a large entomological collection.
Respondents rated and ranked the features according to usefulness without considering any specific presentation method in which the features might be available. As shown in Figure 12, below, “detailed images of individual specimens” was rated most useful, followed closely by “detailed images from several angles of individual specimens.” The only feature that a majority of respondents rated as neutral, somewhat useless, or useless, was notes from the general public, which scored a mean usefulness rating of only 2.7 out of 5. Images of units or drawers of specimens was rated second from last, with a mean rating of 3.76.
In designing the survey, I was concerned that respondents would rate more than one feature as “very useful,” and so I added a ranking question to attempt to differentiate among the highest rated choices in Question 17. This question asked respondents to rank the features they had previously rated as “very useful.” At the top, at least, the rankings are different from the order of the mean ratings shown in Figure 12 in several respects, though interpreting the results is not as straightforward. In the rankings, “detailed images from several angles” received the more votes as most useful—33—while “detailed images of individual specimens” finished in second place, with 21 ranks as “1.” Whole-unit or drawer images did slightly better in the overall rankings, but received only 3 votes as most useful. The question is flawed, however, in that
respondents were asked to rank only those features they had previously rated as “very useful,” making comparing ranks across respondents difficult.
Question 19 gave respondents wider scope for identifying useful
features by asking them to write brief statements about “What online resources do you wish were available for your work, or what improvements to existing online resources would you like to see developed?” Sixty-two respondents offered their opinions, and their full responses can be found in Appendix 1. The interpretation of these responses is subjective, but about half of them mentioned the desire for high-quality images of individual specimens. A striking feature of the responses was that many of them revolved around the need to accurately identify insects. Toward this end, many respondents indicated they wished for a combination of high-quality images of single, authoritatively identified
specimens, ideally with full label data, notes and images about taxonomically important characteristics, habitus images, and up-to-date maps or other georeferenced distribution information. This might well be described as the “gold standard” for the presentation of entomological collections online. Only a few respondents wished for resources that allowed more collaboration among entomologists, such as the ability to easily add one’s own images to a central database, or the ability to view drawer images of unidentified specimens. A desire for information about entomological collections to be more centrally available was also a notable feature of the responses. Several respondents said they wished for merely a central database of what specimens collections had (or thought they had). This desire for more greater integration among online
ID task performance
A secondary goal of the survey was to investigate the utility of the GigaPan system for quick identification of specimens. Toward this end, Question 11 asked respondents to look at a GigaPan image of a drawer containing specimens from “the big four” orders—Hymenoptera, Coleopteran, Lepidoptera, and Diptera.30 Respondents were then asked to estimate the percent of specimens
they could identify at least to the family level, considering only the order they were most familiar with. Not surprisingly, given their insect order
specializations, most respondents reported being “good” or “very good” at identifying Hymenoptera and Coleoptera specimens. Very few respondents reported being “good” or “very good” at identifying Lepidoptera or Diptera specimens, but all the orders, majorities of respondents rated themselves at least “average” at identifying specimens to the family level. For the identification task itself, the respondents reported high degrees of success. Fifty-nine percent of respondents reported they could identify to the family level 75% or more of the specimens in the GigaPan image. The survey did not attempt to confirm
respondents’ estimated percent of identification, but the relatively high level of identification success inspired a follow-up study, in which participants will be asked to give more specific, and verifiable, identifications of specimens
specifically chosen from insect groups in which the participants have indicated expertise. This follow-up study is still on-going, and results are not available for including in this thesis. Most respondents (56 of 93 responses, or 60%; see
30 The image’s URL is http://www.gigapan.org/gigapans/fullscreen/49310/, and a screenshot
Question 12 in Appendix 1) indicated that the lack of images from other angles was one of the chief reasons why identification of some specimens was difficult or impossible. Nearly as many (53, or 57%) said that the specimens pictured were too small. Lack of familiarity with the orders shown and a lack of detail in the image were other common responses.
Conclusions
The primary hypothesis that motivated this study was that entomologists would find the drawer image system significantly useful for their work. The results of the survey do not, alas, offer a clear confirmation or refutation of this hypothesis, though on balance the results support the contention that relatively simple
digitization methods can be of value to the entomological community. Of the three presentation methods rated by survey respondents, the drawer image method was rated the least useful, but still a majority of respondents (61 of 94) rated the system as “Somewhat useful” or “Very useful.” When looking only at responses from non-taxonomists, the drawer image method was rated as useful as a database of label information. In the comparison for different purposes, the drawer imaging system (Figure 8) was rated nearly as useful as detailed images of individual specimens for teaching K-12 or undergraduates, and educational outreach to the general public, and more useful than single-specimen images for finding out if a collection has specimens to borrow. Only for “doing
appears to be fairly useful, though not as useful as detailed images of individual specimens.
The results also show 1) that entomologists can generally identify
specimens at least to the family level using drawer images, and 2) that relatively simple online resources to assist in the identification of specimens are among the most frequently used by entomologists. Respondents reported high levels of success on the survey’s simple ID task, and resources for quick identification, such as BugGuide.net, were the most commonly mentioned online resources used by respondents in their work. More research is needed in this area to better clarify the online resources currently most valuable for different kinds of
entomologists, and to more definitively describe how those resources are used in entomologists’ daily work. But the simplicity of a presentation does not
necessarily determine its usefulness, or lack thereof. Surely, as the experience of many “more product, less process” archival work has shown, having a relatively simple resource available quickly, at low cost, is in many contexts preferable to waiting until time and resources permit launching more useful, but more expensive, resources.
online collaboration and crowd-sourcing simple tasks like the sorting of unidentified specimens would be of greater use to entomologists. Sites like BugGuide.net rely heavily on user contributions of images and IDs, but that user-generated content does not seem to have impaired BugGuide’s usefulness to the working entomologists. This is another area that may warrant further study. This survey was not designed to probe the use of online collaboration by
entomologists, and so definite conclusions are not possible. Despite the survey results, online collaboration to support the development and curation of
entomological collections seems like a natural outgrowth of older, non-digital, patterns of entomological work.
over-represents their numbers among all entomologists, but taxonomists may be more likely than other specialists to use online presentations of entomological collections, and so their constitute a larger, or more important, portion of any resource’s user base than other specialists. But one possible conclusion from the survey data is that if the planners of an online resource do not anticipate
taxonomists constituting an important segment of their users, a less expensive presentation method, such as drawer images, may suffice to make the resource quite useful to other specialists.
The survey does not offer enough data to determine whether differences in order specialties make a big difference in the usefulness of presentation methods. There are too many order specialties, and too few respondents, to allow significant comparisons. The survey found no significant differences in the usefulness ratings of different order specialists, even when analysis is restricted to the three most commonly-reported order specialties, and usefulness ratings collapsed into only two categories—“useless to neutral” and “somewhat or very useful” (see Figure 10). Although it is a narrow foundation, based on the
survey’s results it appears that discerning the sub-discipline of a resource’s likely user base is more important for planning an online presentation than is
Works Cited
Advancing Digitization of Biological Collections (ADBC), NSF 11-567, http://www.nsf.gov/pubs/2011/nsf11567/nsf11567.htm
Aldrich, J. M., "The Division of Insects in the United States National Museum,"
Annual Report of the Board of Regents of the Smithsonian Institution, 1919: 367-379, p. 372
AntWeb Documentation (2010) http://www.antweb.org/documentation.do. (accessed 16 May, 2011).
Arino, Arturo H., "Approaches to Estimating the Universe of Natural History Collections," Biodiversity Informatics, 7 (2010): 81-92; Table 1, p. 88.
Baird, Roger, "Leveraging the Fullest Potential of Scientific Collections through Digitization," Biodiversity Informatics, 7 (2010): 130-36.
Berendsohn, Walter G., Vishwas Chavan, and James Macklin, "Summary of Recommendations of the GBIF Task Group on the Global Strategy and Action Plan for the Digitisation of Natural History Collections,"
Biodiversity Informatics, 7 (2010): 67-71.
Bertone, Matthew A., and Andrew R. Deans. "Remote Curation and Outreach: Examples from the NCSU Insect Museum Gigapan Project." Paper presented at the Fine International Conference on Gigapixel Imaging for Science, Carnegie Mellon University, Pittsburgh, Pennsylvania, 11-13 November 2010; http://repository.cmu.edu/gigapixel/26/ (accessed December 2011).
Blagoderov, Vladimir, Ian Kitching, Thomas Simonsen, and Vincent Smith. "Report of Trial of SatScan Tray Scanner System by SmartDrive Ltd."
Nature Precedings, 2010.
Dietrich, Chris, "Traditional Approaches to Collection Digitization," 2010, http://invertnet.org/resources/19 (PDF, accessed January 2012). Entomological Society of America, “About ESA” Webpage,
http://www.entsoc.org/about_esa, accessed January 2012).
Flattau, Pamela Ebert, et al, "Preliminary Findings from the NSF Survey of Object-Based Scientific Collections." Washington DC: Science and Technology Policy Institute (2008): 106-107.
GigaPan, http://www.gigapan.org/
Green, Mark A., and Dennis Meissner, "More Product, Less Process: Revamping Traditional Archival Processing," American Archivist, 68 (2005): 208-63. Invertnet, http://invertnet.dyndns.org/.
Kling, Rob, Geoffrey McKim, and Adam King, "A Bit More to It: Scholarly
Communication Forums as Socio-Technical Interaction Networks," Journal of the American Society for Information Science and Technology, 54 (2003): 47-67.
Lonson, Jay, et al. "Adapting Traditional Macro and Micro Photography for Scientific Gigapixel Imaging." Paper presented at the Fine International Conference on Gigapixel Imaging for Science, Carnegie Mellon University, Pittsburgh, Pennsylvania, 11-13 November 2010. !
Niu, Xi, Bradley M. Hemminger, Cory Lown, Stephanie Adams, Cecelia Brown, Allison Level, Marinda McLure, Audrey Powers, Michele R. Tennant, and Tara Cataldo, "National Study of Information Seeking Behavior of
Academic Researchers in the United States," Journal of the American Society for Information Science and Technology, 61 (2010): 869-90.
Smith, Roger C., "The Tray System for Insect Collections," Transactions of the Kansas Academy of Science 31 (1928): 77-81a; paper delivered at 1926 meeting of the Academy
Sorenson, W. Conner, Brethren of the Net: American Entomology, 1840-1880, Tuscaloosa: University of Alabama Press, 1995, p. 40.
Townes, Henry, "A Scientifically Designed Drawer for Scientific Insect Collections," Entomological News 84 (1973): 53-61, p. 53