11 ABSTRACT
DAVID W. ROBINETTE, Jr. Biodegradation of Surfactant Chemicals in Estuarine and
Near Shore Marine Environments of North Carolina. (Under the direction of Dr. Frederic
K. Pfaender)
Estuaries are among the most diverse and productive ecosystems on earth.
Estuarine and near shore marine environments receive neariy one-third of
anthropogenic discharges to surface waters; however, very little is known about the
fate of these chemicals in estuarine environments. The fate of cationic, anionic, and
nonionic surfactants was studied in estuaries of coastal North Carolina. Radiolabeled
chemicals were used to assess respiration, cellular uptake, and residual material in
sewage impacted and unimpacted estuaries, and along the horizontal salinity gradient
of the estuary. Respiration was the major fate of all compounds, with little
incorporation into biomass. Adaptation of the microbial community through previous
exposure to the chemicals appears important only for Linear Alkylbenzene Sulfonate;
a chemical which also appears not to degrade significantly in marine waters. In some
samples, metabolism resulted in a plateau in degradation extent instead of complete
or near complete mineralization, which may be the result of formation of recalcitrant
Ill
ACKNOWLEDGEMENTS
There are many people to whom I would like to express my gratitude to for their
help during the completion of this project. First, I would like to thank my advisor, Dr.
Fred Pfaender for ail of his guidance and advice. I would also like to thank Mr. Ou Jiang for his help in setting up experiments and in managing all of the data they generated. Special thanks are due to my parents; their many years of encouragement and support have been invaluable to me. Finally, I would like to thank my wife and
best friend, Beth, for her encouragement and confidence in me have made this both
IV
TABLE OF CONTENTS
LIST OF TABLES...v
LIST OF FIGURES...vi
INTRODUCTION AND OBJECTIVES...1
MATERIALS AND METHODS...5
Sample sites...5
Pollution Impacted and Unimpacted Sites.. 5
Salinity Gradient Sites...5
Sample Collection and Handling...7
Biodegradation Methodology...7
^H Amino Acid Turnover Time...ii
^H Thymidine Uptake...13
Enumeration of Coliform Bacteria... 14
Enumeration of Bacteria by Acridine Orange... Direct Counts... 14
Calculation of First Order Rate Constants... 15
^ͣ"C Most Probable Number Method for Determining Number of Degraders...15
Characterization of Residual Radiolabel...16
Isolation of LAS Degrading Organisms...17
LITERATURE REVIEW... 19
RESULTS AND DISCUSSION... 28
Background Environmental Data...28
Mass Balance of Added Radiolabel...3i
Biodegradation Experiments: Impacted vs. Unimpacted Sites... 33
Biodegradation Experiments: Salinity Gradient...^2
Nature of the Plateau and Residual Material...62
SUMMARY AND CONCLUSIONS... ... 70
REFERENCES...72
UST OF TABLES
1. Characteristics of the chemicals used in the study...8
2. Environmental Supporting Measurements...12
3. Environmental Supporting Data: Calico Creek and North River...29
4. Environmental Supporting Data: Salinity Gradient...30
5. Example Mass Balance Data: LAS and C18-TMAC...32
6. Biodegradation First Order Rate Constants...51
VI
LIST OF FIGURES
1. Sampling Sites...6
2. Schematic of Biodegradation Methodology...9
3. C12-LAS Respiration in Calico Creek and North River...35
4. C12-TMAC Respiration in Calico Creek and North River...38
5. C18-TMAC Respiration in Calico Creek and North River...41
6. LAE Respiration in Calico Creek and North River...43
7. Respiration of Phenol in Calico Creek and North River...45
8. Stearic Acid Respiration in Calico Creek and North River... 47
9. Cellulose Respiration in Calico Creek and North River... 49
10. Respiration of LAS along a Salinity Gradient...55
11. Respiration of C18-TMAC along a Salinity Gradient...57
12. Respiration of LAE along a Salinity Gradient...59
13. Respiration of Phenol along a Salinity Gradient...6I 14. LAS Degradation with Added Compound and Fresh Organisms... 66
15. LAE Degradation with Added Organisms and Site Water.... 66
I. INTRODUCTION AND OBJECTIVES
The aquatic environment constitutes one of the major sinks for the discharge of anthropogenic chemicals, and consequently, pollution of aquatic habitats is of
growing public concern. Within the United States, there are over 85 thousand
miles of tidal shoreline which border estuarine environments. A large and growing
segment of the population resides in cities along this shoreline, and millions of people use these areas for recreation. The estuarine environment not only receives pollutants from direct wastewater discharge, but also indirectly from discharges into
upstream waters which eventually reach the estuary. The potential impact of
wastewater constituents on the estuarine environment is enormous, especially when one considers the significant commercial and recreational importance of estuarine
and near shore ocean waters.
Estuaries are complex, highly variable ecosystems which represent transition zones between freshwater and marine environments. Estuaries typically exibit a
horizontal gradient in salinity as freshwater mixes with and dilutes seawater. This
gradient may range from zero to 35-37ppt from the freshwater to oceanic portion of the estuary, and may also vary vertically by several ppt (Barnes, 1984; Ketchum,
1983 ). These salinity variations, as well as sediment and circulation patterns often
result in estuaries acting through precipitation and sedimentation, to remove and
retain nutrients and other materials (Knox,1986; Schubel and Kennedy, 1984;
Hobbie et al., 1975). These physical and chemical properties of estuaries contribute to pollution problems, as estuaries may accumulate anthropogenic contaminants such as petroleum products , pesticides and other agricultural
and Wentler, 1982).
The pollution of estuarine and near shore waters in the U.S. may have
serious commercial implications, as it has been estimated that nearly two-thirds of
all fish and shellfish taken from waters off the U.S. coast are species which are dependent upon estuaries (Knox, 1986; Alexander, 1981). In addition, estuarine
environments and their adjacent salt marshes offer an enormous diversity in plant
and animal life, and provide many recreational opportunities, all of which are
vulnerable to human activity (Knox, 1986).
Of the thousands of synthetic organic chemicals discharged into the aquatic environment each year, a number are used and disposed of in such large quantities that their presence in receiving waters is of concern when assessing their
environmental safety. Synthetic detergent chemicals are one such group of highly used, commercially important chemicals. The detergent chemicals of interest from an environmental perspective are the surfactants, which generally compose from 10-30% of modern detergent formulations (Swisher, 1987). Discharge of surfactants into estuarine environments is typically preceded by wastewater treatment, and concentrations in receiving waters usually fall into the ppb range, depending on such factors as the effectiveness of wastewater treatment, level of dilution by the receiving water, and human population density (Swisher, 1987; Larson et al., 1983).
In order to properly assess the potential impact on estuarine ecosystems associated with the discharge of consumer chemicals such as surfactants, more needs to be known about the fate of these chemicals and their transport in the
environment. A number of chemical and biological transformation mechanisms may
interact to determine the fate of a chemical in the aquatic environment. However, chemical transformation mechanisms rarely result in the complete conversion of an
aquatic environments, complete conversion of a compound to its inorganic components is almost always the result of degradation by indigenous microbial populations (Larson and Wentler, 1982; Alexander, 1981; 1983). Microbial
biodegradation processes may lead to small changes in the parent structure so that
characteristic chemical or physical properties are lost (primary biodegradation), or the parent structure may be completely broken down to COj (Ultimate biodegration
or mineralization). With regard to detergent chemicals in particular, biodegradation processes are thought to be the most important means of their transformation in
both wastewater treatment and aquatic environments (Larson and Wentler, 1982;
Larson et al., 1983; Cain, 1976).
Relatively little information is available on the biodegradation of anthropogenic
chemicals in estuarine environments, as only a few studies have addressed this
area. Estuarine biodegradation of consumer chemicals such as surfactants and
related compounds has received even less attention than other pollutants (Larson et
al. 1983; Palumbo et al. 1988; Pfaender et al. 1985; Larson and Wentler, 1982;
Pritchard et al. 1987; Shimp, 1989; Walker et al. 1984 and 1988.)
The overall objective of this study is to determine the extent to which a
number of common consumer chemicals can be degraded by microbial communities
from estuarine and near shore ocean waters, and how characteristics of the
environment influence these transformations. The following specific approaches were used to achieve this objective:
Assess the biodegradation of compounds representing the three main
classes of detergent chemicals (anionic, nonionic, and cationic surfactants) and several reference compounds, in North Carolina estuarine environments.
ͣ
:-^§??^'^^^'^^^3^'
the microbial community to the chemical before appreciable
degradation occurs) to the biodegradation of the surfactants.
Examine the effects of salinity variations on the biodegradation of
surfactants by comparing biodegradation along the geographical salinity
MATERIALS AND METHODS SAMPLE SITES
The sample sites used in this study are located near Morehead City, North
Carolina. These sites were chosen because they are representative of typical
southeastern United States estuaries. Since all of the sites are located in the same geographic region of North Carolina, they will be exposed to similar climatic and
hydrological factors. Characteristics of each of the study sites are discussed below.
Pollution Impacted and Unimpacted Sites
Calico Creek represents a domestic wastewater impacted site (Fig. 1 -A).
The sample site is located approximately a half mile downstream from the
Morehead City wastewater treatment plant. This plant is a 1 MGD(million gallons
per day) trickling filter secondary treatment facility that receives mostly domestic wastewater. At low tide the flow of the creek is approximately 70% wastewater
effluent.
The site not impacted by wastewater is located on the North River Estuary
(Fig. 1 -B). This site was chosen because it has no treatment plants that discharge
into it, and it has the fewest inputs of anthropogenic pollutants in the area. The
water here is open to shellfishing, and levels of coliform bacteria (an indicator of potential fecal contamination) are usually within regulatory limits.
Salinity Gradient Sites
Salinity gradient experiments were carried out in the Newport River Estuary
IRE 1
<M>
%
are typically at or near zero parts per thousand.
Penn Point (Fig. 1-D ) is a typical mid-estuary site with salinity values ranging from 10 to >30 ppt, depending on factors such as river flow and tide.
Marine waters used in this study were collected from a site beyond Beaufort Inlet approximately 3 miles offshore (Fig. 1-E). Salinity of waters from this site was
typically near 35 ppt.
SAMPLE COLLECTION AND HANDLING
Water samples were collected in a site water washed galvanized bucket and transported in site water washed 20 liter polyethylene containers. Sediment
samples were collected in the same way and transported in previously autoclaved
mason jars. Samples were returned to the laboratory within 5 hours of collection
and processed on the same day when possible. When same day processing was not possible, samples were stored not longer than overnight at 4 degrees C, and
processed on the following day.
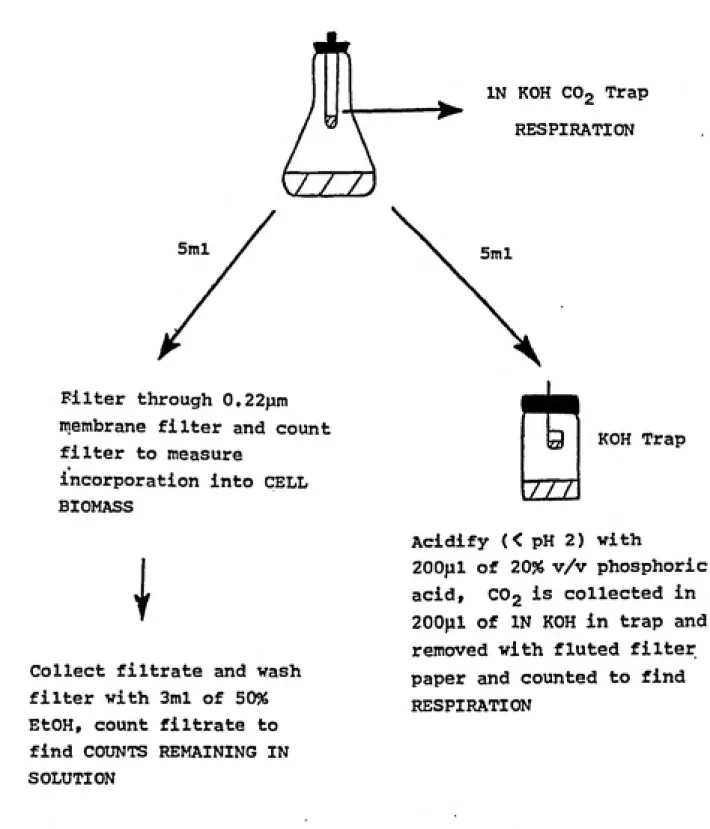
BIODEGRADATION METHODOLOGY
The basic procedure followed was a modification of that developed by the
Procter and Gamble Co. Environmental Safety Dept., as specified in their Standard Test Method for Biodegradation. Radiolabeled surfactants and reference chemicals
(see Table 1) were provided by Procter and Gamble and were used to quantify the
percentage of chemical metabolized to ^'^COg, the amount incorporated into cell
biomass, and the amount of radiolabel remaining in solution.
Site water was mixed by pooling into a 10 gal. carbouy and then distributed
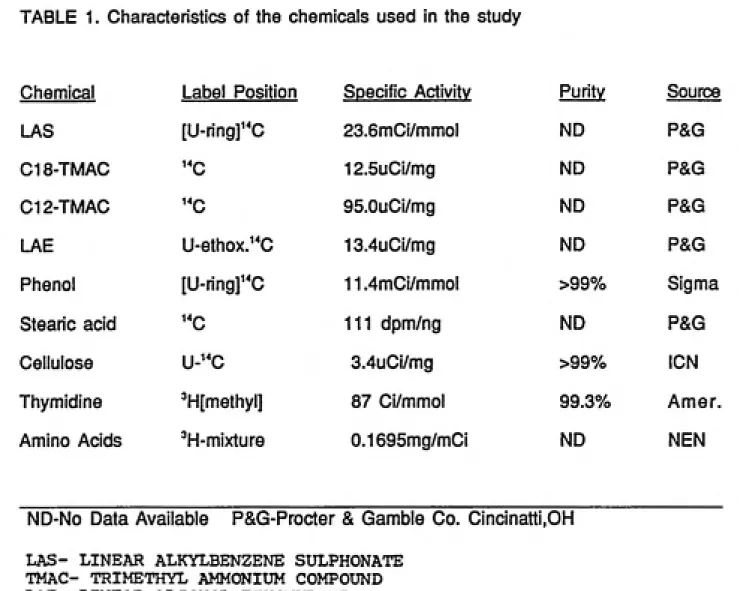
TABLE 1. Characteristics of the chemicals used in the study
Chemical Label Position Soecific Activity Purity Source
LAS [U-ring]^'C 23.6mCi/mmol ND P&G
C18-TMAC ''c 12.5uCi/mg ND P&G
C12-TMAC 14Q 95.0uCi/mg ND P&G
LAE U-ethoxrc 13.4uCi/mg ND P&G
Phenol [U-ring]^*C 11.4mCi/mmol >99% Sigma
Stearic acid ^^C 111 dpm/ng ND P&G
Cellulose U-^^C 3.4uCi/mg >99% ICN
Thymidine 'H[methyl] 87 Ci/mmol 99.3% Amer.
Amino Acids ^H-mixture 0.1695mg/mCi ND NEN
ND-No Data Available P&G-Procter & Gamble Co. Cincinatti.OH
IN KOH CO2 Trap
RESPIRATION
Filter through 0.22)Jin
membrane filter and count filter to measure
incorporation into CELL
BIOMASS
\
Collect filtrate and wash filter with 3ml of 50%
EtOH, count filtrate to
find COUNTS REMAINING IN
SOLUTION
KOH Trap
Acidify (< pH 2) with
200)11 of 20% v/v phosphoric
acid, CO2 is collected in 200jal of IN KOH in trap and
removed with fluted filter paper and counted to find
RESPIRATION
10
be incorporated into the experiment, one g/liter (100°C air dry weight) of site
sediment was also added to each sample flask. All incubations had three live
replicates and one control killed with 1ml of 36% formaldehyde in order to assess
abiotic metabolism of the compounds. Sample flasks were mixed by swirling at
least five times per week.
Incorporation of the compounds into cell biomass was measured by filtering a
5ml aliquot of sample water through a 0.22 micron membrane filter (Gelman Sciences.lnc. Ann Arbor.Mi.) and counting the filter in 10ml of scintillation cocktail
(ScintiVerse II, Fisher Scientific Co.) for ^"C activity in a Packard model 300CD
liquid scintillation counter with internal standards for counting efficiency.
Respiration of the compounds to COg was determined by counting ^''COg
trapped in IN KOH suspended in traps within the sample flasks. The KOH was removed from the traps and placed in 10ml of scintillation cocktail and counted as
before.
The amount of ^"COg remaining in solution was determined by acidifying a
5ml aliquot of sample water to pH <2 with 0.2ml of 20% v/v phosphoric acid and
collecting the ^"COj driven off in 0.2ml of IN KOH in suspended traps as before.
The KOH was recovered from the traps by absorbing it on fluted filter paper
(Whatman #1 ) which was then placed in 10ml of scintillation cocktail and analyzed
for ^"C activity.
To calculate a mass balance of added label, the amount of chemical
remaining was determined by counting the filtrate from the sample flask for ^"C
activity after accounting for incorporation into biomass.
These parameters were normally measured at time 0(20 minutes after
addition of substrate), 1 day, 3 days, 5 days, 7 days, and approximately weekly to
11
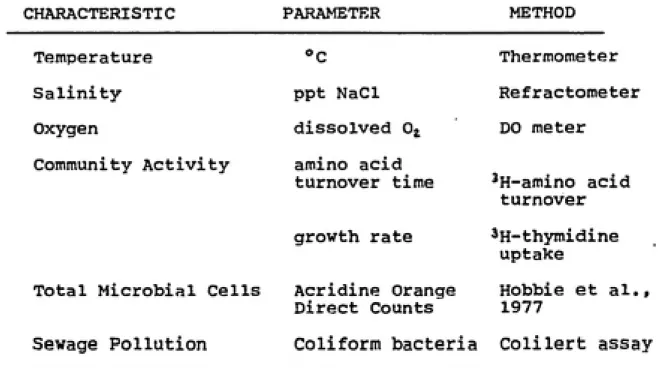
SUPPORTING MEASUREMENTS
Since estuarine environments are often quite variable both temporally and
spatially with regards to physical, chemical, and biological characteristics, it is necessary to define this variability in order to permit comparisons between data
from different estuaries, or the same site over time. A number of parameters are
useful for assessing estuarine variability, and those used in this study are shown in Table 2, along with a description of the methods used to collect the data.
Temperature, salinity, and dissolved oxygen data were determined in the field
as samples were collected. The remaining supplementary measurements were
obtained when the samples were returned to the laboratory before the
biodegradation experiments were set up.
-H Amino Acid Uptake Method
Amino acid turnover time is an indication of the heterotrophic activity of a
community of microorganisms. The turnover time is the time required by the
community to take up an amount of substrate equal to the ambient concentration.
The amino acid turnover time calculated in this study is after that of Gocke (1977).
Site water samples were distributed into four 20ml subsamples, one of which
was killed with 0.1ml of 37% formaldehyde. Approximately 20000 dpm of^H-L
amino acid mixture{specific activity 1mCi/0.1695mg; New England Nuclear, Boston,
MA.) were then added to each vial, which was then capped, mixed by inverting,
and incubated at room temperature on a rotary shaker for exactly 30 minutes. At
the end of the incubation, the reaction was stopped by adding 0.1ml of 37%
formaldehyde and each replicate was then filtered through a 0.22um membrane
filter. The filter was then placed in 10ml of scintillation cocktail and analyzed for^H
12
CHARACTERISTIC PARAMETER METHOD
Temperature "c Thermometer
Salinity- ppt NaCl Refractometer
Oxygen dissolved 0^ DO meter
Community Activity amino acid
turnover time 'H-amino acid
turnover
growth rate *H-thymidine
uptake
Total Microbial Cells Acridine Orange
Direct Counts
Hobbie et al.,
1977
Sewage Pollution Coliform bacteria Colilert assay
13
T, = incubation time(hr)/dpm counted/dpm added
-H Thymidine Uptake Method
The ^H Thymidine uptake measurement gives an estimate of the relative growth rate of heterotrophic aquatic microorganisms. The method used in this
study was adapted from that of Fuhrman and Azam (1980) and Riemann et al.
(1982). The following is an outline of the method used:
1.) Site water samples are divided into 10ml subsamples, one of which is killed
with 0.1ml 37% formaldehyde. Add 'H-[methyl]thymidine (specific activity 87
Ci/mmol; Amersham, Inc.) to a final concentration of approx. 5nM, and
incubate at room temperature on a rotary shaker for 30 min.
2.) At end of incubation, immerse samples in ice water for 5 min.
3.) Add equal volume of ice cold 10% trichloroacetic acid (TCA) to precipitate
insoluble material.
4.) Filter through 0.22um membrane filter and rinse filter with 5 X 1ml of ice cold
5% TCA and place filter in 10ml of scintillation cocktail.
5.) Count 'H activity in liquid scintillation counter.
The number of moles of thymidine incorporated into new cells is calculated
as follows:
# moles incorporated = dpm (SA)\4.5 x 10")
where dpm= dpm's on filter
SA= specific activity in Ci/mol
14
CoHtorm Bacteria Enumeration bv the Colllert System
Numbers of total coliform bacteria were determined using the Colllert system
(Access Analytical Systems, Branford.CT) and comparing to tables of Most Probable
Number of total coliforms in Standard Methods for the Examination of Water and
Wastewater.
Colllert is a reagent formulation of salts, nitrogen, and carbon sources specific only to total coliforms. As specific indicator nutrients are metabolized by total coliforms and E. coli. yellow color and flourescence are released confirming the
presence of total coliforms and E. coli respectively.
Enumeration of Bacteria bv Acridine Orange Direct Counts
The method followed was taken after that described by Hobble et al.(1977).
Samples were held in 20ml scintillation vials which had been rinsed with particle
free water (filtered through 0.22um Nuclepore filters 3x) and dried at 200 °C.
Particle free 37% formaldehyde was then added to a final concentration of
approximately 2%.
A filter flask assembly fitted with tower and base which have been soaked in
75% ethanol and flamed followed by two rinses with particle free water is
assembled with a 25mm 0.22um Nuclepore filter. The filter are presoaked at least
45 min. in Iragalan Black solution (2gm Iragalan Black dye/I 2% acetic acid). One-tenth of the sqmple volume of Acridine Orange is added to the tower with a sterile
serological pipet, followed by 1 to 5 ml of sample also added with a sterile
serological pipet. The sample is stained for 2-4 minutes , at which time vacuum is applied to filter the sample. Filter is placed on a clean microscope slide and
topped with 1 drop of Cargille type A immersion oil. A coverslip is placed atop the
15
fiouresce green, yellow, or red and cell shapes are not distorted. Four fields are
counted and averaged. Number of cells/ml is determined by the following formula: cells/ml= (C)(F)(1.055)/(V)(A) where
C= mean # counts/ grid field
F= area of filter(201.66mm^ for 25mm filter
V= sample vol.(ml)
A= area of grid field (0.00308mm^)
CALCULATION OF FIRST ORDER RATE CONSTANTS
Determination of the average rate of degradation was done by estimating the first order rate constants following the method outlined by Larson (1984).
Biodegradation data were fitted to the following empirical first order model: y= A(1-exp "'^") where
y= % '"COa at time t(days)
A= extent of degradation (%)
K1= first order rate constant
The rate constants in this study were estimated directly by nonlinear
regression analysis using the data for counts obtained as ^"COg representing
mineralization of the compounds.
''C MOST PROBABLE NUMBER METHOD FOR DETERMINING NUMBER OF
DEGRADERS
Determination of the number of LAS degraders present in a sample followed
the procedure of Lehmicke et al.(1979). The method estimates the number of
degraders of a radiolabeled chemical by scoring for ^^COg production from a dilution
Five replicates of successive 10-fold dilutions were prepared for each dilution
level (10°10''). Abiotic controls were used as blanks for scoring replicates as + or
-. For each replicate set, 2ml of dilution sample was pipetted into each of 5 4ml
sterile mini vials (Fisher Sci.), and then radiolabeled substrate was added to each
vial to give a final activity of 4500dpm. The mini vials were placed uncapped into
20 ml scintillation vials containing 1ml of IN KOH to trap COg. The scintillation
vials were capped and incubated at 22°C for 75 days, at which time 150 ul of 20%
H3PO4 was added to each inner vial to drive off CO2 in solution. The scintillation
vials were recapped and incubated overnight on a rotary shaker. At this time, the
inner vials were discarded, and 10ml of scintillation cocktail was added to the
scintillation vials and counted. The dilutions were scored as + if the response was
3x that of controls. The MPN of degraders was determined from tables in Standard
Methods for the Examination of Water and Wastewater.
CHARACTERIZATION OF RESIDUAL RADIOLABEL
A number of experiments showed a plateau in COj production while
significant counts remained in solution. These results raised questions about the
nature of the residual material; ie. was the material parent compound or products.
Several experiments were conducted to address the metabolism of these residuals.
^H amino acid turnover time and ^*C Most Probable Number of CI2 LAS degraders
were determined for the microbial communities remaining in the 012 LAS and
Calico Creek samples of Oct. 1988 containing no sediment in order to determine if
an active community of C12-LAS degraders was still present. The remaining
volume in the LAS and LAE live sample flasks was pooled and distributed into
250ml glass bottles equipped with a KOH trap. Eight bottles for 012 LAS and
.17.
of appropriate Calico Creek sample water. The C12 LAS samples were divided into
two groups of four bottles each, with one bottle in each group serving as the abiotic
control. One group was amended with unlabeled C12 LAS to restore the original
total LAS concentration of 25mcg/liter in order to assess if the plateau was due to a
concentration threshold being reached. The amount of LAS needed to reach this point was determined by estimating the amount of LAS remaining at the last time
point of the degradation experiment. The other group of C12 LAS bottles received
an addition of fresh Calico Creek microorganisms to see if a fresh pool of organisms would stimulate metabolism. The organisms were obtained by
centrifuging fresh Calico Creek water at 5000 x g for 30 minutes and resuspending
the pellet in 5ml of fresh Calico Creek water which had been filtered through 0.22
micron membrane filters. Each bottle received 1 ml of the organism concentrate.
The twelve C13-E6 LAE bottles were divided into three groups of four with one
bottle in each group serving as the abiotic control. One group received no
additional treatment and served as a control to assess the possible effects
associated with setting up the experimental procedure. The second group received
fresh organisms as discussed above. The bottles of the third group were drained
of half of their contents and to them was added an equal amount of 0.22 micron
filtered fresh Calico Creek water to determine if the plateau could be related to a
depletion of nutrients or other factors from the sample water.
The same parameters used in the biodegradation experiments were
measured in these experements on days 0, 1,4, 7, 10, 14, 21, and 28.
ISOLATION OF C12 LAS DEGRADING ORGANISMS
Microorganisms presumably capable of utilizing CI 2 LAS as a sole carbon
18
C12 LAS 250 ug/l*
Yeast extract 10 mg/l Agar 10 g/l deionized H20 pH adjusted to 7.5
* Filter sterilized through 0.22 micron membrane filter, added after autoclaving
other media constituents.
One ml of fresh Calico Creek water was inoculated onto the plates, and after
growth individual colonies were picked and transferred to liquid media of the same
composition as the solid media. Growth of the organisms was verified by the
AODC method. It can only be assumed that the organisms isolated were truly
19
LITERATURE REVIEW
Estuarine Biodearadatlon
Biodegradation of synthetic chemicals in estuarine environments has received
relatively little attention to date, primarily due to the complexity of generalizing phenomena in environments which have significant temporal and spatial variation, such as estuaries, and because of difficulties accessing study sites which may be located many hours from the laboratory. The advent of radioisotope methods for
studying evironmental systems (Pfaender and Bartholomew, 1982; Button et al.; and
Shimp and Young, 1987) has allowed more researchers to direct their attention
toward estuarine biodegradation with greater predictive abilities than in the past. This is due in part to the sensitivity and unequivocal nature of chemical fate data generated using radioisotopes in model environmental systems.
The majority of esutarine biodegradation studies have focused on chemicals of agricultural and industrial significance, as these chemicals are commonly
implicated in posing health and environmental risks. The biodegradation of
pesticides by estuarine water and sediment microorganisms has received the most
attention. Using ^''C labeled methyl parathion, Pritchard et al. (1987) found that
mineralization of this compound in estuarine water/sediment systems significantly
exceeded that in systems containing water only. It was concluded that
disappearance of methyl parathion was due to microbial activity since the compound
did not irreversibly sorb to sediments or degrade in abiotic controls. The more
substantial degradation of pesticides and other organic chemicals by organisms
associated with estuarine sediments in comparison to suspended bacteria has also
been noted by several other studies (Lee and Ryan, 1979; Walker et al., 1984;
20
degradation of some compounds such as hexachloraphene, DDE, and endosulfan
has been shown to be very slow or absent in sediment systems (Lee and Ryan,
1979; Walker et al., 1988). Whether this is due to toxicity of some compounds to sediment bacteria, absence of degrading organisms, or some environmental variable is unclear. The role of environmental conditions on the extent of degradation in estuarine sediments has been examined by Hambrick et al. (1980), who found that
microbial mineralization of petroleum hydrocarbons was greatest in the slightly basic
pH range and at high oxidation-reduction potentials (i.e. aerobic sediments).
Several studies have addressed the adaptation of estuarine microbial
communities to pollutants. Adaptation is often functionally defined as the observed
increase in biodegradation rate as a result of prior exposure of the community to
the chemical (Pfaender et al., 1985). Adaptation has been demonstrated with a
number of chemicals in geographically varied estuaries. It has been noted that lengthly adaptive periods may be necessary before some chemicals begin to be
appreciably degraded. Pfaender et al. (1985) studied the degradation of the
detergent builder nitrilotriacetic acid (NTA) in estuaries both exposed and unexposed
to NTA discharges. An adaptation period of 50 days was required before the onset of degradation at one unexposed site, while the exposed community rapidly
degraded NTA with no lag period and could adapt to degrade increased levels of NTA with only short lag periods. Chronic exposure of estuarine microbial
communities to low(ng/g) levels of aromatic hydrocarbons has been shown to
greatly enhance their degradation (Heitkamp and Cerniglia, 1987) compared to pristine sites with nonadapted populations. The results of Spain et al. (1980) and
Walker et al. (1984) show that adaptation of estuarine microbial communities may
be site specific and/or chemical specific. Spain et al. (1980; 1983) also report that
ͣ 21
and concluded that this is due to the absence of specific bacteria capable of metabolizing these compounds. However, these studies were conducted over relatively short time periods of a few days to several weeks, and other evidence indicates that adaptation may take considerably longer than a few weeks (Pfaender et al., 1985). It is clear from these reports that sufficient time must be allowed for an environmental community to adapt before concluding that no degraders are present or that a chemical will not degrade at a given concentration in a particular
estuary.
The influence of environmental variables on the biodegradation of organic
pollutants in estuaries has been examined by very few laboratories. Bartholomew and Pfaender (1983) looked at the spatial variation associated with the transition
from freshwater to estuarine to marine sites and its effect on biodegradation rates
for m-cresol, NTA, chlorobenzene, and trichlorobenzene. In general, degradation rates decreased going up the salinity gradient, and tended to dramatically decrease during winter periods, with the exception of the marine site, which tended to exhibit
low and constant rates year round. Similar findings are reported by Palumbo et al. (1988), who also studied the degradation kinetics of m-cresol and NTA across a
salinity gradient in the same ecosystem as Bartholomew and Pfaender, and
additionally from the Mississippi River and adjacent coastal waters. The authors
found that m-cresol uptake rates were greatest in the freshwater sites, and NTA
uptake was greatest in the estuarine site where bacterial numbers and activity were
highest. Both compounds were slower to degrade across all sites in the colder
months when bacterial activity is lowest. Interestingly, m-cresol degradation was more sensitive to environmental variation in temperature and salinity than was NTA. These findings suggest that physical/chemical characteristics of the environment and
^ 22
biodegradation study using natural samples. Factors such as salinity, temperature, concentration of the chemical, adaptive capacity of the microbial population, and many other elements interact to determine pollutant fate and must be considered
when evaluating biodegradation in environmental samples.
Surfactant Biodegradation
Interest in the biodegradation of surfactants originated in the 1950's and 60's when these compounds began to be noticeable in wastewaters and receiving waters as foam buildup occurred (Swisher, 1987; and Cain, 1976). The buildup of
surfactants was particularly troublesome to operators of wastewater treatment plants, who noted that excessive foaming created unsightly and unsafe conditions, as well as interfering with the rate of oxygen transfer in water, thus decreasing the
efficiency of aerobic treatment processes (Cain, 1976). The foaming problem was
found to be mainly due to the major surfactant in use at that time -- Alkylbenzene sulfonate (ABS). ABS was found to be exceeding resistant to microbial attack, primarily because the highly branched alkyl moiety physically interferes with enzymatic breakdown of the molecule (Swisher, 1987; Alexander, 1965).
Development of surfactants which were more easily degraded by microorganisms
soon began, and resulted in the development of linear alkylbenzene sulfonate (LAS), which has an unbranched alkyl moiety. LAS was found to be more
degradable and also functionally superior to ABS, and thus became one of the most
widely accepted synthetic surfactants (Swisher, 1987). Excellent reviews of the biochemistry, genetics, and methods of studying surfactant biodegradation by pure
cultures of microorganisms are provided by Swisher (1987), Cain (1976), and Willets
(1973).
23
examine the fate of these compounds initially in wastewater treatment processes,
under the assumption that if the chemicals were readily and extensively degraded, they should not pose a threat to the environment. The literature on surfactant
biodegradation in wastewater treatment generally falls into one of two categories:
that dealing with anionic compounds (primarily LAS), and that dealing with cationic
compounds (primarily the Quaternary Ammonium Compounds or QAC's).
Wastewater blodegradation of nonionics such as the linear alcohol ethoxylates used
in this study has not been significantly researched to date, although a great deal is known about the chemistry of LAE degradation by pure cultures (Swisher, 1987).
Because of the importance of LAS, researchers began to study its fate in
wastewater treatment models in order to classify it with regards to biodegradability.
A number of methods are available for these analyses, and Swisher (1987) has reviewed each in detail. One of the most widely used analytical methods for monitoring LAS degradation in waste treatment is the Methylene Blue Activated
Substance Test (MBAS). In the MBAS test, anionic surfactants form one to one ion
pairs with the dye methylene blue; the amount of undegraded surfactant remaining
is determined by extracting the ion pairs into organic solvent and measuring the dye
colorimetrically (Swisher, 1987). By comparing MBAS and TOC values for a
laboratory activated sludge unit, Janicke (1971) proposed that LAS should be
classed as only of medium biodegradability because resistant intermediates formed
during the course of degradation. The intermediates subsequently did not react
with methylene blue, leading to an overestimate of degradation, but TOC and UV
absorption (detects the aromatic nucleus) values indicated LAS was not highly
mineralized. The presence of recalcitrant intermediates was later substantiated by
Leidner et al. (1976) who identified the intermediates as various
24
questioned by Fitter and Fuka (1979), who reported an average of 64% degradation
in laboratory activated sludge, based on DOC disappearance and COD
measurements.
In contrast to the previous studies on LAS are those of Janicke and Hilge (1979), Steber (1979), and Swisher (1981), who find LAS to be extensively
degradable. Janicke and Hilge found that LAS was degraded to the extent of
95-97% in activated sludge when it was complexed with the cationic surfactant dialkyi
dimethyl ammonium chloride. Also, Steber demonstrated 80% ring mineralization in
activated sludge sewage plants with 3hr. retention times using ^^C ring labeled LAS.
Undegraded LAS represented 2-3% of the original radioactivity, and 15-25% was in the form of intermediates composed mainly of sulfophenylcarboxylic acids. It has been suggested that the reason for the low estimates of LAS ultimate degradation
proposed by some, and the wide variation reported in the literature is due mainly to
the selection of test method (Swisher, 1981). Chemical Oxygen Demand (COD)
and Dissolved Organic Carbon (DOC) analytical methods are somewhat nonspecific,
and will respond not only to LAS blodegradatlon intermediates but also to any other
organics which may present, leading to conservative estimates of ultimate
degradability.
Because cationic surfactants have a rather strong germicidal activity (Swisher, 1987), their fate in biological treatment is of obvious concern. Several laboratories
have reported DSDAC (distearyl dimethyl ammonium chloride) degradation of >90%
(May and Neufarht, 1976) in model sewage treatment models with no adverse
effects on biological activity (May and Neufarht, 1976; Gericke et al., 1978).
Extensive mineralization of C18-TMAC (Games et al., 1982) and
ditallowdimethylammonium chloride (DTDMAC) (Sullivan, 1983) by wastewater
25
tendency of QAC's to adsorb to wastewater solids; sometimes to the extent of
almost 100% within 30 minutes of initial exposure. Thus, removal of at least some cationic surfactants in activated sludge appears to be the result of both a sorptive process and biodegradation. However, the sorptive tendency must be controlled for
In a biodegradation study of QAC's in order to distinguish between removal due to
biodegradation and that due to sorption. From the work done to date on surfactant biodegradation in wastewater treatment systems, it can be concluded that anionic and cationic surfactants are readily degraded by wastewater microorganisms, and available evidence also suggests that nonionic surfactants are extensively removed
during wastewater treatment (Swisher, 1987).
Although synthetic surfactants typically undergo degradation and are
extensively removed in treatment systems, small quantities of the compounds still
reach the aquatic environment through treatment effluents (Larson et al., 1983).
Few studies have assessed the biodegradability of surfactants in the post waste treatment aquatic environment, and only a small proportion of these studies deal
with the estuarine environment. Aquatic research has primarily focused on
freshwater ecosystems, although some work has diverged into such areas as the
role of aquatic plants in harboring degrading microbes (Federle and Schwab, 1989).
Several studies have examined the fate of the benzene ring carbon of LAS.
Using environmentally realstic concentrations (ug/l), Larson and Payne found
70-80% of the LAS ring mineralized by indigenous river water microorganisms from
Rapid Creek, SD. Similar results are reported by Nielson and Huddleston (1981) in
experiments exposing LAS from simulated secondary waste treatment effluents to
additional microbial oxidation in a simulated receiving water. After 190 days, 98.5%
of the original LAS had been mineralized and the remaining label was determined
ͣ
26
earlier reports which suggested that recalcitrant aromatic intermediates impeded
complete LAS degradation (Leidner et ai., 1976). This apparent conflict is likely
due in part to the concentrations of LAS used in the studies. Early studies which
questioned LAS degradability in wastewater treatment were conducted at mg/l
concentration ranges, while Larson and Payne, and Neilsen and Huddleston used
more realistic environmental concentrations. Larson and Payne have even
suggested that LAS degradation by natural communities is hampered at
concentrations greater than 20mg/l, apparently due to microbial toxicity. As yet,
there is no evidence in the literature which points to the presence or accumulation in the environment of recalcitrant LAS intermediates produced by aquatic microbial
assemblages.
The fate of quaternary ammonium compounds has been studied in lake and
river ecosystems by Ventullo and Larson (1986) and Larson and Vashon (1983), respectively. Chronic exposure of lake microorganisms to ug/l levels of long chain (C12-C18) QAC's resulted in a significant adaptive response by the bacteria, which exibited an increase in number of cells and biodegradation capability. Although bacterial heterotrophic activity (as measured by glucose turnover time) was hindered
by short term chronic exposure to mg/l levels of QAC; the activity of cells exposed
to ug/l levels over long terms was not adversely affected, indicating the selection of
more tolerant bacteria within the community. River water microorganisms respond similarly to low levels of QAC's. Larson and Vashon report that degradation of
C16-C18 QAC's follows first order kinetics, and that although the QAC's readily sorb
to river sediments, the sorbed material was apparently quite available to degradative
organisms.
Larson and Games (1981) examined the kinetics of LAE degradation by Ohio
27-.
100ug/l, degradation was first order with respect to concentration and as much as
90% was respired in a matter of one to two weeks. Neither the ethoxylate nor
alkyl chain lengths had a significant effect on the extent or rate of degradation.
A comparison of biodegradation rates in natural river water samples was
compared to those predicted from laboratory screening tests by Larson (1983).
Biodegradation of C18-TMAC, LAS, NTA, and dioctadecyldimethylammonium
chloride (DODMAC) was examined in two standard biodegradability screening tests
using activated sludge as a source of microbes and 20-100mg/l test material, and
also in environmental samples using ug/l levels of ^"C labeled substrate. In general,
screening tests tended to underestimate the potential for degradation in the
environment, especially for the QAC's. Biodegradation rates in environmental
samples using realistic environmental concentrations were generally greater than corresponding rates in screening tests using high (mg/l) concentrations. Similar conservative estimates of QAC degradation rates based on screening tests have
been reported by Larson and Vashon (1983),and Larson and Wentler (1982),
indicating that care should be used when extrapolating from screening tests to environmental situations.
One of the only reports of ultimate degradation of some LAE's by
indigenous estuarine microorganisms was made by Vashon and Schwab (1982). They found rapid (alkyl chain carbon half life of 2.3 days) and extensive (>75%)
mineralization of ^"C labeled C16E3 and C12E9 LAE in waters from Escambia Bay,
Florida.
The literature dealing with biodegradation of detergent chemicals in estuarine environments is obviously quite limited. There is a pressing need for more
research in the area of microbial degradation of these and other compounds in
28
RESULTS AND DISCUSSION
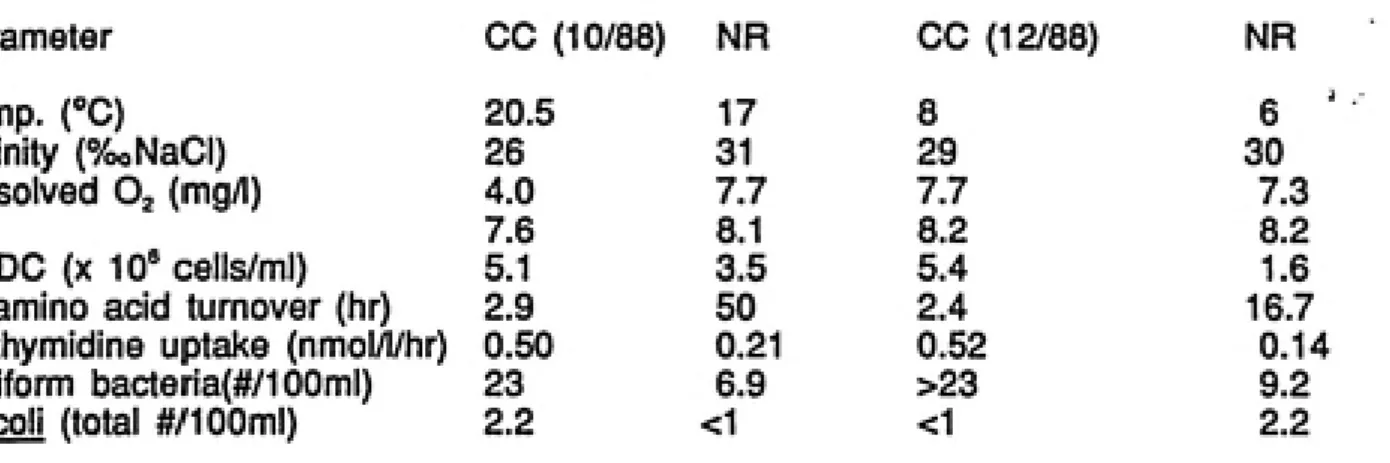
Background Environmental Data
Background environmental data for Calico Creek and North River at each
sampling date are shown in Table 3. This data was collected to characterize the
physical, chemical, and microbiological nature of the sampling sites, and to provide
reference points for comparing data collected over time.
As shown by the data, the North River site appears relatively less polluted; there are somewhat fewer bacteria, and the activity of the cells as measured by
amino acid turnover time and ^H-Thymidine uptake appears substantially lower,
suggesting an absence of significant anthropogenic contamination. Additionally,
measures of total conforms and E. coli point to domestic wastewater contamination
of the Calico Creek site, but not the North River site. The environmental
characteristics measured at Calico Creek vary only slightly over time, as might be
expected at a site subject to significant constant anthropogenic inputs. Calico
Creek samples collected in October 1988 are quite similar to those collected in
December 1988 when the weather was substantially colder. Microbial activity and numbers remained relatively constant, while dissolved oxygen and pH showed slight
increases in the December samples. At the North River site however, microbial
activity and numbers decreased somewhat in the December samples, as shown by
the amino acid turnover and thymidine uptake data. With the exception of
temperature, the other parameters remained essentially stable at the North River
site.
29
TABLE 3. Environmental supporting Data: Calico Creek and North River
Parameter CC (10/88) MR CC (12/88) MR
Temp. (X) 20.5 17 8 6 '
Salinity {%oNaCI) 26 31 29 30
Dissolved O2 (mg/l) 4.0 7.7 7.7 7.3
pH 7.6 8.1 8.2 8.2
AODC (X 10'cells/ml) 5.1 3.5 5.4 1.6
^H-amino acid turnover (hr) 2.9 50 2.4 16.7
^H-thymidine uptake (nmoi/l/hr) 0.50 0.21 0.52 0.14
Coliform bacteria(#/100ml) 23 6.9 >23 9.2
30
TABLE 4. Environmental Supporting Data: Salinity Gradient Sites
Parameter FW EST MAR
Temperature (°C) 28 30 27
Salinity (%oNaCI) 2 32 36
Dissolved Oj (mg/l) 5.5 4.6 5.0
pH 7.5 8.0 8.3
AODC (X 10^ cells/ml) 3.1 5.1 2.5
^H-amino acid turnover (hr) 5.9 5.9 3.2
^H-thymidine uptake (nmol/l/hr) 0.41 0.50 0.21
Coliform bacteria (total#/100ml) ND <1 <1
E. coli (total#/100ml) ND <1 <1
. •, 31
of detectable coliform bacteria at these sites suggests that they have not been
contaminated by domestic wastewater, and therefore should not have been exposed
to synthetic detergent compounds. Bacterial numbers as measured by AODC are
lowest at the marine site and highest at the midestuary site. Amino acid turnover
time and thymidine uptake indicate that the midestuary site also has the most
metabolically active microbial community, while the marine environment has the
least active community. The physical-chemical parameters are comparable between
sites. Dissolved O2 and temperature are similar, while pH increases as expected in the transition from freshwater to seawater.
Mass Balance of Added Radiolabel
The mass balance data were collected in order to establish the reliability of the biodegradation method used by accounting for as many potential fates of the radiolabeled substrate as possible. Table 5 contains example mass balance data for samples from the North River and Calico Creek taken in October 1988 for the
compounds LAS and C18 TMAC. Data for other compounds and sample dates is presented in Appendix A.
It is clear from Table 5 that a high percent of labeled LAS can be
accounted for as either material respired to CO2, incorporated into cell biomass, or
remaining in solution. These data were typical of that obtained for the other
compounds, except CI 8 TMAC, which showed a roughly 60% decrease in solution
counts after one day in Calico Creek-sediment samples. The label missing from
the mass balance was revealed to be sorbed to the sediment when sediment was
retrieved from the samples and counted for radioactivity. In general, the
biodegradation procedure was able to account for a high proportion of the added
32
TABLE 5. Example mass balance data for LAS and C18-TMAC from
impacted vs. unimpacted sites experiment of October 1988. Mass
balance data for all chemicals and experiments are found in Appendix A.
Average % of Initial label Accounted For
LAS C18-TMAC
Day NR NRS CC CCS NR NRS CC CCS
1 159 109.6 203 T33 ~ 121.6 115.2 111.9 114.9*
7 101.4 91.3 102.3 90.4 84.8 75.2 73.3 41.0 23 90.6 94.7 78.1 87.3 102.4 93.9 92.4 41.1
46 87.2 99.1 95.1 99.3 117.8 104.2 104.6 40.1
78 100.3 97.1 85.9 94.8 106.5 99.1 96.3 42.0
120 101 98.1 95.1 95.5 100.3 96.2 89.4 49.8
NR-North River CC-Calico Creek
NRS-NR with sediment CCS-CC with sediment
33
Biodaaraciation Experiments: Impacted vs. Unimpacted Sites
A basic question to be addressed by this research was whether exposure to
detergent chemicals through domestic wastewater effluents would result in an adapted community of degrader microorganisms in the sewage impacted Calico Creek environment compared to the North River, where the community should have
been minimally exposed.
Seven compounds were tested for their extent of biodegradation at the Calico Creek and North River sites during the fall of 1988. The compounds tested
represented four surfactants (LAS, C12-TMAC, C18-TMAC, and C13E6-LAE) and
three reference compounds (phenol, cellulose, and stearic acid). The data are
presented as percent respiration for samples with and without sediment for each
site and each chemical. Data regarding percent cellular uptake and percent
remaining in solution are found in Appendix A. Sediment addition allows determination of the effect on biodegradation of such factors as adsorption to sediment particles, contribution of organic matter or nutrients from the sediment,
and effect of additional microbial biomass introduced by the sediment.
Data for LAS degradation in Calico Creek and North River samples taken in October 1988 are shown in Fig. 3. It is apparent that LAS is degraded in Calico Creek with no discernable lag period, and no significant difference in rate between the system with sediment and that without. However, a slightly greater percent is respired in the sediment amended samples, perhaps due to organisms introduced
from the sediment.
35
CiSLAS DEGRADATION
100
90 80
70
60 K
•* c
« 50
0
S
0.
*0
JO
20
10
Incubation Days
100
c « u
180
36
and active in the Calico Creek, but is induced only after exposure to LAS in the
North River.
The major fate of the compound in all Calico Creek samples is respiration;
very little (generally less than 5%) is taken up into cell biomass. Similar data are
found for North River samples, and again, respiration appears to be the major fate,
with almost no cellular incorporation. Uptake of the compounds into cell biomass
was minimal for all the chemicals tested in these experiments on each date (see
Appendix A).
An interesting phenomenon appears in the results from these samples, which
will be seen with the other compounds as well, and that is a plateauing of
metabolism of the compounds to ^^COg before a major portion of the chemical has
been respired. This effect was unexpected, in that many researchers studying
biodegradation in other environments have recorded upwards of 90% respiration
(Vashon and Schwab, 1982; Larson and Games, 1981; Larson and Wentler, 1982).
A similar plateau at between 60-70% respired can be seen in the data of Larson
(1983), and Larson and Payne (1981), although no explanation for this effect was
proposed. Further experiments on this phenomenon and the nature of the
unrespired material were done in this study and will be discussed later.
Percent respiration data for C12-TMAC degradation in October 1988
samples are provided in Fig. 4. There is no apparent adaptation necessary in
either environment. Sediment addition appears to result in less of the compound
being respired in Calico Creek samples, perhaps due to some sorption, but makes
no difference in North River samples. The major fate of this compound is also
respiration, with little uptake into biomass. The initial peak of biomass incorporation
which decreases over time and is seen also in the data of other compounds may
i-;-*^'? -'
>("^-38
Ci2-TMAC DEGRADATION
c
s
o
CL
Incubatian Days
c
o
o
o
Q.
39
concentration declines due to metabolism. The patterns of C18-TMAC degradation
in samples from October 1988 differ from CI 2 in Calico Creek systems with
sediment (Fig. 5). Here, less degradation is observed, due to CI 8 sorption to
sediments and reduced availability to the organisms in the water column. The
mass balance presented in Table 3 suggests almost 60% of the C18-TMAC was
bound to the organic rich sediments. Assuming that the rest of the C18 is
available, then the microbial community respired approximately 60-75% of that,
which is similar to the samples without sediment and to previous patterns based on
the amount of substrate available. No discernable sediment sorption occurs in the
North River samples and degradation patterns here closely resemble Calico Creek
without sediment. As before, respiration is the primary fate, and biomass
accumulation is insignificant.
Data for biodegradation of C13E6-LAE in Calico Creek and North River
samples taken in October 1988 are shown in Fig. 6. There is little variation in LAE
degradation between samples with and without sediment and between sites. There
is also no need for adaptation with C13E6-LAE in either environment. The one
apparent difference between sites is that the plateau effect is more prominent in the
North River, with only 40-50% respired, compared to 60-70% in Calico Creek. This
may be related to the metabolic activity or numbers of organisms being lower in the
North River, as compared to Calico Creek.
The reference compounds used in this study are included for comparing
detergent chemical biodegradation data to that for chemicals that are common
pollutants.for which a large data base exists, or are naturally occurring compounds.
Data for the chemicals used in this study in the fall of 1988: phenol, stearic acid,
and cellulose, are shown in Figs. 7-9.
41
Ci8-TMAC DEGRADATION
100
uo 160
Incubation Days
1C0
c o o
i.
«
42
FIGURE 6. Respiration of C13E6 LAE in Calico Creek (top panel) and North
River (bottom panel). Expressed as % respired as C02.
43
C13-E6 DEGRADATION
Incubation Day*
100
«
Ql
120
45
PHENOL DEGRADATION
100
c s it
Incubation Days
120
100
c
o
u «
0.
Incubation aa/m
47
STEARIC ACID DEGRADATION
120
Incubaiion Days
100
c o «
Q.
49
CELLULOSE DEGRADATION
K
c
0.
100 120
Incubatian Day*
c o
u
0.
60
-120
50
need for adaptation, and most of the metatx)lism being respiration. The plateau,
however, is very pronounced in the North River, with degradation approaching only
50%.
Stearic acid, on the other hand, is rapidly and extensively mineralized to
almost 80% in the North River, but in Calico Creek metabolism is lower, especially
in sediment containing samples (Fig.8). The Calico Creek sediment may tend to sorb the stearic acid due to the sediment's organic rich nature.
Degradation of cellulose is shown in Fig. 9. Although metabolism is rapid
and there appears to be no difference between sites and presence of sediment;
degradation plateaus at less than 50%. Since the cellulose used was a
microcrystalline variety, the degradation may have been limited by the ability of the
organisms to have access to the nonsoluble cellulose.
In general, degradation of the reference compounds required no adaptation,
and respiration to COg was the major result of metabolism. Biodegradation of these
chemicals exibited the same overall trends as the detergent chemicals.
Aseaaannwnt of Biodegradation Variability with Time
In order to assess variability in biodegradation of the detergent compounds
over time, these experiments were repeated with LAS, LAE, C18-TMAC, and phenol
at 25 ug/l concentrations at the Calico Creek and North River sites in October of
1989. Rather than present the complete figure for each compound again, the data
is presented as biodegradation rates. First order biodegradation rate constants (KJ
were calculated for LAS, LAE. C12-Tf^AC, C18-TI\/IAC, and phenol for both the
October 1988 and 1989 experiments, and this data is presented in Table 6. The
first order rate constant is a useful summary parameter for comparing
Site(date) LAS LAB C12-TMAC Cia-TMAC 51
CC<10/88) 0. 029 0.299 0. 050 0.095
^ (.02-.037)
092-.506) (.04-. 061) 075-.114)
M
0. 012 0.346 0.021 0.038^ (ͣ -. 033-.057) 213-.479) (.017-.024) 028-.050)
NRS 0.014 0.542 0.026 0.046
(- 0002-.028) 199-.884) (.022-. 031) 035-.058)
CCS 0. 022 0. 033 0.023 0.033
( 017-.027) 023-.044) (. 018-.028) 013-.052)
CC(10/89) 0.027 0. 153 —— 0. 108
( 009-.045) 089-.216) 076-.139)
NR 0. 017 0. 093 — 0.049
(- 002-.037) 053-.132) 042-.057)
FV(10/89) — 0.067 — 0. 067
046-.088) 042-.091)
HST —
0. 159 — 0.076
111-.207) 038-.114)
MRH — " 0. 167 — 0. 046
086-.248) Oil-.082) CC(10/88) NR NRS Ics CC(10/89) NR FV(10/89) EST MRS CELLULOSE 0. 133 (.094-.172) 0. 075 (.064-.087) 0. 075 (. 060-.089) 0. 125 (.094-.156) PHENOL 0-. 191 (.144-.237) 0. 101 (.064-. 139) 0.252 (. 192-.311) 0.053 (.043-.064) 0. 182 (.129-.235) 0.205 (.118-.290) 0. 141 (.101-.180) 0.183 (.106-.261) 0. 112 (.055-. 170) STEARIC ACID 0.236 (. 197-.274) 0.248 (.188-.308) 0.258 (. 184-.332) 0. 100 (.079-.122)
TABLE 6. Blodegradatlon first order rate constants (Kl) Units are /day. 95% Confidence Intervals are
52
exception of LAE and phenol, the rates for the chemicals remain relatively constant
at each site over time.
Previous exposure of the community to the chemicals results in a consistently
higher rate (NR vs. CC) only in the case of LAS, and this trend is consistent from
one sampling date to the next. The increased rates in the Calico Creek samples
are probably the result of higher numbers of organisms and nutrient concentrations
In the sewage enriched waters.
Bioctoaradation Along a Salinity Gradient
In order to determine the effect on detergent chemicals of the many changing
physical, chemical, and biological properties of estuaries as the salinity increases,
experiments were carried out along a horizontal salinity gradient within the Newport
River estuary system. The sites were chosen to represent freshwater, mid-salinity
estuarine, and marine waters.
Background environmental data taken in June 1989 for the three sites of the
salinity gradient experiment are presented in Table 3. From the data it is apparent
that the sites chosen represent a reasonable gradient from freshwater to marine
salinity. Amino acid turnover and thymidine uptake data indicate that the marine
community is very active heterotrophically, but the freshwater and estuarine
communities are more actively dividing to form new cells. Palumbo and Ferguson
(1978), in a study using the Newport River Estuary, noted that marine waters tend
to have significantly fewer cells than do fresher waters. Temperature remains
relatively constant across the gradient, while pH and salinity increase across the
gradient.
Data for the respiration of three detergent chemicals (LAS, LAE, C18-TMAC)
53
results are shown In Figs. 10-12. Degradation of ail three chemicals was greatest
in freshwater and estuarlne samples. At the marine site, degradation was much
less extensive for C18-TMAC and LAE, and insignificant for LAS. The almost total
absence of l_AS degradation in marine waters Is Interesting. I_AS Is not mineralized
In these samples even after more than four months of incubation. There are several possible explanations for the absence of LAS degradation In the marine
samples. The marine microbial community may not have been Induced to degrade
LAS by the low concentration used In this study. Alternatively, LAS' mineralization
In marine waters may require a concerted attack by a consortium of more than one
organism. Removal of the alkyl portion of LAS may be carried out by one or more
organisms, while ring cleavage and utilization may be due to other organlsm(s). If
either part of the consortium were absent or inactive, it could result In no obsen/ed
LAS mineralization. The alkyl moiety of the LAS could have been partially
degraded in the marine samples, but would not have been detected here due to the
fact that the LAS used was labeled in the aromatic ring. Adaptation for the other
compounds shows a patternsimilar to Calico Creek and North River in not being
necessary at any of the sites. There appears to be a lag of about a month before
the estuarlne community begins to significantly mineralize LAS, which is somewhat
shorter than the period observed in North River, it may also be possible that the
high ionic strength of estuarlne and marine waters affects LAS' degradabillty; le.
complexatlon with Ca** and Mg** In seawater may hinder biodegradation at low
substrate concentrations (Shimp, 1989).
Phenol was used In this experiment as the sole reference compound. Its
mineralization pattern (Fig. 13) is not unlike that for the detergent chemicals, with
much greater degradation occumng in the freshwater and estuarlne environments
55
4
t
m
it
LAS DEGRADATION
C02 RESPIPATION (7/85>
a FRESH WATPR
Days
57
u
V
70
59
c • u «
ft.
20
61
62
First order rate constants for LAE, C18-TMAC, and phenol in freshwater,
midestuarine, and marine samples are shown in Table 6. The mideatuarine
samples tend to show the highest rates, and all three communities are slower to
degrade C18-TMAC than the other compounds. For LAE, the marine samples
show the most rapid rate of degradation, although typically marine communities
exibit slower rates compared to fresher waters. Swisher (1987) notes that some
bacterial enzymes may be more active at higher salt concentrations, but this has
not been studied in conjunction with surfactant biodegradation.
The plateau effect first noted in the impacted vs. unimpacted study is again
evident in the salinity gradient results. The plateau is seen with all compounds
except LAS, which shows an almost linear increase in percent respired even after
130 days of incubation. Perhaps the communities in the LAS fresh water and
estuarine samples have exibited an extremely long adaptaion period and would
have leveled off eventually. However, this would mean that incubation would
probably extend to six months or more, and the data would have to be viewed with
caution due to perturiDations caused by enclosing the community for such long
periods.
Nature of the Degradation Plateau and Residual Material
The observed plateau in biodegradation of the chemicals in this study raises
several questions about the cause of the plateau and the nature of the material left
in solution. Several experiments were designed to address the following questions
regarding the degradation plateau: 1. is it due to prolonged confinement of the
organisms (bottle effects); 2. Has the material in solution been metabolized to more
recalcitrant products; and 3. Has community metabolism simply stopped? and if so,
63
Since most of the incubations in this report were carried out over at least
several months duration, one obvious explanation for the observed plateaus is that
the microbial communities in the containers have few active or viable organisms.
Prolonged confinement may bias results because it terminates exchange of cells,
nutrients, etc., with the surrounding water.
Comparison of Calico Creek community activity after 180 days of incubation
with CI 2 LAS (Table 7) shows that although amino acid turnover time had more
than doubled, the organisms are still active. Calculation of ^*C MPN of LAS
degraders suggest that LAS degrading organisms are still present and have not
been eliminated from the samples.
Results of experiments to determine the nature of the unmetabolized residual
material are presented in Figs. 14-15 for LAS and LAE from Calico Creek samples.
Several possible alternative explanations for the plateau were considered: a
concentration threshold had been reached, below which no degradation occurs; too
few degrading organisms remained to significantly remove the compounds; and
confinement had resulted in the depletion of some necessary constituent(s) found in
the site water.
For LAS, concentration thresholds were apparently not a factor, as addition of
unlabeled LAS failed to stimulate ^"COg production. Addition of fresh organisms
from Calico Creek or filtered fresh Calico Creek water also failed to stimulate