R E S E A R C H A R T I C L E
Open Access
Understanding how perceptions of tobacco
constituents and the FDA relate to effective
and credible tobacco risk messaging:
A national phone survey of U.S. adults,
2014
–
2015
Marcella H. Boynton
1,2, Robert P. Agans
3,4, J. Michael Bowling
1,2,3,4, Noel T. Brewer
1,2, Erin L. Sutfin
6,
Adam O. Goldstein
2,5, Seth M. Noar
2,7and Kurt M. Ribisl
1,2*Abstract
Background:The passage of the 2009 Family Smoking Prevention and Tobacco Control Act has necessitated the execution of timely, innovative, and policy-relevant tobacco control research to inform Food and Drug
Administration (FDA) regulatory and messaging efforts. With recent dramatic changes to tobacco product availability and patterns of use, nationally representative data on tobacco-related perceptions and behaviors are vital, especially for vulnerable populations.
Methods:The UNC Center for Regulatory Research on Tobacco Communication conducted a telephone survey with a national sample of adults ages 18 and older living in the United States (U.S.). The survey assessed regulatory relevant factors such as tobacco product use, tobacco constituent perceptions, and tobacco regulatory agency credibility. The study oversampled high smoking/low income areas as well as cell phone numbers to ensure adequate representation among smokers and young adults, respectively. Coverage extended to approximately 98 % of U.S. households.
Results:The final dataset (N= 5,014) generated weighted estimates that were largely comparable to other national demographic and tobacco use estimates. Results revealed that over one quarter of U.S. adults, and over one third of smokers, reported having looked for information about tobacco constituents in cigarette smoke; however, the vast majority was unaware of what constituents might actually be present. Although only a minority of people reported trust in the federal government, two thirds felt that the FDA can effectively regulate tobacco products. Conclusions:As the FDA continues their regulatory and messaging activities, they should expand both the breadth and availability of constituent-related information, targeting these efforts to reach all segments of the U.S.
population, especially those disproportionately vulnerable to tobacco product use and its associated negative health outcomes.
Keywords:Tobacco use, Constituents, Cigarette smoking, Non-cigarette tobacco product, Communication
* Correspondence:[email protected]
1Department of Health Behavior, Gillings School of Global Public Health, University of North Carolina at Chapel Hill (UNC), CB #7440, Chapel Hill, NC 27599-7440, USA
2Lineberger Comprehensive Cancer Center, UNC, CB #7295, Chapel Hill, NC 27599-7295, USA
Full list of author information is available at the end of the article
Background
Tobacco use is the leading cause of preventable death and disease in the United States (U.S.). Morbidity from smoking-related causes is estimated at more than 480,000 deaths per year, which account for 1 out of 5 deaths in the U.S. [1] Cigarettes, the most commonly used tobacco product by adults, have been causally linked with numer-ous negative health outcomes, including multiple types of cancer, cardiovascular disease, respiratory ailments, and infection [2]. Although the underlying causes are not wholly clear, members of certain stigmatized and vulner-able groups in the U.S., such as those living in poverty and sexual minorities, are disproportionately affected by these negative tobacco-related consequences [3–5]. One of the major reasons cigarettes are harmful to health is the pres-ence of myriad harmful and potentially harmful constitu-ents in cigarette smoke, many of which are known toxicants or carcinogens [6].
Due to local, state, and national education and policy efforts, cigarette smoking has precipitously decreased from over 42 % of the adult population in 1965–17 % in 2014 [7, 8]. In recent years, declines in cigarette smoking have been somewhat offset by increases in use of non-cigarette tobacco products (NCTPs), with the greatest uptake primarily observed for adolescents and young adults [9, 10]. Some NCTPs, such as cigars, have long been available to the public and are a known health hazard. [11] Other products, such as electronic vaping devices, are relatively novel, and as a result have un-known consequences for public health [12]. A grow-ing body of evidence is findgrow-ing that, like cigarettes, many NCTPs contain harmful and potentially harmful constituents [11, 13, 14]. Considering the substantial health harms of cigarette and NCTP use, more re-search is needed to inform effective tobacco regula-tory and communication efforts.
Tobacco policy and communication
In 2009, the landmark passage of the Family Smok-ing Prevention and Tobacco Control Act (FSPTCA) granted the Food and Drug Administration (FDA) the power to regulate tobacco products (Public Law 111–31). Since the passage of the FSPTCA, the FDA has enacted and enforced multiple regulations re-lated to the marketing, manufacturing, and distribu-tion of cigarettes, certain cigarette-related products, and smokeless tobacco. [15] On May 5, 2016 the FDA expanded their regulatory authority to include additional tobacco products, including electronic cig-arettes, hookah, and cigars [16, 17]. As part of their tobacco control efforts, the FDA has implemented education campaigns intended to increase the pub-lic’s awareness of the potential health harms of to-bacco product uptake and use [18].
Many of the tobacco regulatory and education activities performed by the FDA include messaging and communica-tion elements. For example, Seccommunica-tions 904(d) and (e) of the FSPTCA requires the FDA to publish a list of harmful and potentially harmful constituents for each tobacco product, by quantity within each brand and subbrand, in a format that is both understandable and not misleading [19]. Prior research using an online convenience sample of U.S. adults found that although a few tobacco product constituents were familiar to the public (e.g., nicotine, carbon monox-ide), the majority of constituents, such as acrolein and tobacco-specific nitrosamines, were generally unknown [20]. Recent qualitative research has not only replicated the finding that the public is largely unaware of the presence of the majority of tobacco constituents in tobacco product smoke or aerosol, but when presented with such informa-tion people would often infer meaning and potential harms by relating constituent names to similar-sounding words (e.g., acetaldehyde sounds similar to acetamino-phen) [21, 22]. Given that so many constituent names are foreign to the average person, additional research exploring the public’s awareness and interest in tobacco constituents is needed to inform whether and how the FDA might best communicate constituent-related information [23].
With the FDA now serving in a pivotal role of com-municating the potential harms of tobacco product use, it is essential to understand how both tobacco product users and non-users perceive the credibility of the FDA and U.S. government. Given the tobacco industry’s docu-mented targeting of adolescents and other vulnerable groups with potent marketing campaigns [24–26], it is also incumbent upon the FDA to develop and imple-ment messaging optimized to effectively communicate the risks of tobacco use to these populations. Notably, a number of groups most affected by tobacco use and its associated health outcomes have also historically ex-perienced mistreatment by government organizations; examples include individuals with lower levels of educa-tion and health literacy, those living in poverty, and sex-ual minorities [27–30]. Effective risk messaging and product labeling from credible information sources will help ensure that the public, especially vulnerable po-pulations, adequately understand the risks of both tobacco product use and the presence of harmful and potentially harmful constituents.
The current study
paper reports the methods and sample characteristics from this national phone survey. We compare our demographic and tobacco use estimates to other validated national esti-mates in order to assess whether our weighted sample is nationally representative. Additionally, we examine the responses for several of the constituent and credibility-related items, discussing the implications of the overall esti-mates as well as differences observed for certain key groups. Taken together the findings lay a foundation for future empirical work that directly informs how perceptions of tobacco constituents and the FDA relate to effective and credible tobacco risk messaging.
Method
Survey measures
Development
Using an iterative survey question generation and revision procedure coordinated among three semi-independent projects, the team developed an instrument assessing tobacco-related product use and perceptions, demo-graphic characteristics, general health, and government organization-related credibility and messaging percep-tions. Cognitive interviewing was used at various stages of the measures development process to assess the clarity and construct validity of all new measures.
Translation
Because English and Spanish are the two most com-monly spoken languages in the U.S. [31], the team developed and administered survey measures in both languages. A dual language translation and validation approach was employed using double measures transla-tion with harmonizatransla-tion and validatransla-tion. Specifically, two professional bilingual translators of differing national origins each independently translated the English lan-guage measures. A third fluent Spanish speaker, who served as the translation coordinator and primary measures reviewer, then met with the two translators; through discussion a final version of the Spanish lan-guage measures was produced based on the two inde-pendent translations. This measures harmonization approach ensured that the Spanish language word usage and syntax was equally accessible to individuals of all Latino and Spanish backgrounds.
Testing
After the wording and order of the survey questions was finalized, a pilot test of the proposed survey instrument was implemented between August 5 and August 18, 2014. Several independent and non-overlapping conveni-ence samples were used in the pilot (N= 151). To over-sample smokers, half of the over-samples targeted low income households earning less than $25,000 per year. To boost the number of participants in the pilot who
identified as gay, lesbian, or bisexual (GLB), a conveni-ence sample of eleven individuals identifying as GLB were recruited and called as a special batch to test the programming specific to GLB participants. Oversam-pling of young adults (18–25 years of age) occurred within the household through the application of Poisson sampling techniques where they held higher probabilities of selection. The results of the pilot test were used to inform minor survey item revisions and confirm the accuracy of the survey programming.
Tobacco use measures
To maximize the fidelity of the tobacco use measures in this study to other national surveys of tobacco product use, many of the tobacco product-related items were taken directly from the Behavioral Risk Factor Surveillance System (BRFSS) questionnaire [32] or from the Population Assessment of Tobacco and Health (PATH) Study [33]. Individuals were classified as current cigarette smokers if they reported having previously smoked at least 100 cigarettes (i.e., five packs) in their lifetime and were currently smoking some days or every day. Smokers were asked about their past 30 day smoking frequency (number of days), menthol cigarette use (none, some, or all ciga-rettes), cigarette type (e.g., regular, light, ultralight), typical brand (if any), and quit intentions (0 =not planning to quit
to 3 =within the next month).
Non-cigarette tobacco product (NCTP) use was also assessed, with descriptions of the various NCTPs provided to respondents. If individuals indicated ever use of a particular NCTP, they were subsequently queried on their frequency of use in the past 30 days. For the current analyses NCTP use is defined as past 30 day use of any of the following: electronic cigarettes or vaping devices, little cigars or cigarillos, hookah, chewing tobacco, snus, pre-mium cigars, or any other tobacco product. Any tobacco use was defined as past 30 day NCTP use or an individual reporting cigarette smoking some days or every day.
Tobacco constituent measures
questions for one panel (see Appendix A for the list of constituents by panel).
FDA credibility
Multiple items related to FDA credibility were also administered. Participants were asked whether they had ever heard of the FDA and whether they felt the FDA could
“effectively regulate tobacco products.” Because sampling efforts were particularly targeted to groups who have his-torically have been marginalized or exploited by certain U.S. governmental and other authoritative bodies, we also assessed general trust in the government using the item:
“How much trust do you have in the federal government?” Responses ranged from 0 =none at allto 4 =a great deal.
Demographics
Characteristics such as gender, age, ethnicity, education, income were assessed primarily using measures from the 2013 BRFSS survey [31] or the 2010 U.S. Census [34]. Race was assessed using the item, “Which one of these groups would you say best represents your race: White, Black or African American, American Indian or Alaska Native, Asian, or Pacific Islander?” Individuals strongly identifying as an unlisted or mixed race were coded as
“Other.” Education was assessed using an ordinal scale ranging from 0 =no schooling completed to 15 = doctor-ate degree. Numeracy was assessed using a single item adapted from a standard numeracy scale [35]: “In gen-eral, which of these numbers shows the biggest risk of getting a disease: 1 in 100, 1 in 1000, or 1 in 10?” Pov-erty level was determined using the household size and income reported by the respondents and applying the federal poverty numbers available from the U.S. Depart-ment of Health and Human Services in 2014. The sexual orientation measure was developed using guidelines pro-vided by the Williams Institute [36], which asked “Do you consider yourself to be (A) straight or heterosexual, (B) gay or lesbian, or (C) bisexual?”
Sampling and recruitment
Two independent and non-overlapping random digit dial-ing frames were used in this study with approximately 98 % coverage of all U.S. adult households [37]. To oversample smokers, both frames were stratified by household income and smoking rates at the county-level, where the poorest counties with the highest smoking rates were oversampled. Concordant with prior national tobacco survey studies [38], we oversampled cell phones numbers to maximize counts of young adults. To be considered eligible, a tele-phone number needed to reach a household with an Eng-lish- or Spanish-speaking resident 18 years of age or older. Within the landline frame, if more than one eligible adult resided in the household, young adults and smokers were sampled at a higher rate than older adult nonsmokers.
The national survey was conducted between September 15, 2014 and May 31, 2015 and had an average completion time of 25 min. Calls were made Saturday through Thurs-day between 9 am and 9 pm (local time). Blaise CATI soft-ware [39] was used to both manage the sample and collect the data. No numbers were removed from calling until a minimum of 6 (cell phone) to 8 (landline) unsuccessful call attempts were made with at least one weekend, evening, and daytime call attempt. The sample resulted in 5,014 in-terviews and a weighted response rate (calculated using AAPOR Response Rate 4) of 42 %, a rate which is comparable to the 2012–2013 National Adult Tobacco Sur-vey (44.9 %) [40] and the 2012 BRFSS (45.3 %) [41]. The remaining sample consisted of ineligible numbers (64,410), refusals from eligible households (2,623), or indeterminable eligibility status (41,877). All interviewers completed gen-eral and project-specific training before conducting the surveys and were monitored twice fortnightly. In-formed consent for participation in the study was ob-tained verbally from respondents at the time of enrollment. The IRB at the University of North Caro-lina approved all study procedures and respondents were protected by a certificate of confidentiality.
Sampling weights and adjustments
A standard three-step sample weighting procedure was followed to produce sampling weights [42]. The base weights were computed using the sampling rate for tele-phone numbers in each stratum, adjusting for the number of eligible respondents and landline telephone numbers in the household as well as any oversampling of young adults and/or smokers that might have occurred in the landline sample (Step 1). The base weights were then adjusted for differential household-level nonresponse among sampling strata using the inverse of the stratum-specific household-level response rate as the adjustment factor (Step 2). The nonresponse-adjusted household sample weight was then calibrated to population counts as estimated from the American Community Survey [34] sample by implementing the SAS rake and trimming macro [43] on the following variables: census region, age (18–24, 25–44, 45–64, or≥65), education (≤high school, some college, or bachelor’s degree and higher), gender, ethnicity (Hispanic or non-Hispanic), phone-type (cell or landline) and regional smoking rates. Final weights were normalized to the total sample size [44].
Analysis
adults) employed the BY command for the PROC SURV EYMEANS procedure and the TABLE command for the PROC SURVEYFREQ procedure. Weighted analyses of intra-group differences for categorical variables (i.e., com-parisons between smokers vs. non-smokers, young adults vs. older adults, etc.) employedχ2tests using the CHISQ command. For the continuously scaled trust in the federal government variable, means were generated using PROC SURVEYMEANS and intra-group comparisons were made using PROC SURVEYREG.
Results
Demographics
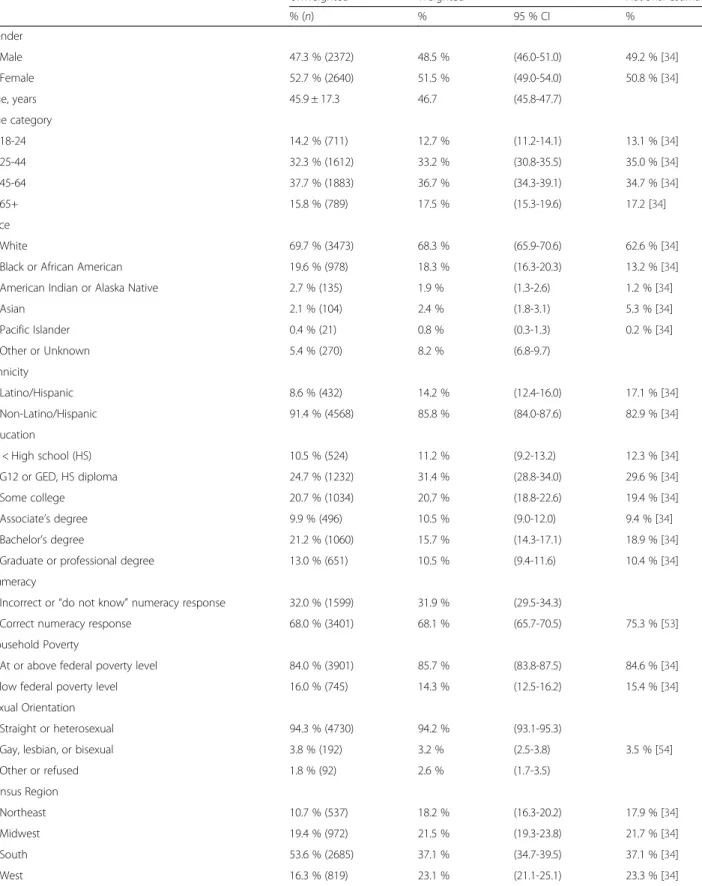
Examination of the weighted estimates revealed a weighted proportion of 50.8 % females and an age range of 18 to 95 years (M= 45.9,SD= 17.3). The two largest racial groups in this sample were White (68.3 %) and Black/African American (18.3 %). Approximately 14 % of the sample iden-tified as Latino or Hispanic. Young adults (i.e., individuals aged 18–24) comprised 12.7 % of the sample and, based on reported household size and annual income, 14.3 % of the sample was identified as living below the U.S. federal pov-erty line. In addition, 3.2 % of the sample identified as GLB.
In order to assess the quality of our sampling design we compared this study’s weighted demographic esti-mates to comparable national point estiesti-mates, thereby providing a sense of the relative “representativeness” of our weighted sample. As can been seen in Table 1, across a wide range of demographic factors the majority of estimates from other national surveys or the U.S. Census fall within the 95 % confidence intervals (CI) of the sample’s weighted point estimates. The only note-worthy exceptions were race and ethnicity, which slightly overestimates the proportions of Whites and African Americans and slightly underestimates the proportions of Asians and Latinos. In each case, the difference be-tween the national estimate and the relevant confidence interval bound was no more than 3.5 percentage points.
Tobacco product use
As a result of the oversampling strategy employed in this study, smokers represented 23.0 % (N= 1151) of the unweighted sample; however, at 17.8 % the weighted smok-ing prevalence for the entire sample was effectively identical to the national prevalence estimate (see Table 1). The na-tional estimate for any tobacco product use (25.2 %), which encompassed both cigarette and NCTP use, was within one percentage point of the lower bound of the 95 % CI for our estimate of 28.4 % [40]. Table 2 presents the weighted pro-portion of smokers for key demographic characteristics. Most of the estimates for our sample fell within the CIs of the U.S. Census or other national estimates, with the re-mainder falling within 2 percentage points of either the upper or lower confidence bound.
Consistent with the literature, smoking rates were notably higher for respondents reporting less education, low liter-acy, and living below the federal poverty line. Further-more, cigarette smoking was relatively higher for GLBs, Native Americans, and NCTP users, a finding also con-cordant with prior research [8]. The only notable differ-ences between our estimates and other national estimates of tobacco use were among Black (vs. White) and Latinos (vs. non-Latinos), which were modestly overestimated.
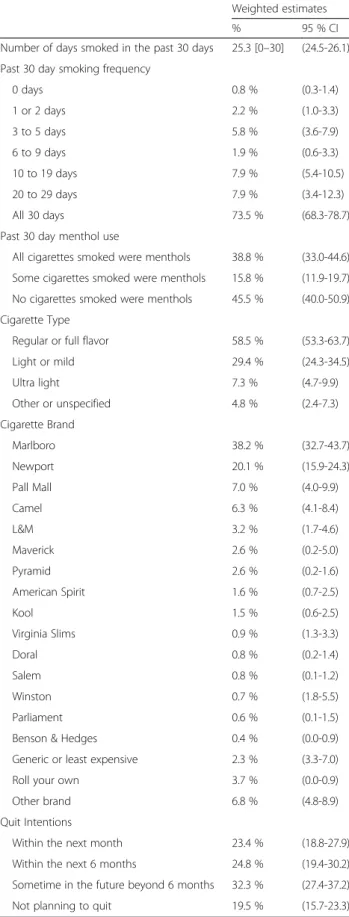
Table 3 presents cigarette use characteristics for the smokers. The majority (73.5 %) reported smoking every day in the past 30 days. A little over a third of respon-dents (38.8 %) reported only smoking menthols in the past 30 days, and another 15.8 % smoked some menthols during that time. Regular or full flavor cigarettes were the most commonly smoked type (58.5 %), followed by light or mild, (29.4 %). The Centers for Disease Control and Prevention (CDC) estimates for the top four cigarette brands in the U.S. are 41 % Marlboro, 12 % Newport, 8 % Pall Mall, and 8 % Camel [45]. Our weighted estimates were largely equivalent: Marlboro, 38.2 %, CI [32.7, 43.7], Newport, 20.1 %, CI [15.9, 24.3], Pall Mall, 7.0 %, CI [4.0, 9.9], and Camel, 6.3 %, CI [4.1, 8.4]. Notably, a majority of smokers (81.5 %) reported planning to quit sometime in the future.
Differences in constituent and FDA-related perceptions by vulnerable groups
Constituent information
Table 4 presents tobacco constituent communication find-ings. More than a quarter of adults (27.5 %) reported hav-ing looked for information on tobacco constituents. Of those, higher proportions of smokers (34.3 %) and young adults (37.2 %) had previously looked for this information, as compared to non-smokers (26.1 %,p= .004) and older adults (26.0 %,p< .0001), respectively. A smaller propor-tion of individuals with low educapropor-tion reported having previously looked for information on tobacco constituents (22.2 %) as compared to those with greater educational at-tainment than a high school diploma (31.5 %,p< .0001).
When asked where they would most like to see infor-mation on tobacco constituents, over half indicated that they would prefer it on cigarette packs (54.8 %) and an-other quarter most wanted the information available on-line (28.7 %). There was no difference between smokers and non-smokers for information location preference; however, as compared to older adults (27.4 %), a higher proportion of young adults preferred that constituent in-formation be available online (38.2 %,p= .0003).
Table 1Demographic characteristics as compared to U.S. Census and other national surveys, CRRTC national adult (≥18 years) phone survey 2014-2015
Unweighted Weighted National estimate
% (n) % 95 % CI %
Gender
Male 47.3 % (2372) 48.5 % (46.0-51.0) 49.2 % [34]
Female 52.7 % (2640) 51.5 % (49.0-54.0) 50.8 % [34]
Age, years 45.9 ± 17.3 46.7 (45.8-47.7)
Age category
18-24 14.2 % (711) 12.7 % (11.2-14.1) 13.1 % [34]
25-44 32.3 % (1612) 33.2 % (30.8-35.5) 35.0 % [34]
45-64 37.7 % (1883) 36.7 % (34.3-39.1) 34.7 % [34]
65+ 15.8 % (789) 17.5 % (15.3-19.6) 17.2 [34]
Race
White 69.7 % (3473) 68.3 % (65.9-70.6) 62.6 % [34]
Black or African American 19.6 % (978) 18.3 % (16.3-20.3) 13.2 % [34]
American Indian or Alaska Native 2.7 % (135) 1.9 % (1.3-2.6) 1.2 % [34]
Asian 2.1 % (104) 2.4 % (1.8-3.1) 5.3 % [34]
Pacific Islander 0.4 % (21) 0.8 % (0.3-1.3) 0.2 % [34]
Other or Unknown 5.4 % (270) 8.2 % (6.8-9.7)
Ethnicity
Latino/Hispanic 8.6 % (432) 14.2 % (12.4-16.0) 17.1 % [34]
Non-Latino/Hispanic 91.4 % (4568) 85.8 % (84.0-87.6) 82.9 % [34]
Education
< High school (HS) 10.5 % (524) 11.2 % (9.2-13.2) 12.3 % [34]
G12 or GED, HS diploma 24.7 % (1232) 31.4 % (28.8-34.0) 29.6 % [34]
Some college 20.7 % (1034) 20.7 % (18.8-22.6) 19.4 % [34]
Associate’s degree 9.9 % (496) 10.5 % (9.0-12.0) 9.4 % [34]
Bachelor’s degree 21.2 % (1060) 15.7 % (14.3-17.1) 18.9 % [34]
Graduate or professional degree 13.0 % (651) 10.5 % (9.4-11.6) 10.4 % [34]
Numeracy
Incorrect or“do not know”numeracy response 32.0 % (1599) 31.9 % (29.5-34.3)
Correct numeracy response 68.0 % (3401) 68.1 % (65.7-70.5) 75.3 % [53]
Household Poverty
At or above federal poverty level 84.0 % (3901) 85.7 % (83.8-87.5) 84.6 % [34]
Below federal poverty level 16.0 % (745) 14.3 % (12.5-16.2) 15.4 % [34]
Sexual Orientation
Straight or heterosexual 94.3 % (4730) 94.2 % (93.1-95.3)
Gay, lesbian, or bisexual 3.8 % (192) 3.2 % (2.5-3.8) 3.5 % [54]
Other or refused 1.8 % (92) 2.6 % (1.7-3.5)
Census Region
Northeast 10.7 % (537) 18.2 % (16.3-20.2) 17.9 % [34]
Midwest 19.4 % (972) 21.5 % (19.3-23.8) 21.7 % [34]
South 53.6 % (2685) 37.1 % (34.7-39.5) 37.1 % [34]
the low educational attainment (p< .0001) and low nu-meracy groups (p= .02), with over 75 % of both sub-groups not aware of more than 1 constituent in their survey panel being present in cigarette smoke.
FDA credibility
The vast majority of U.S. adults (94.6 %) reported having heard of the FDA, although awareness was lower for young adults (90.9 %,p= .007), those with low education (89.7 %,
p< .0001), those with low numeracy (91.7 %, p= .0009), and those living in poverty (87.5 %,p< .0001). The majority of both smokers (66.6 %) and non-smokers (65.0 %) be-lieved that the FDA can effectively regulate tobacco prod-ucts. The proportions of people endorsing effective FDA tobacco product regulation were even higher for young adults (79.3 %, p< .0001) and GLBs (76.3 %, p= .04). Of note, young adults were much more likely to identify as GLB as compared to older adults,χ2(1) = 21.5,p< .0005.
In stark contrast to the relative support of the FDA, less than half of U.S. adults (42.9 %) reported feeling some trust in the federal government (i.e., a rating of 3 =a fair amount
or 4 =a great deal). On average, smokers reported less trust in the federal government (M= 1.7) as compared to non-smokers, (M= 2.0,p< .0001). Additionally, individuals living in poverty had greater trust in the government (M= 2.2) as compared to those not living in poverty, (M= 2.0,p= .004).
Discussion
The passage of the 2009 FSPTCA promised to usher in a new era in tobacco regulation that has enormous implications for improving public health. The funding of 14 TCORS is an important advancement in the field of tobacco regulatory science, with the national phone survey detailed herein offering relevant and timely data that can inform FDA policy and messaging efforts. The survey had a response rate of 42 %, which is on par with other national tobacco surveys. We found that our weighted tobacco use estimates mirrored CDC estimates and U.S. demographic estimates largely fell within the confidence bounds of our sample’s weighted esti-mates. These finding indicate that our sample weights appro-priately adjusted our estimates to reflect those of the U.S.
population. These encouraging findings pave the way for additional analyses of data from this dataset, especially as relevant to perceptions of tobacco product constituents, FDA credibility, and tobacco communication.
Because tobacco product marketing and tobacco-related health outcomes disproportionally impact younger and marginalized communities as well as those with a history of tobacco use, we chose to strategically oversample indi-viduals from these groups. Comparisons between the un-weighted and un-weighted estimates in Table 1 showed that we successfully oversampled smokers and young adults as well as achieved comparable proportions for individuals with low educational attainment and those living in pover-ty—a noteworthy achievement given that these groups tend to be under-represented in national surveys [46]. By obtain-ing robustly sized sub-samples, it was possible to generate stable group estimates for key groups on a number of to-bacco constituent and FDA credibility-related perceptions.
Examination of the constituent-related measures showed that the majority of the U.S. public would like ready access to tobacco constituent information. In fact, our results reveal that groups one might presume to be the least psy-chologically motivated to search for tobacco constituent information, young adults and smokers, weremostlikely to say that they had previously looked for this information. Moreover, more than 80 % of U.S. smokers report in-tending to eventually quit smoking, suggesting that many smokers are in the contemplation stage of behavior change and would therefore benefit from greater access to constitu-ent information [47]. Taken together, these findings indicate that the legislatively mandated publication of tobacco con-stituent information is of great interest to the public, and if executed well, could improve public health. Our results also showed that different groups may prefer different channels of information. For example, older adults pre-ferred constituent information on cigarette packs whereas young adults equally preferred it on packs and online. Given these results, the FDA may want to consider making con-stituent information available through multiple channels.
Although nearly one third of U.S. adults have actively sought out information about tobacco constituents, the
Table 1Demographic characteristics as compared to U.S. Census and other national surveys, CRRTC national adult (≥18 years)
phone survey 2014-2015(Continued)
Tobacco Product Use
Any tobacco product use, past 30 days 32.6 % (1633) 28.4 % (26.2-30.6) 25.2 % [40]
No tobacco product use, past 30 days 67.4 % (3381) 71.6 % (69.4-73.8)
Current cigarette smoking
Current smoker 23.0 % (1151) 17.8 % (16.0-19.6) 18.0 % [40]
Non-smoker 77.0 % (3856) 82.2 % (80.4-84.0)
Used≥1 NCTP in past 30 days 20.4 % (1022) 18.6 % (16.7-20.5)
[34] US Census 2013–2014 [53]; Galesic & Garcia-Retamero (2010) [54]; Gallup 2013 LGBT poll [40]; CDC’s National Adult Tobacco Survey, Tobacco Product Use
Table 2Percentage of smokers by selected demographic characteristics, CRRTC national adult (≥18 years) phone survey 2014-2015
Weighted National estimate
% 95 % CI % 95 % CI
Gender
Male 18.6 % (16.1-21.1) 18.8 % (18.0-19.7)
Female 17.0 % (14.4-19.7) 14.8 % (14.0-15.7)
Age category
18-24 15.4 % (11.6-22.4) 16.7 % (14.0-19.3)
25-44 22.3 % (18.7-26.0) 20.0 % (19.1-21.0)
45-64 19.5 % (16.4-22.5) 18.0 % (17.0-19.1)
65+ 7.8 % (5.0-10.5) 8.5 % (7.7-9.3)
Race
White 17.6 % (15.4-19.8) 18.2 % (18.6-20.2)
Black or African American 21.6 % (16.7-26.4) 17.5 % (16.1-18.8)
American Indian or Alaska Native 26.7 % (12.9-40.4) 29.2 % (19.7-38.7)
Asian 6.5 % (2.1-10.9) 9.5 % (7.7-11.2)
Pacific Islander
Other or Unknown 16.6 % (10.7-22.4) 26.8 % (21.9-31.8)
Ethnicity
Latino/Hispanic 18.7 % (16.7-20.7) 11.2 % (11.0-13.2)
Non-Latino/Hispanic 12.7 % (8.7-16.7)
Education
< High school (HS) 25.8 % (18.7-32.8) 22.9 % (21.3-24.5)
G12 or GED, HS diploma 21.9 % (18.2-25.6) 21.7 % (20.3-23.0)
Some college 22.3 % (17.6-27.1) 19.7 % (18.3-21.1)
Associate’s degree 17.4 % (12.6-22.2) 17.1 % (14.5-19.6)
Bachelor’s degree 8.2 % (5.9-10.4) 7.9 % (7.1-8.8)
Graduate or professional degree 3.5 % (1.8-5.2) 5.4 % (4.5-6.3)
Numeracy
Incorrect or“do not know”numeracy response 21.4 % (18.0-24.7)
Correct numeracy response 16.1 % (13.9-18.3)
Household Poverty
At or above federal poverty level 15.4 % (13.5-17.3) 15.2 % (14.6-15.9)
Below federal poverty level 29.3 % (23.9-34.7) 29.2 % (27.5-31.0)
Sexual Orientation
Straight or heterosexual 17.5 % (15.7-19.4) 17.6 % (16.9-18.2)
Gay, lesbian, or bisexual 24.4 % (16.1-32.6) 26.3 % (24.6-28.1)
Other or refused 18.8 % (3.1-34.5)
Census Region
Northeast 16.9 % (12.2-21.7) 15.3 % (13.9-16.7)
Midwest 20.6 % (15.8-25.4) 20.7 % (18.9-22.4)
South 19.2 % (16.5-21.9) 17.2 % (16.3-18.1)
West 13.6 % (10.6-16.6) 13.1 % (12.1-14.2)
Used≥1 NCTP in past 30 days 44.1 % (38.8-49.4)
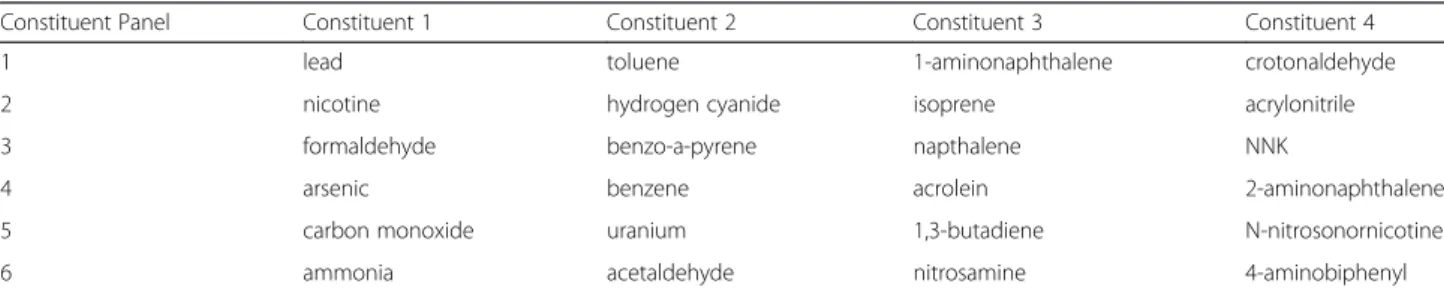
public appears to still be largely unaware of what constitu-ents are contained in cigarette smoke. In the current study, we asked respondents whether they had heard that each of 4 constituents are in cigarette smoke.. As there were six dif-ferent panels, we ultimately obtained data on 24 unique constituents, all of which appear on the FDA’s full list of 93 harmful and potentially harmful cigarette smoke constitu-ents [48]. With the exception of nicotine, most people were largely unaware of what constituents are present in cigarette smoke. Over one third of respondents were un-aware that even one of their listed constituents were present in cigarette smoke, and another third only reported knowing one of their four as being present in cigarette smoke. Future FDA messaging efforts could benefit from including information about the presence and health impli-cations of tobacco constituents.
The data presented herein indicate that for most U.S. adults the FDA is a known entity that is capable of regulat-ing tobacco. In stark contrast, the majority of people in the U.S. report low levels of trust in the“federal government.” In other words, although FDA is a part of the federal gov-ernment, individuals may not typically think of it as such. Thus, in certain cases identifying the FDA as the source of a counter tobacco message may help to increase the cred-ibility and impact of the message.
Limitations and future directions
The current study’s strengths include the recruitment of a large, nationally representative sample, targeted oversam-pling of key vulnerable groups, and the development of psy-chometrically valid health, tobacco use, and constituent communication items administered in both English and Spanish. Our study largely focused on constituents for which the FDA has signaled that they are most likely to require tobacco manufacturers to report quantity infor-mation [49]. However, with well over 5,000 chemicals in tobacco products [6] and 93 that the FDA has already iden-tified as harmful or potentially harmful [48], future mes-saging efforts will likely expand to include an array of different constituents. Although our findings are consistent with past research showing low levels of awareness for the presence of the majority of constituents in cigarette smoke, future studies exploring awareness of a wider range of constituents would be informative, especially once the FDA releases constituent information for tobacco products. A second limitation is that the unique associations between GLB status, age, and tobacco-related perceptions are some-what difficult to disentangle because, as compared to older adults, young adults more likely to identify as GLB. There is a great need for more tobacco control research with those who identify as GLB, especially considering that this population has a substantially higher tobacco use rate as compared to their non-GLB peers [50].
Table 3Current smoker cigarette use characteristics, adults≥ 18 years, CRRTC national adult phone survey 2014-2015
Weighted estimates
% 95 % CI
Number of days smoked in the past 30 days 25.3 [0–30] (24.5-26.1) Past 30 day smoking frequency
0 days 0.8 % (0.3-1.4)
1 or 2 days 2.2 % (1.0-3.3)
3 to 5 days 5.8 % (3.6-7.9)
6 to 9 days 1.9 % (0.6-3.3)
10 to 19 days 7.9 % (5.4-10.5)
20 to 29 days 7.9 % (3.4-12.3)
All 30 days 73.5 % (68.3-78.7)
Past 30 day menthol use
All cigarettes smoked were menthols 38.8 % (33.0-44.6) Some cigarettes smoked were menthols 15.8 % (11.9-19.7) No cigarettes smoked were menthols 45.5 % (40.0-50.9) Cigarette Type
Regular or full flavor 58.5 % (53.3-63.7)
Light or mild 29.4 % (24.3-34.5)
Ultra light 7.3 % (4.7-9.9)
Other or unspecified 4.8 % (2.4-7.3)
Cigarette Brand
Marlboro 38.2 % (32.7-43.7)
Newport 20.1 % (15.9-24.3)
Pall Mall 7.0 % (4.0-9.9)
Camel 6.3 % (4.1-8.4)
L&M 3.2 % (1.7-4.6)
Maverick 2.6 % (0.2-5.0)
Pyramid 2.6 % (0.2-1.6)
American Spirit 1.6 % (0.7-2.5)
Kool 1.5 % (0.6-2.5)
Virginia Slims 0.9 % (1.3-3.3)
Doral 0.8 % (0.2-1.4)
Salem 0.8 % (0.1-1.2)
Winston 0.7 % (1.8-5.5)
Parliament 0.6 % (0.1-1.5)
Benson & Hedges 0.4 % (0.0-0.9)
Generic or least expensive 2.3 % (3.3-7.0)
Roll your own 3.7 % (0.0-0.9)
Other brand 6.8 % (4.8-8.9)
Quit Intentions
Within the next month 23.4 % (18.8-27.9)
Within the next 6 months 24.8 % (19.4-30.2) Sometime in the future beyond 6 months 32.3 % (27.4-37.2)
–
Weighted proportion orMwith 95 % confidence interval
Total Smokers Young adults Low education Low numeracy Living in poverty GLBs
Information Seeking
Have you ever looked for information on chemicals in cigarettes and cigarette smoke?
Yes 27.5 % (25.4-29.7) 34.3 % (28.8-39.8) 37.2 % (31.6-42.8) 22.2 % (18.6-25.7) 26.7 % (22.7-30.6) 25.7 % (19.7-31.6) 30.1 % (21.0-39.1)
No 72.5 % (70.3-74.6) 65.7 % (60.2-71.2) 62.8 % (57.2-68.4) 77.8 % (74.3-81.4) 73.3 % (69.4-77.3) 74.3 % (68.4-80.3) 69.9 % (60.9-79.0)
In which 1 of these 3 places would you most like to see information on chemicals in cigarettes and cigarette smoke?
On cigarette packs 54.8 % (52.4-57.3) 57.2 % (51.9-62.6) 46.8 % (40.9-52.6) 55.4 % (50.9-60.0) 53.9 % (49.5-58.3) 54.3 % (47.4-61.2) 46.9 % (36.4-57.3)
In stores 15.0 % (13.2-16.7) 11.6 % (7.9-15.3) 14.7 % (10.7-18.7) 16.8 % (13.6-20.0) 16.0 % (12.9-19.2) 18.3 % (13.2-23.5) 17.2 % (10.3-24.1)
Online 28.7 % (26.5-30.9) 28.8 % (24.2-33.4) 38.2 % (32.5-43.8) 26.2 % (22.3-30.0) 28.5 % (24.6-32.5) 25.5 % (19.7-31.4) 35.8 % (26.1-45.4)
Don't know, refused, or doesn’t want information
1.5 % (0.9-2.08) 2.4 % (1.0-3.7) 0.2 % (0.0-0.8) 1.6 % (0.5-2.7) 1.5 % (0.56-2.46) 1.8 % (0.3-3.3) 0.1 % (0.0-0.3)
Constituent Awareness
Aware of 0 of 4 constituents in cigarette smoke 37.5 % (35.0-40.1) 36.7 % (31.6-41.8) 32.7 % (27.3-38.2) 46.4 % (28.9-37.2) 42.9 % (38.4-47.4) 43.1 % (35.7-50.4) 31.3 (22.0-40.7)
Aware of 1 of 4 constituents in cigarette smoke 35.8 % (33.4-38.2) 41.2 % (35.6-46.9) 36.1 % (30.4-41.7) 33.1 % (35.4-40.9) 34.5 % (30.3-38.7) 34.7 % (28.2-41.2) 38.9 (28.5-49.3)
Aware of 2 of 4 constituents in cigarette smoke 18.7 % (16.7-20.7) 15.8 % (12.2-19.4) 22.7 % (17.9-27.6) 14.5 % (19.1-23.6) 16.0 % (12.9-19.2) 13.6 % (9.8-17.5) 18.2 (11.0-25.4)
Aware of 3 of 4 constituents in cigarette smoke 5.6 % (4.6-6.5) 3.4 % (1.9-4.8) 5.9 % (3.4-8.4) 3.3 % (5.9-8.6) 4.8 % (3.3-6.3) 5.7 % (3.0-8.4) 9.3 (3.0-15.7)
Aware of 4 of 4 constituents in cigarette smoke 2.4 % (1.7-3.1) 3.0 % (0.5-5.4) 2.5 % (0.6-4.5) 2.8 % (1.5-2.9) 1.8 % (0.8-2.9) 2.9 % (0.8-5.1) 2.3 (0.0-5.0)
Knowledge of and Trust for FDA and U.S. Federal Government
Have you ever heard of the FDA or Food and Drug Administration?
Yes 94.6 % (93.4-95.8) 95.4 % (93.0-95.8) 90.9 % (87.7-94.2) 89.7 % (87.0-92.3) 91.7 % (89.0-94.3) 87.5 % (83.0-92.0) 91.7 % (85.0-98.3)
No 5.4 % (4.2-6.6) 4.6 % (2.5-6.8) 9.1 % (5.8-12.3) 10.3 % (7.7 %-13.0) 8.3 % (5.7-11.0) 12.5 % (8.0-17.0) 8.3 % (1.7-15.0)
Can the FDA effectively regulate tobacco products?
Yes 65.2 % (62.6-67.8) 66.6 % (61.2-72.0) 79.3 % (74.7-83.9) 64.9 % (59.9-69.9) 62.1 % (57.4-66.9) 67.8 % (61.3-74.1) 76.3 % (67.1-85.4)
No 34.8 % (32.2-37.4) 33.4 % (26.9-37.4) 20.7 % (74.7-83.9) 35.1 % (31.9-37.5) 37.9 % (33.1-42.6) 32.2 % (25.8-38.7) 23.7 % (14.6-32.9)
How much trust do you have in the federal government?M score, 0 = none at all - 4 = a great deal
2.0 (1.9-2.0) 1.7 (1.6-1.8) 2.1 (2.0-2.2) 1.9 (1.8-2.0) 2.0 (1.8-2.1) 2.2 (2.0-2.4) 2.1 (1.9-2.4)
Note. Point estimates in bold text were found to be significantly different from their respective comparison group (e.g., smokers were compared to non-smokers, young adults compared to older adults, etc.) using either PROC SURVEYFREQ or PROC SURVEYREG to make the comparisons
BMC
Public
Health
(2016) 16:516
Page
10
of
Future analyses of our adult phone survey data will exam-ine several key tobacco communication issues, and portions of the survey will be repeated in two years’time to examine potential temporal changes. One important area meriting further exploration is how the U.S. public perceives tobacco product use in the context of learning about constituents in cigarettes and NCTPs. In other words, there are a wide range of possible constituents that the FDA could message on; it would be instructive to explore whether certain types of con-stituents have a greater or lesser impact on tobacco use risk perceptions. Relatedly, given the highly technical names of many onstituent names, it would be of value to examine what contextual information might be important to include with constituent disclosures to make clear the risks associ-ated with their presence in cigarettes and NCTPs (e.g., what health effects are caused by particular constituents).
Another critical tobacco communication issue is the pub-lic’s perceptions of tobacco messaging agencies and their public health campaigns [51], especially as related to per-ceived source credibility [52]. Our preliminary findings indicate that different vulnerable groups have varied per-ceptions of the sources of tobacco health messages (e.g., FDA, CDC), suggesting that the source of messages may need to be emphasized in different ways, depending on the target audience. Future research that delves into the cogni-tive mechanisms underlying these group differences in gov-ernment organization credibility would be informative.
Conclusions
As the FDA moves forward with its tobacco policy and communication efforts, the positive impact on tobacco perceptions and use can be maximized by incorporating empirical evidence considering issues such as constitu-ent perceptions and tobacco regulatory agency messa-ging credibility. Additional national survey work in the U.S. context is needed in order to monitor the public’s response to FDA communications as well as to identify changing patterns of tobacco-related perceptions and use, especially for vulnerable populations.
Appendix A
Abbreviations
BRFSS, behavioral risk factor surveillance system; CDC, centers for disease control and prevention; CI, 95 % confidence interval; CRRTC, center for regulatory research on tobacco communication; FDA, U.S. food and drug administration; FSPTCA, family smoking prevention and tobacco control act; GLB, gay, lesbian, or bisexual; NCTP(s), non-cigarette tobacco product(s); PATH, population assessment of tobacco and health; TCORS, tobacco centers of regulatory science; U.S., United States of America
Acknowledgements
The research and manuscript preparation were supported by NIH grant P50 CA180907. Its contents are solely the responsibility of the authors and do not necessarily represent the official views of NIH or the FDA. The authors extend their profound appreciation to Quirina Vallejos, Jennifer Mendel, Kimberly Wiseman, Leah Ranney, and Kristen Jarmen for project management, Anna Hoffmeyer for coordination of participant enrollment and survey center activities, and Deborah Marean for survey programming.
Availability of data and materials
The data described herein come from a nationally-representative phone survey of U.S. adults collected by our TCORS Center for Regulatory Research on Tobacco Communication. We are unable to make the data available at this time because a public use dataset has not yet been created.
Authors’contributions
MHB participated in design of the survey measures and methods, facilitated survey implementation, performed all data analyses, and drafted the manuscript. RPA assisted with the survey design, managed survey programming and implementation, and helped draft portions of the manuscript. JMB designed and implemented the sampling methodology. NTB, ES, AG, and SMN were the primary individuals responsible for measures development. KMR conceived of the study, participated in its design and coordination, and helped to draft the manuscript. All authors read and approved the final manuscript. Competing interests
The authors declare that they have no competing interests. Consent for publication
Not Applicable.
Ethics approval and consent to participate
The institutional review board (IRB) at the University of North Carolina approved all study procedures. Participants were also protected by a Certificate of Confidentiality granted by the National Institutes of Health. Informed consent for participation in the study was obtained verbally from respondents at the time of enrollment.
Author details
1Department of Health Behavior, Gillings School of Global Public Health, University of North Carolina at Chapel Hill (UNC), CB #7440, Chapel Hill, NC 27599-7440, USA.2Lineberger Comprehensive Cancer Center, UNC, CB #7295, Chapel Hill, NC 27599-7295, USA.3Carolina Survey Research Laboratory, UNC, 730 Martin Luther King Jr Blvd, Chapel Hill, NC 27514, USA.4Department of
Table 5Constituent panels
Constituent Panel Constituent 1 Constituent 2 Constituent 3 Constituent 4
1 lead toluene 1-aminonaphthalene crotonaldehyde
2 nicotine hydrogen cyanide isoprene acrylonitrile
3 formaldehyde benzo-a-pyrene napthalene NNK
4 arsenic benzene acrolein 2-aminonaphthalene
5 carbon monoxide uranium 1,3-butadiene N-nitrosonornicotine
Biostatistics, Gillings School of Global Public Health, CB #74203101 McGavran-Greenberg Hall, Chapel Hill, NC 27599-7420, USA.5Department of Family Medicine, School of Medicine, UNC, CB #7595Manning Drive, Chapel Hill, NC 27599-7595, USA.6Department of Social Sciences and Health Policy, Wake Forest School of Medicine, Medical Center Boulevard, Winston-Salem, NC 27157, USA.7School of Media and Journalism, UNC, CB #3365, Chapel Hill, NC 27599-7440, USA.
Received: 2 February 2016 Accepted: 25 May 2016
References
1. U.S. Surgeon General. The health consequences of smoking–50 years of progress: a report of the Surgeon General. U.S. Department of Health and Human Services, Centers for Disease Control and Prevention, National Center for Chronic Disease Prevention and Health Promotion, Office on Smoking and Health. 2014. http://www.surgeongeneral.gov/library/reports/ 50-years-of-progress/full-report.pdf. Accessed on 21 Jan 2016.
2. Carter BD, Freedman ND, Jacobs EJ. Smoking and mortality–beyond established causes. N Engl J Med. 2015;372(22):2170. doi:10.1056/ nejmsa1407211.
3. Fagan P, King G, Lawrence D, et al. Eliminating tobacco-related health disparities: Directions for future research. Am J Public Health. 2004;94(2): 211–7. doi:10.2105/AJPH.94.2.211.
4. Ward E, Jemal A, Cokkinides V, et al. Cancer disparities by race/ethnicity and socioeconomic status. CA Cancer J Clin. 2004;54(2):78–93. doi:10.3322/ canjclin.54.2.78.
5. Garrett BE, Dube SR, Babb S, et al. Addressing the social determinants of health to reduce tobacco-related disparities. Nicotine Tob Res. 2015;17(8): 892–7. doi:10.1093/ntr/ntu266.
6. Talhout R, Schulz T, Florek E, van Benthem J, Wester P, Opperhuizen A. Hazardous compounds in tobacco smoke. Int J Environ Res Public Health. 2011;8(2):613–28. doi:10.3390/ijerph8020613.
7. Office on Smoking and Health, National Center for Chronic Disease Prevention and Health Promotion. Trends in current cigarette smoking among high school students and adults, United States. Centers for Disease Control and Prevention. 1965–2011. 2013. http://www.cdc.gov/tobacco/ data_statistics/tables/trends/cig_smoking/. Accessed on 21 Jan 2016. 8. Jamal A, Homa DM, O’Connor E, Babb SD, Caraballo RS, et al. Current
cigarette smoking among adults—United States, 2005–2014. Centers for Disease Control and Prevention. 2015. http://www.cdc.gov/mmwr/preview/ mmwrhtml/mm6444a2.htm?s_cid=mm6444a2_w. Accessed on 21 Jan 2016 9. Gilreath TD, Leventhal A, Barrington-Trimis JL, et al. Patterns of
alternative tobacco product use: Emergence of hookah and e-cigarettes as preferred products amongst youth. J Adolesc Health. 2015;doi:10. 1016/j.jadohealth.2015.10.001
10. O’Connor RJ. Non-cigarette tobacco products: What have we learned and where are we headed? Tob Control. 2012;21(2):181–190. doi:10.1136/ tobaccocontrol-2011-050281.
11. National Cancer Institute. Cigars: health effects and trends. Smoking and Tobacco Control Monograph No. 9. Bethesda (MD): National Institutes of Health, National Cancer Institute; 1998.
12. Lopez AA, Eissenberg T. Science and the evolving electronic cigarette. Prev Med. 2015;80:101–6. doi:10.1016/j.ypmed.2015.07.006.
13. Shihadeh A, Schubert J, Klaiany J, et al. Toxicant content, physical properties and biological activity of waterpipe tobacco smoke and its tobacco-free alternatives. Tob Control. 2015;24 Suppl 1:i22–30. doi:10.1136/ tobaccocontrol-2014-051907.
14. Hecht SS, Carmella SG, Kotandeniya D, et al. Evaluation of toxicant and carcinogen metabolites in the urine of e-cigarette users versus cigarette smokers. Nicotine Tob Res. 2015;17(6):704–9. doi:10.1093/ntr/ntu218. 15. Zeller M. Progress and Challenges: The State of Tobacco Use and
Regulation in the U.S. 2014. http://www.fda.gov/NewsEvents/Testimony/ ucm397399.htm Accessed on 21 Jan 2016.
16. U.S. Food and Drug Administration. FDA takes significant steps to protect Americans from dangers of tobacco through new regulation. http://www. fda.gov/NewsEvents/Newsroom/PressAnnouncements/ucm499234.htm Accessed on 6 May 2016.
17. U.S. Food and Drug Administration. Deeming Tobacco Products To Be Subject to the Federal Food, Drug, and Cosmetic Act, as Amended by the Family Smoking Prevention and Tobacco Control Act; Restrictions on the Sale and
Distribution of Tobacco Products and Required Warning Statements for Tobacco Products. https://www.federalregister.gov/articles/2016/05/10/2016- 10685/deeming-tobacco-products-to-be-subject-to-the-federal-food-drug-and-cosmetic-act-as-amended-by-the Accessed on 6 May 2016.
18. U.S. Food and Drug Administration, Center for Tobacco Products. Public Education Campaigns http://www.fda.gov/tobaccoproducts/ publichealtheducation/publiceducationcampaigns/default.htm Accessed on 21 Jan 2016.
19. Family Smoking Prevention and Tobacco Control Act. http://www.fda.gov/ TobaccoProducts/GuidanceComplianceRegulatoryInformation/ucm237092. htm 2009. Accessed on 21 Jan 2016.
20. Hall MG, Ribisl KM, Brewer NT. Smokers' and nonsmokers' beliefs about harmful tobacco constituents: implications for FDA communication efforts. Nicotine Tob Res. 2014;16(3):343–50. doi:10.1093/ntr/ntt158.
21. Moracco KE, Morgan JC, Mendel J, Teal R, Noar SM, Ribisl KM, Brewer NT.
“My first thought was croutons:”Perceptions of cigarettes and cigarette smoke constituents among adult smokers and nonsmokers. Nicotine Tob Res. 2015. doi:10.1093/ntr/ntv281.
22. Wiseman KD, Cornacchione J, Wagoner KG, Noar SM, Moracco KE, Teal R, Sutfin, EL. Adolescents’and young adults’knowledge and beliefs about constituents in novel tobacco products. Nicotine Tob Res. 2016. doi:10. 1093/ntr/ntw009.
23. Hammond D. Tobacco packaging and labeling policies under the U.S. Tobacco Control Act: Research needs and priorities. Nicotine Tob Res. 2012; 14(1):62–74. doi:10.1093/ntr/ntr182.
24. Pierce JP, Gilpin EA. A historical analysis of tobacco marketing and the uptake of smoking by youth in the United States: 1890–1977. Health Psychol. 1995;14(6):500–8. doi:10.1037/0278-6133.14.6.500.
25. Cruz TB, Wright LT, Crawford G. The menthol marketing mix: targeted promotions for focus communities in the United States. Nicotine Tob Res. 2010;12 Suppl 2:S147–53. doi:10.1093/ntr/ntq201.
26. Stevens P, Carlson LM, Hinman JM. An analysis of tobacco industry marketing to lesbian, gay, bisexual, and transgender (LGBT) populations: Strategies for mainstream tobacco control and prevention. Health Promot Pract. 2004;5:129S–34.
27. O'Keefe EB, Meltzer JP, Bethea TN. Health disparities and cancer: racial disparities in cancer mortality in the United States, 2000–2010. Front Public Health. 2015;3:51. doi:10.3389/fpubh.2015.00051.
28. Meza R, Meernik C, Jeon J, et al. Lung cancer incidence trends by gender, race and histology in the United States, 1973–2010. PLoS One. 2015;10(3), e0121323. doi:10.1371/journal.pone.0121323.
29. Emory K, Kim Y, Buchting F, et al. Intragroup variance in lesbian, gay, and bisexual tobacco use behaviors: Evidence that subgroups matter, notably bisexual women. Nicotine Tob Res. 2015. doi:10.1093/ntr/ntv208.
30. Hiscock R, Bauld L, Amos A, et al. Socioeconomic status and smoking: a review. Ann N Y Acad Sci. 2012;1248:107–23. doi:10.1111/j.1749-6632.2011.06202.x. 31. Language Use in the United States: 2011 American Community Survey
Reports. https://www.census.gov/prod/2013pubs/acs-22.pdf Accessed on 21 Jan 2016.
32. Centers for Disease Control. 2013 Behavioral risk factor surveillance system questionnaire. http://www.cdc.gov/brfss/questionnaires/pdf-ques/ 2013%20brfss_english.pdf Accessed on 21 Jan 2016.
33. National Institutes of Health, Instruments for Wave 2 of the PATH Study. http://www.reginfo.gov/public/do/PRAViewIC?ref_nbr=201407-0925-004&icID=212557 Accessed on 21 Jan 2016.
34. US Census. American Community Survey United States Census Bureau. http://www.census.gov/acs Accessed on 21 Jan 2016.
35. Lipkus IM, Samsa G, Rimer BK. General performance on a numeracy scale among highly educated samples. Med Decis Making. 2001;21(1):37–44. doi: 10.1177/0272989X0102100105.
36. The Williams Institute. Best practices for asking questions about sexual orientation on surveys. http://williamsinstitute.law.ucla.edu/wp-content/ uploads/SMART-FINAL-Nov-2009.pdf. Accessed on 21 Jan 2016. 37. Blumberg SJ, Luke C. Early release of estimates from the National
Health Interview Survey, July-December 2013. Hyattsville, MD, USA: National Center for Health Statistics. 2014.
38. Gundersen DA, ZuWallack RS, Dayton J, et al. Assessing the feasibility and sample quality of a national random-digit dialing cellular phone survey of young adults. Am J Epidemiol. 2014;179(1):39–47. doi:10.1093/aje/kwt226. 39. Blaise [computer program]. Version 4.8. Voorburg/Heerlen: Statistics
40. Agaku IT, King BA, Husten CG, et al. Tobacco Product Use Among Adults–United States, 2013–2013. Centers for Disease Control and Prevention: Atlanta; 2014. http://www.cdc.gov/mmwr/preview/ mmwrhtml/mm6325a3.htm. Accessed on 21 Jan 2016.
41. Behavioral Risk Factor Surveillance System. 2013 Summary Data Quality Report: Center for Disease Control and Prevention, Atlanta; August 15, 2014. http://www.cdc.gov/brfss/annual_data/annual_2013.html. Accessed on 21 Jan 2016.
42. Kalsbeek W, Agans R. Sampling and weighting in household telephone surveys. In: Lepkowski J, Tucker C, Brick J, et al., editors. Advances in telephone survey methodology. New York: Wiley & Sons; 2008. 43. Battaglia M, Hoaglin DC, Frankel, MR. Practical considerations in raking
survey data. Survey Practice (Online Journal). 2009; 2(5).
44. Flores-Cervantes I, Kalton G. Methods for sampling rare populations in telephone surveys. In: Lepkowski J, Tucker C, Brick J, et al., editors. Advances in telephone survey methodology. New York: Wiley & Sons; 2008. 45. Centers for Disease Control and Prevention. Tobacco brand preferences:
2014. http://www.cdc.gov/tobacco/data_statistics/fact_sheets/tobacco_ industry/brand_preference/. Accessed on 21 Jan 2016.
46. Biener L, Garrett CA, Gilpin EA, et al. Consequences of declining survey response rates for smoking prevalence estimates. Am J Prev Med. 2004; 27(3):254–7. doi:10.1016/j.amepre.2004.05.006.
47. Prochaska JO, DiClemente CC, Norcross JC. In search of how people change. Applications to addictive behaviors. Am Psychol. 1992;47:1102–14. doi:10.1037/0003-066X.47.9.1102.
48. Food and Drug Administration. Harmful and potentially harmful constituents in tobacco products and tobacco smoke: Established list. http://www.fda.gov/ TobaccoProducts/GuidanceComplianceRegulatoryInformation/ucm297786. htm. Accessed on 21 Jan 2016.
49. U.S. Department of Health and Human Services, Food and Drug Administration, Center for Tobacco Products (CTP). Guidance for industry reporting harmful and potentially harmful constituents in tobacco products and tobacco smoke under section 904(a)(3) of the Federal Food, Drug, and Cosmetic Act, DRAFT GUIDANCE. http://www.fda.gov/downloads/ TobaccoProducts/Labeling/RulesRegulationsGuidance/ucm297828.pdf 50. Johnson SE, Holder-Hayes E, Tessman GK, et al. Tobacco product use
among sexual minority adults: findings from the 2012–2013 national adult tobacco survey. Am J Prev Med. 2015. doi:10.1016/j.amepre.2015.07.041. 51. Duke JC, Alexander TN, Zhao X, Delahanty JC, Allen JA, MacMonegle AJ, Farrelly, MC. Youth's awareness of and reactions to the real cost national tobacco public education campaign. PLoS One. 2015;10:e0144827. doi:10. 1371/journal.pone.0144827.
52. Schmidt AM, Ranney LM, Pepper JK, Goldstein AO. Source credibility in tobacco control messaging. Tob Regul Sci. 2016;2(1):31–7. doi:10.18001/TRS.2.1.3. 53. Galesic M, Garcia-Retamero R. Statistical numeracy for health: A
cross-cultural comparison with probabilistic national samples. Arch Intern Med. 2010;170(5):462–8. doi:10.1001/archinternmed.2009.481.
54. Gates JG, Newport F. LGBT percentage highest in D.C., lowest in North Dakota. Gallup. 2013. http://www.gallup.com/poll/160517/lgbt-percentage-highest-lowest-north-dakota.aspx Accessed on 21 Jan 2016.
• We accept pre-submission inquiries
• Our selector tool helps you to find the most relevant journal • We provide round the clock customer support
• Convenient online submission • Thorough peer review
• Inclusion in PubMed and all major indexing services • Maximum visibility for your research
Submit your manuscript at www.biomedcentral.com/submit