Planning for Equity in a Local Context
Case Studies from the North Carolina chapter
of the American Planning Association Contributors
Mark McDaniel
Leigh Anne King
Lauren Blackburn and Helen Chaney
Christopher Danley, Katherine Hebert and Donald Kostelec
With an introduction from Ben Hitchings, NC-APA President
Editors’ Note: Carolina Planning regularly publishes a feature highlighting projects from members of the
North Carolina Chapter of the American Planning Association (NCAPA). This year’s submissions focus on
initiatives that are addressing equity issues in North Carolina communities. From case studies discussing
health impact assessments to articles highlighting the importance of using data to help inform equitable
planning activities and funding, these writers provide valuable insights into the important role North Carolina
planners play in shaping the futures of their communities.
Ben Hitchings, AICP, serves as NC-APA President and is Planning Director for the Town of Morrisville.
Mark McDaniel is a Senior Research Associate with the UNC Center for Community Capital.
Leigh Anne King, AICP, is a Senior Associate with Clarion Associates in Chapel Hill.
Lauren Blackburn, AICP, is the Director of the NCDOT Division of Bicycle and Pedestrian Transportation.
Helen Chaney is a Transportation Planner for NCDOT’s Division of Bicycle and Pedestrian Transportation.
Christopher Danley is the owner of Vitruvian Planning in Boise, ID.
Katherine Hebert is the Design 4 Life Coordinator for the Town of Davidson, NC.
Donald Kostelec, AICP, is the owner of Kostelec Planning, LLC, in Asheville, NC.
Acting For Equity
Ben Hitchings
My favorite line in the Pledge of Allegiance is “with liberty and justice for all.” But what exactly is “justice”, and what does it mean for our professional practice?
I think of “justice” as “fairness” with some determination behind it. If a Shakespearean actor was describing fairness and the director said “once more, with feeling”, the result would be justice. The term communicates a strong commitment to right inequities of the past and the present.
Signs of inequity are not hard to fi nd. In North Carolina alone, one in every six residents is living in poverty, for a total of more than 1.5 million people (U.S. Census 2010). Clearly, there is much work to be done. But how do we move from values to action?
The AICP Code of Ethics provides some guidance, stating our commitment to “seek social justice by working to expand choice and opportunity for all persons, recognizing a special responsibility to plan for the needs of the disadvantaged and to promote racial and social integration.” As we work to enable all stakeholders to participate in the decisions that affect them, we must make a special effort to empower the disadvantaged and help provide opportunities for them to improve their lives.
urge the alteration of policies, institutions, and decisions that oppose such needs.” In other words, each of us must be a positive force for advancing the goal of social justice.
The authors in this issue of the Carolina Planning Journal take the next step, providing tangible examples of programs that put these words into action. They describe how to:
•
Improve the life chances of young males of color through a focused program of affection, protection, correction, and connection.•
Expand access to healthy, locally grown foods;•
Improve safety and access to transit service;•
Advance public health by considering the health impacts of planning decisions;•
Institutionalize the process of integrating immigrants into local communities;In so doing, these authors provide real world examples of how we can implement our core beliefs through our professional practice.
Each one of us may not always have the opportunity to develop full-fl edged programs to advance the cause of social equity, but we can often fi nd ways to integrate this consideration into our daily practice. The articles in this issue provide an inventory of opportunities that we can draw upon to help us in this task. And if at times our energy for equity starts to lag, remember to do it “once more with feeling” in order to follow through on our pledge to work for liberty and justice for all.
Building Bridges to College and
Career Success for Young Males
of Color
Mark McDaniel
Vibrant, livable communities rely on healthy, well-educated and engaged residents to sustain them. This is not a controversial statement at face value, although some might argue about the means by which to achieve this outcome (e.g. importing a trained labor force versus educating and cultivating indigenous talent). Most policy makers believe a balanced approach is necessary to address ongoing human capital needs, with robust partnerships between public institutions and the private sector leading the way. The reasons for this are fairly clear. Without a set of committed and highly functioning educational institutions in local communities, labor markets begin to falter and the most vulnerable neighborhoods succumb to the economic and social manifestations of persistent
poverty, hopelessness and violence.
The latter, in fact, often defi nes the predicament of many low-income urban and rural communities of color. In these places, the transition from early childhood to adulthood is often described as the “cradle to prison” pipeline rather than a “cradle to college” pipeline. There are a number of factors that contribute to this unfortunate trend of sizable numbers of young males of color who drop out of school, are disproportionately involved with the criminal justice system, and are increasingly disconnected from regional labor markets. In too many parts of the country, males of color are less likely to benefi t from high quality pre-school programs, are more likely to attend under resourced schools, are more likely to be assigned to non-college bound academic tracks and are overrepresented in suspension and expulsion data (“University of North Carolina Commission Final Report,” 2007). These factors are often compounded by community level burdens of poverty, exposure to violence and higher levels of disruption in positive role models all contribute to disparate drop out, college attendance and employment rates. (Johnson & McDaniel, 2011)
Acknowledging these realities, the Urban Investment Strategies Center at the Kenan Institute of Private Enterprise launched Bridges to Success (B2S), an initiative that works to improve the overall life chances of young males who are at-risk of academic failure due to signifi cant social and economic challenges. B2S interventions are anchored in a conceptual model of successful pathways to optimal development. The model rests on the research-based premise that owing to concentration effects of exposure to multiple and overlapping risk factors in the family, school, neighborhood/community contexts, boys of color are exposed to an array of stressors – sometimes early on in the life course – which make it diffi cult to succeed academically and in other walks of life. B2S asserts that mediating institutions, such as schools or other community-based partners, can serve as hubs or safe havens for developing a range of life enhancing interventions and can help forge the formation of dense networks of social, cultural and intellectual resources that can serve as bridges to the coping mechanisms needed for optimal development (Johnson &McDaniel, 2011).
service professional development for existing teachers (Johnson & McDaniel, 2011).
Over the next fi ve years, B2S will launch several demonstration initiatives aimed at improving education and life outcomes for young males of color. B2S will work in partnership with the Global Scholars Academy (GSA), a pre-k through grade 8 charter school based Durham, North Carolina. GSA serves as the “mediating institution” and beta test site for 3 pilot initiatives.
The fi rst pilot is an Early Care Intervention that will target a cadre of male infants born in Durham next year. The males identifi ed will enroll in Primary Colors, GSA’s early care center, and receive developmentally appropriate medical screening and care from a pediatric clinic also collocated at GSA. Upon successful completion of pre-school, they will matriculate to GSA’s K-8 program for their primary and middle school education.
The second pilot, the K-8 Successful Pathways Initiative (see Figure 1), addresses academic performance challenges of male students often experienced in grades one through three that put them at greater risk of dropping out later in the life course. To address this critical challenge, GSA’s operating model incorporates an extended day, year-round format. This allows GSA to add special curricular enhancements to the Common Core Curriculum to improve overall literacy rates for young males. In addition, the extended day format allows for other enrichments to the curriculum including: nutrition
education, entrepreneurship, character development, global awareness and economic literacy.
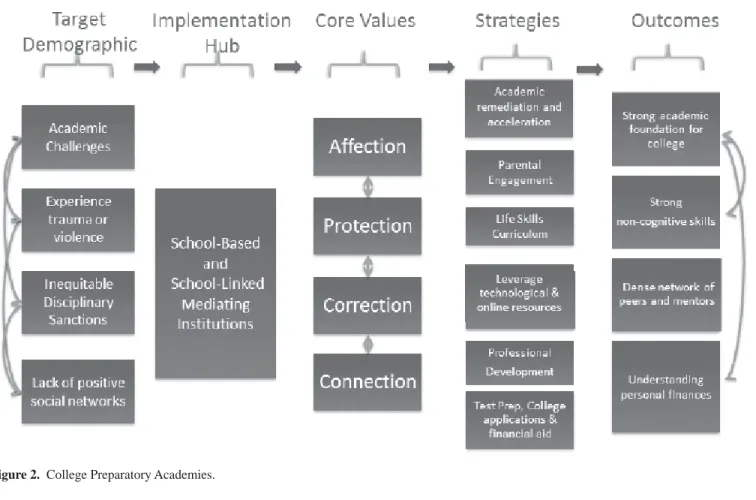
Lastly, the B2S College Preparatory Academy (Figure 2) targets high school age males who are defi ned as college bound but not necessarily college ready. The Academic Enrichment and College Readiness component draws on a combination of academic content coaches and self-paced online education to accelerate remediation and advance learning. The college readiness portion of programming also includes SAT preparation, college research and applications and fi nancial aid. The last component, the
Life Skills Evolution Program (LSEP), addresses the often overlooked underdevelopment of “soft skills” (i.e. traits that pertain to personality, attitude and behavior) intangible skills required to succeed in a knowledge based economy. To complement the academic enrichment component, B2S created LSEP as a 4-year soft skills training program designed to help participants gain a higher level of maturity, a deeper sense of personal responsibility and higher educational and career aspirations.
Through these various initiatives, B2S asserts that the best college completion program begins as a high quality early childhood education program – followed by culturally competent, affi rming and protective teachers and role models, engaging enrichment programs, diverse and dense social networks and strong core values throughout the academic and social of life of young males of color. By building a new research and evidence base, B2S will
become a clearinghouse resource for tested strategies and innovative approaches for educating males throughout the life course.
If information can guide innovation, B2S’ policy agenda hopes to infl uence the human capital development debate to include evidenced-based strategies that shift the educational and life trajectory for young males of color. Given the growing racial diversity of the country and a greater proportion of kids of color attending the nation’s schools, maintaining workforce competitiveness in an ever changing global economy makes the focus on improving education outcomes for young males of color a societal and economic imperative.
Try learn more about the Bridges to Success initiative: www.bridges2success.org
Resources
Johnson, J.H. & McDaniel, M. (August 2011). The Minority Male Bridge to Success Project. Retrieved from https://www.kenan-fl agler.unc.edu/kenan-institute/about/organization/urban-investment/~/ media/Files/kenaninstitute/UNC_KenanInstitute_ MinorityBridge.ashx
University of North Carolina Tomorrow Commission Final Report (2007). Retrieved from http://www. northcarolina.edu/nctomorrow/UNCT_Final_ Report.pdf
Food Access
Leigh Anne King
The Importance of Local Food Systems
A little known fact is that, generally speaking, food consumed in the United States travels 1,500 miles from the farms that grow our food to the forks that serve it to us. Also not well known, is that in 2006, the value of food imported into the United States exceeded the value of food exported – challenging our status as the bread basket of the world.
1 Industrial processing and food distribution systems that
thrived over the last century and a half brought us food from around the globe and saved us food preparation time in the kitchen. The result is that today, our relationship with food is very different from what previous generations experienced. The days of it being commonplace to grow up on a farm, to know the dairy that produces your milk, the butcher that cuts your meat, or the baker that bakes your bread waned long ago. While agriculture remains America’s primary land use with more than one billion acres of land devoted to agricultural purposes, our connection to the food we consume and the producers that make it has diminished.2 Today, many school children do
not even know where their food comes from, and some may argue that the food choices being marketed to them hardly resemble good healthy food.
But little by little, this disconnect between the
people and places that make our food is changing. Many movements exist to promote the “slowing” of food and bringing food producers back into direct contact with food consumers through consumer supported agriculture, farmer’s markets, and the like. This is often coined as creating a “local food system” – the network of activities that link food production, processing, distribution and access, consumption, and waste management, as well as the supporting and regulatory institutions and activities. Communities across the nation have been working to support the development and advancement of local food systems through local planning efforts, and planners have an important role at the food systems planning table, particularly in North Carolina where we have an agricultural legacy.
The Food Systems Disconnect in North Carolina
Agriculture is king in North Carolina. In 2007, North Carolina agriculture and agribusinesses accounted for $70 billion of the State’s $400 billion gross state product (value-added income) and 700,000 of the state’s 4 million employees, making the agricultural sector North Carolina’s number one industry.3 The number of farms in
North Carolina totaled 53,400 in 2010. The state leads the nation in terms of cash receipts for tobacco and sweet potatoes and is ranked number two for hogs, pigs, trout, turkeys, eggs, and Christmas trees. Agritourism has grown across the state with pick-your-own, farm tours, and retail operations popping up in the Piedmont, Western North Carolina, and the Coastal Plain.
Despite this large amount of agriculture and agribusiness, there is a disconnect between what we produce in North Carolina and what we consume. A ground-breaking study prepared by the Appalachian Sustainable Agriculture Project (2002) estimated the value of food products that were grown locally versus consumed locally in Western North Carolina. The project identifi ed that consumers purchased $2.6 billion worth of food, but spent only $15 million (less than 1%) on locally produced foods. By 2009, spending on local foods in Western North Carolina reached $30 million, refl ecting greater awareness, but still less than 2% of total food purchases for this part of the state. This lack of local food purchasing is likely indicative of a similar trend in the rest of the state. North Carolinians are not eating their own food, and part of the reason for this is a lack of access to locally produced foods. The Strolling Heifers Locavore index ranks the number of state-documented farmers markets and community supported agriculture (CSA) programs per capita for each state. In 2012, North Carolina ranked 32 out of 50.4
Our Role as Planners
Food systems planning is supported at the highest levels in our fi eld. The American Planning Association (APA) established the APA Sustaining Places Initiative in 2010. In the Sustaining Places Initiative’s report, the APA sets out a mission of using the comprehensive plan as the
leading policy document for achieving sustainable practices in our communities. “Healthy Community”, one of eight principles identifi ed in the initiative’s report, encourages access to healthy, locally grown foods to support a healthy community and identifi es a variety of tools for supporting local food systems.5 Setting out explicit goals in our
community plans is a critical step toward fostering local food systems.
At a state level, North Carolina created the North Carolina Sustainable Local Food Advisory Council to address some of the program and policy considerations regarding the development of a sustainable local food economy in the state. In North Carolina, our planning tools to foster local food systems are not only comprehensive plans, but agricultural preservation plans, voluntary agricultural districts (VAD), enhanced VADs, code modifi cation to remove barriers and create incentives for agriculture and agricultural supportive uses, and the creation of new community facilities that can support local food systems.
At a local level, many governments in North Carolina are using planning tools to support local food systems. Currituck County created rural zoning districts that protect and foster the economic viability of farming by permitting new types of agriculture, agribusiness, and agricultural support uses, such as slaughter houses, packing facilities, and refrigerated storage. The county also adopted farmland compatibility standards aimed at protecting farms from new suburban development through vegetated buffers, fencing requirements, and required larger lot sizes on lands closest to agricultural activities. Fayetteville allows community gardens as permitted uses in residential districts and allows public parks and farmers markets in targeted districts. Wilmington, Carrboro, Charlotte and other communities support local food systems and urban agriculture efforts by changing local ordinances to allow for the raising of hens and bees in certain residential districts. Blue Ridge Food Ventures was developed by the regional economic development organization for Western North Carolina to serve as a local food business incubator. Each month, 20-30 entrepreneurs rent space by the hour to use the facility’s processing center and kitchen, and offer business planning, fi nancial counseling, and marketing support to local food businesses. Charlotte’s Seventh Street Public Market is a unique public market, accessible by light rail, which provides a central urban marketplace bringing together a diverse array of regional producers and consumers. This public market also mitigates food desert impacts previously experienced in close by inner city neighborhoods.
improvements to improve the overall safety and comfort of transit users, and inadequate street crossing infrastructure can make it diffi cult for a transit rider to safely reach a transit stop—this is particularly true for riders who do not own cars.
The North Carolina Department of Transportation (NCDOT) provided funding in 2011 for the development of the Durham Pedestrian and Bicycle Access to Transit Plan, which focuses on improving the safety, access and comfort of transit users along three transit corridors in the city’s central core area. A bond referendum passed for Durham County in October 2011, made funding available to add to federal and state funding for roughly $6 million in improvements within these three transit corridors. Potential improvements include the construction of sidewalks, improvements at transit centers, and improvements at bus stops, (e.g. the provision of level landing surfaces, bus shelters, and benches, etc.) This funding opportunity prompted the City of Durham to more thoroughly examine infrastructure needs at transit centers and stops and provide funding for the plan. As the plan was not formally adopted at the time of publication of this article, the recommendations summarized in this article are general in nature.1 The following synopsis includes information
about how the plan was developed, signifi cant variables for evaluation, public involvement methods, and preliminary recommendations.
Project Overview
Funds provided by NCDOT’s Division of Public Transportation made possible the Durham Pedestrian and Bicycle Access to Transit Plan. The Division of Bicycle and Pedestrian Transportation managed the project, which is a pilot for how future access to transit plans may be developed by NCDOT. Staff from the City of Durham, can teach the public about the role that food systems play
in our communities and our individual lives: they can help foster a sense of community, offer healthy food choices and improve health outcomes, boost the local economy, improve local food security, conserve energy and resources, promote social equity, and protect quality open spaces. Planners can help by connecting the dots between the need for successful local food systems and our declining health as a nation, increasing costs to purchase food, and reduced access to healthy food choices particularly for lower income communities. Building on community support, planners should identify strategic partnerships with local food system representatives and learn more about how our communities should change plans and ordinances to support local food systems. While we are not the producers or the distributors, our role as change agents in the public policy arena is critical in fostering the development of local food systems.
Endnotes:
1 USDA Economic Research Service, Foreign Agricultural
Trade of the United States, Monthly Trade Balance Reports, 2013
2 USDA Economic Research Service, Land Use, Land
Value, and Tenure, August 2, 2012
3 Agriculture and Agribusiness: North Carolina’s Number
One Industry, Mike Walden, NC State College of Agriculture and Life Sciences
4 Strolling Heifers 2012 Locavore Index, http://www.
strollingoftheheifers.com/wp-content/uploads/2012/12/ Locavore-Index-2012.pdf
5 Sustaining Places: The Role of the Comprehensive Plan.
APA Planners Advisory Service Report 567. David R. Godschalk and William R. Anderson, 2012.
Transportation, Equity, and
Access to Bus Transit
Lauren Blackburn
Helen Chaney
Introduction
The goal of public transportation agencies is to provide safe, effi cient, and reliable service for passengers to reach their homes, jobs, shopping and other destinations. In order to maintain and increase ridership levels, transit agencies must strive to ensure the physical safety of their passengers. This need for safety applies for both passengers on board the vehicle, as well as when they are accessing the system at a transit stop.
Transit users frequently confront a lack of suffi cient infrastructure for walking and bicycling to bus transit stops. Bus stop locations are often in need of signifi cant
Durham County, NCDOT and Triangle Transit – the agency responsible for management of Durham’s bus transit system, known as “DATA” – guided the development of the plan. The planning process began in fall 2011 and will run through spring 2013, and is carried out with assistance from Toole Design Group.2
The plan started by identifying a critical-need study area, outlining existing conditions for transit users with special emphasis on safety information, and collecting user input through a variety of participation methods. Based on the information gained regarding existing conditions, and with input from the steering committee,
the plan provides general recommendations based on prioritization models and specifi c infrastructure needed. These recommendations address safety, connectivity, infrastructure, and design as they relate to pedestrian and bicycle accessibility. The plan also recommends a series of policy and program changes in fi ve areas: planning and design guidance, resources, operations, maintenance, and customer communication.
Study Area
In selecting the study area for this plan, the lead agency partners focused upon transit corridors in Durham with high transit ridership and that lack continuous and accessible pedestrian and bicycle infrastructure. Three Durham corridors were selected, Fayetteville, Holloway, and Roxboro streets, based on several criteria. The Fayetteville and Holloway corridors feature far lower household incomes and vehicle ownership rates than Roxboro. The Roxboro corridor is of interest because it connects with the two other corridors and features more suburban design. The predominant land use along each corridor is residential and supported by a fairly well-developed grid street pattern. Major transit trip generators in the study area include Durham Regional Hospital, located along northern Roxboro Street, North Carolina Central University located along Fayetteville Street, and “the Village,” a major commercial node on Holloway, as well as several schools located along side streets.
Existing Conditions
The Plan identifi es existing conditions affecting walking and bicycling access to bus stops along the three study corridors, totaling roughly eleven miles. After collecting baseline information about the study area, the consultants used handheld portable GPS-enabled tablet computers to evaluate existing conditions in the study area, which included approximately 190 bus stops, 70
intersections, and a total of 180 center line miles. The fi eld audit revealed signifi cant defi ciencies in all the corridors, including damaged sidewalks, gaps in sidewalks, overgrown vegetation, cars or trash cans obstructing the sidewalk, driveway access issues which pose safety concerns for pedestrians, and unsafe street crossing locations. The audit also noted defi ciencies in the bus stop environment, including poor placement of stops, lack of level lift areas for wheelchair users, puddles and overgrown vegetation, lack of or poor lighting, and poor pole and fl ag condition. The consultants made note of existing features at each bus stop (e.g., bench, shelter, trash can, bicycle rack, etc.); available space to install shelter; location of bus stop (near side/far side/mid-block); ground surface type; curb type; and condition of sidewalks leading to the stop.
Descriptions of prescribed improvements per stop, as well as geo-referenced photographs for each bus stop, are included in a geospatial database, which will be made available to the city and transit agency upon completion of the plan. This database will be useful to Durham and transit providers in future planning efforts, and could be expanded by transit agency staff to include additional bus stops in the DATA system.
Crash Data Analysis
A detailed crash analysis revealed a high incidence of pedestrian crashes in the study area with a disproportionately large number among certain minority groups. A total of 181 pedestrian-vehicle crashes occurred in the study area for years 2004-2008, the majority of these (71%) involving African Americans as the injured or killed pedestrian. It is important to note that statewide, there is an over-representation of pedestrian crashes among African American populations. African Americans were involved as pedestrians in 41% of vehicle-pedestrian crashes, but accounted for approximately 22% of the overall state population in 2010. This overrepresentation may refl ect greater amounts of walking by African Americans
PRIORITY RANKING
1 2 3
Safety Overhead light at the bus stop.
A pedestrian signal where I cross the street.
A crosswalk striped where I cross the street.
Access The sidewalks are better – wider, smoother and level.
Sidewalks or paved paths along the entire walking route to my stop.
No obstacles along the way, such as utility poles, bushes, tree roots, parked cars.
Comfort A shelter to block the sun or rain while I wait for the bus.
A trash can at the stop.
A bench to sit on while I wait for the bus.
compared to other populations in the study area.
Public Input
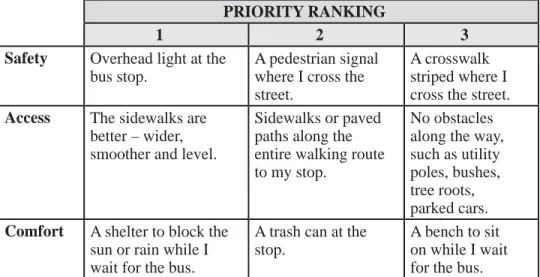
As a public input strategy, the agency partners leading the planning process decided to request input from transit users while they were on board the bus. Leaders expected that this method would yield more input than a traditional open house event. Transit users on board the buses were requested to complete a survey ranking the need for improvements in three general categories: safety, access and comfort.3 After ranking the general
categories, survey respondents were asked to rank the specifi c infrastructure improvements within each category. Safety was ranked as most important, with the desire for good lighting at the stop rated highest, followed by access and comfort improvements. Table 1 shows rider intercept ratings of improvements, revealing the top three priority items reported by respondents for each category of improvements. One compelling statistic was the rate of car ownership—nearly 85% of respondents indicated that they did not own a car and were therefore dependent on transit, as well as walk- or bike-only trips.
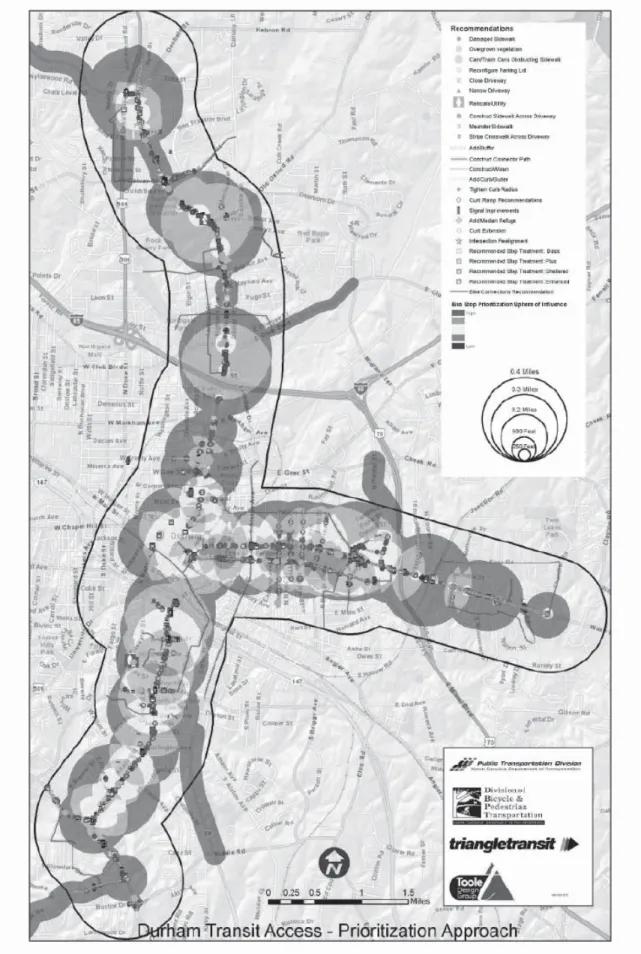
Determining Project Priorities
The ranking of infrastructure projects for the Access to Transit Plan employed four data inputs: household income, vehicle ownership rates, household density, and unemployment rate. A “heat map” (see Figure 1) was generated for the project study area, based upon the composite scores of these data inputs. The “heat map” shows high-need geographic zones in red, with yellow indicating medium priority and green indicating lower priority. Improvements to safety, access and comfort will receive relatively equal weighting within each priority category. However, the survey results from transit riders, and their weighting of these three aspects, will be used to inform the exact balance of priorities projects in these areas.
Plan Recommendations
Bus riders, regardless of their socio-economic status have the same basic needs for safety, comfort and access when traveling by public transit. Given this, the plan recommendations include:
•
Strengthened collaboration among all entities to plan, design, build and maintain bus stops and access to them from the perspective of rider needs fi rst, then to address operational needs. This collaboration includes using rider feedback from all sources to address safety, comfort, and access needs.•
Focused investment in basic access and stop features, such as a sidewalks to/from a stop, a level landing pad, pedestrian-oriented street crossings (especially for companion stops), and increasingly infrastructure that supports bicycle transportation as an extension of public transit (bike parking, racks onbuses, bikeway connections within bus stop access sheds).
•
Continued development of stop spacing and placement that encourages ridership, especially within the ½ mile access shed. Placement of stops at intersections, where possible, to encourage passengers to cross at intersections, as opposed to mid-block.•
The development and implementation of companion projects, programs and policies to support improved access to transit.Conclusion
Public transit is a key factor in increasing equity through transportation, as it is, in part, designed to serve the needs of populations within limited access to transportation choices. Protecting the fi rst and last mile of bicycle and pedestrian infrastructure is critical to the success of improving access to transit and equitable transportation options. The Durham Pedestrian and Bicycle Access to Transit Plan is meant to lead to meaningful improvements to the environment for transit users in Durham and contribute to the overall viability of the transit system, while also serving as a model for future planning efforts across state of North Carolina in years to come.
Endnotes
1 The Plan will be made available on the City of Durham’s
webpage, at www.durhamnc.gov
2 Toole Design Group is a fi rm which specializes in
pedestrian and bicycle planning, including access to transit, based in Silver Spring, Maryland.
3 Safety” related to connectivity between stop locations
and other land uses; “Access” related to the width and condition of sidewalks; and “Comfort” was related to the size of the waiting area, the presence of a shelter, bench, and/or lighting
Health Impact Assessments &
Planning: Bridging the Gap to
Promote Health Equity
Christopher Danley, Katherine Hebert, Donald
Kostelec
the evidence of the relationship between planning decisions and public health outcomes can be seen in increasing health inequalities throughout the United States. Health Impact Assessment (HIA) can contribute information to the planning process in order to address these unintended health consequences prior to a decision being made.
Planners work to “improve the welfare of people and their communities by creating more convenient, equitable, healthful, effi cient, and attractive places for present and future generations.”2 A planner’s actions can either
contribute to health inequities or promote equity. Language related to the protection of health and enhancing quality of life is commonplace in comprehensive plans and zoning ordinances. However, this language typically concerns only very basic health issues such as clean water, sanitary sewer services, building stability and fi re protection.
Today, with obesity, diabetes and cardiovascular disease on the rise, the health profession – both clinical and public health – is becoming more involved in plans, policies, programs and projects that impact the built environment. Health professionals recognize that the planning profession is at the frontlines of determining whether or not healthy communities are built.
What is health and health equity?
Health is not something you purchase from the doctor’s offi ce. Defi ned as “a state of complete physical, mental, and social well-being and not merely the absence of disease or infi rmity,” a person’s level of health is determined by many factors including the environments in which they live, work, play, learn and worship.3 Health inequities are differences
in the health status, distribution of disease and illness, and in mortality rates across population groups. These inequities are caused by an unjust distribution of resources, opportunities and authority needed to live a healthy life. Achieving health equity entails focusing societal efforts to address avoidable inequalities by equalizing the conditions and removing barriers to health for all groups so that all people can realize the highest level of health possible.4
Health equity also relates to how we expend fi nancial resources on healthcare and initiatives aimed at keeping us healthy. A 2007 study noted that being able to access health care is a critical determinant of health status, but the behaviors of individuals - which can be infl uenced by planning decisions about the built environment - are a much greater infl uence on individual health. It noted that 88% of the national health expenditures are devoted to access to care but those expenditures only have a 10% infl uence on health over a person’s lifetime. Conversely, healthy behaviors, including active living and healthy eating, have a 50% infl uence on personal health but we spend only 4% of expenditures devoted to healthy behaviors.5
Health Impact Assessment (HIA) emerged as a way to more effectively unite the professions of planning and public health to achieve their mutual interests by analyzing and determining how proposed plans, projects, or proposals may impact the health and welfare of the general public.
In some cases, HIA may address the deleterious effects that sedentary lifestyles are having on Americans, health care costs and the economy. HIA allows planners to form partnerships with health offi cials, engage community members in a discussion around health and the built environment, and promote health equity.
What is Health Impact Assessment?
The National Research Council developed the following technical defi nition for HIA:
HIA is a systematic process that uses an array of data sources and analytic methods and considers input from stakeholders to determine the potential effects of a proposed policy, plan, program, or project on the health of a population and the distribution of the effects within the population. HIA provides recommendations on monitoring and managing those effects.6
The HIA process is broken into six steps: screening, scoping, assessment, recommendations, reporting, and monitoring and evaluation. These steps, which are illustrated in Figure 1, are fl uid and tend to infl uence one another.
HIA uses a combination of sources and methods of analysis, depending on the topic and the sector (e.g. transportation, housing, energy) in which the assessment is being conducted. Each sector is unique, and one of the greatest strengths of the HIA process is its fl exibility, which makes it possible to evaluate potential health outcomes of diverse types of decisions. HIA can be applied to the 4 Ps: plans, policies, programs and projects. For example, this process can be used to inform decisions concerning the built environment –such as a comprehensive transportation plan, specifi c transit projects or local planning ordinances – as well as programs and policies outside of the built environment, such as the Supplemental Nutrition Assistance Program or a minimum wage policy.
Through an HIA, a community can address health inequities by estimating and measuring how the proposed action could impact various populations. One of the main tenets of HIA is that it considers those who, as a result of various circumstances, may be more adversely affected than others by the decision being made. Therefore, community engagement and empowerment are key components of this process.
The Value of HIA
The value of HIA is felt by a broad variety of stakeholders involved in it – from health professionals to community members. For health professionals, HIA is a way to bring health concerns to the attention of decision makers and to form partnerships with professionals in other fi elds, such as planning, in order to incorporate health considerations into local policies and procedures.
to strengthen plans, promote an additional means of community engagement and inform the outcomes of a plan either specifi cally through health-based analysis or with health as one of many factors in the outcomes of the plan. For the community, HIAs can be a form of empowerment and can provide useful information for grassroots community action. For decision makers, HIA can provide additional perspectives on and information about a decision and can also facilitate community buy-in. Ultimately, the value of doing an HIA is to create
health-promoting policies and a healthier built environment.
HIA Case Studies in North Carolina
All of these value-added elements have been realized in HIAs conducted in North Carolina over the past two years. In a planning context, HIAs have been applied to: an amendment to state law that would limit municipal authority to infl uence urban design if passed; active transportation plans (e.g. pedestrian, bicycle, greenways); corridor studies for highway and commuter rail investments; and local street design standards.7
The degree to which overall health equity has been considered in each has varied based on the context of the HIA. For example, the HIA performed for the Haywood County Comprehensive Bicycle Plan found that students at an elementary school in a traditional, small town neighborhood had experienced alarming rates of increases in Body Mass Index (BMI) over a fi ve-year period of time. The neighborhood had other key indicators of poor health, such as low income and higher-than-average rates of rental housing. Using the HIA method, the Bicycle Plan identifi ed engineering, education and encouragement recommendations along the bicycle route that bisected this neighborhood.8
In the Town of Davidson, promoting health equity has been a specifi c goal of two HIAs: Davidson’s Street Design Standards HIA and the Red Line Commuter Rail HIA.9, 10 Providing multiple modes of transportation
increases mobility options for low-income individuals who cannot afford a car, youth and the elderly who may not be legally able to drive or may choose not to drive, and
those with a disability that prevents them from driving. Increased mobility can lead to additional employment opportunities; increased autonomy, social cohesion and mental health; and improved physical health as activity levels increase. R e c o m m e n d a t i o n s included within the HIAs aim to increase the safety of all mode users and provide additional transit options and active transportation facilities.
In Buncombe County (Asheville area), an HIA for a countywide greenways and trails plan pinpoints which of the eight priority corridors identifi ed in the plan have the highest potential for positive impacts on the health of those residents who reside within one mile of the planned greenway investment. Some pockets have higher proportions of older adults, while others are near minority neighborhood or areas where there is a higher density/number of residents for whom English is a second language. This has led to preliminary recommendations on how the county should prioritize investments and how those investments should strongly consider the needs of nearby residents (e.g. larger typeface on wayfi nding signs or icon-based signs for those with limited English).11
In Robbinsville, a mountain community that has been hit hard by the economic downturn and is historically isolated from other areas of western North Carolina, the HIA for the town’s Pedestrian Connectivity Plan is synthesizing the results of numerous past planning, economic and health efforts to position the community to maximize health outcomes for its residents through investments in sidewalks and greenways. The town has conducted, in partnership with universities and health foundations, numerous studies and investments related to diabetes management and prevention, access to health care, tobacco free living, and school-based health centers. The results of these efforts are being assessed in relation to prioritized pedestrian facility improvement to link community facilities to nearby neighborhoods.
The Future of HIA
HIA is still a relatively new practice in the United States, but is much more formalized in many European countries. As the practice continues to grow, the model by
2013 NC APA Conference
“Preserving Our Future: From Planning to Performance”
Join us during the Centennial Anniversary of Winston-SalemSeptember 18 - 20, 2013
Benton Convention Center
Winston-Salem, NC
Explore the issues discussed here – and more – at the annual gathering of the state APA chapter. Visit the Carolina Planning exhibit table, attend our panel discussion on this issue, and choose from numerous other panels,
gatherings, and mobile sessions.
Save the date!
For more information, visit
http://www.nc-apa.org
.
which HIAs are conducted will evolve in the same way that the methods planners use to develop plans has evolved over the past several decades.
In North Carolina, HIA is applied in diverse ways: To inform a municipal plan; as an integrated element of active transportation plans; and to inform decision makers on how proposed legislation by the North Carolina General Assembly could impact a community’s design. The common thread is that these HIAs have all used the topic of health to engage stakeholders and inform outcomes of the plan or policy decision.
While some communities may not be able to fully engage in the entire HIA process due to funding, time or staff limitations, leaders and offi cials need to consider health as an integrated element of every plan. In the same manner in which we include vision and goals, demographics analysis, land use forecasting, transportation evaluation, economic analysis, provision of water and sewer services, and zoning, we should consider the overall health impacts to the community—it is and continues to be the foundation on which the planning profession was established.
Endnotes
1 Kelly, Eric Damien. Community Planning: An
Introduc-tion to the Comprehensive Plan. Island Press; 2010: 23.
2 American Planning Association. What is Planning?
https://www.planning.org/aboutplanning/whatisplanning. htm
3 World Health Organization. WHO Defi nition of Health.
http://www.who.int/about/defi nition/en/print.html
4 American Medical Student Association. What is Health
Equity. http://www.amsa.org/AMSA/Libraries/Initia-tive_Docs/2011_Health_Equity_Background.sfl b.ashx
5 New England Healthcare Institute. The Boston
Para-dox: Lots of Health Care, Not Enough Health. The Boston Foundation. 2007.
6 National Research Council of the National Academies.
Improving Health in the United States: The Role of Health Impact Assessment. Washington, DC: National Academies Press; 2011:46. Free PDF access to this book is available at http://www.nap.edu/openbook. php?record_id=13229. Accessed May 10, 2012.
7 Health Impact Project. HIA in the United States. http://
www.healthimpactproject.org/hia/us. Accessed October 30, 2012.
8 Haywood County Comprehensive Bicycle Plan –
Health Impact Assessment. http://bicyclehaywoodnc.org/ Files/20111111_HaywoodBikePlan_HealthImpactAs-sessment.pdf. Accessed on October 30, 2012.
9 Health Impact Assessment: Town of Davidson Street
Design Standards. http://www.healthimpactnc.com/ wp-content/uploads/2012/11/SDS-HIA-Report-2.pdf . Accessed February 20, 2013.
10 Health Impact Assessment: Red Line Regional
Rail. http://www.healthimpactnc.com/wp-content/up-loads/2012/11/Red-Line-HIA-11-28-2012.pdf . Accessed February 20, 2013.
11 Draft Findings – Buncombe County