Abstract:
An N-ethyl-N-nitrosourea (ENU)-induced mouse mutant, characterized as the Highper line, was identified by the Tarantino Lab. It was found that Highper mice exhibited higher activity in response to a novel environment and altered sensitivity to psychostimulants and an altered hypothalamic–pituitary–adrenal (HPA) axis stress response. Genetic mapping followed up with sequencing determined that the ENU-induced mutation causing the hyperactive phenotype was due to a single nucleotide polymorphism (SNP) in the Rhpn1 gene. The lab recently determined that the SNP results in an alternative splice variant of this gene. The next necessary step is to
determine the consequence of this mutation at the protein level. We will assess protein levels in bran tissue from mutant (Highper) vs wildtype C57BL/6J mice using
Introduction:
Drug addiction is a long-standing issue in today’s society and has had a significant impact on the ability of individuals to be able to meet the responsibilities of their
everyday lives. Long-term abuse of addictive substances can result in the development of a substance use disorder (SUD), which can lead to serious personal health impairments as well as carry negative economic and societal consequences. Studying the mechanisms involved in the addiction cycle has been crucial in addressing this issue. A person’s environment, personality, and genetic background have all been shown to play a role in one’s predisposition to developing a SUD. Previous studies have shown that genetic background can influence drug abuse and response in both human populations (Uhl et al. 1995) as well as animal models (Bierut et. al 1998; Crabbe et al. 1994; George and Goldberg 1989; Seale and Carney 1991).
Due to the complex nature of SUDs, modeling the underlying mechanisms
associated with addiction in human populations has been a difficult endeavor. It is in this regard that the use of animal models provides an advantage in being able to precisely control genetic background and environment, allowing for successful modeling of drug-induced behavioral responses (Eisener-Dorman et al. 2012). Comparison across inbred lines of mice has shown comparable phenotypic variability for drug-induced behavioral responses seen in the human population while also providing several advantages
conducive to genetic mapping techniques (Wiltshire et al. 2015; Ruiz-Durantez et al. 2006; Seale and Carney 1991).
There are a variety of approaches that can be utilized in assigning gene function and generating animal models to study complex traits. One such approach, ENU
mutagenesis, generates random mutations within the genome with identifiable phenotypes that have yet to be linked to a gene. An ENU-induced mouse mutant, characterized as the Highper line, was identified in the Tarantino Lab. Highper mice exhibit higher locomotor activity in response to a novel environment, altered sensitivity to psychostimulants (cocaine, methylphenidate, ethanol), and an altered HPA stress response (Eisener-Dorman et al. 2012). Prior studies have indicated that that the
rewarding effects of drugs can be potentiated by stress (Piazza et al. 1990; Covington and Miczek 2001; Haile et. al 2001).
Genetic mapping and sequencing determined that the ENU-induced mutation responsible for the Highper phenotypes was in the Rhophilin-1 (Rhpn1) gene, which codes for an effector of the small GTPase, RhoA. While the biological function of Rhophilin-1 is largely unknown, it has been shown to play a role in mouse kidney function (Lal et al. 2015), is highly expressed in the germ cells and localized in
spermatozoa of mice (Nakamura et al. 1999), is expressed in the brain, and serves as a regulator of actin cytoskeleton organization (Lal et al. 2015; Peck et al. 2002).
With the transcriptional effects of the mutation having been identified, the next necessary step is to determine the consequence of this mutation at the protein level by extracting and quantifying protein from the brain tissue of mutant (Highper) vs wildtype (C57BL/6J) mice. A BCA assay, as well as quantitative Western blotting, will be used to 1) determine if protein is or is not present in Highper mice, 2) quantify the amount of protein if present, and 3) determine the size of the protein if present.
Materials & Methods: Animals
C57BL/6J (B6J) mice from the Jackson Laboratory (Bar Harbor, ME, USA) were bred in-house at the University of North Carolina at Chapel Hill (UNC). Highper mice were bred on a B6J background at UNC. Rhpn1 knockout (KO) mice purchased from the Knockout Mouse Project (KOMP) repository at the University of California, Davis (UC Davis) were bred on a C57BL/6NJ (B6N) background. The Highper locomotor
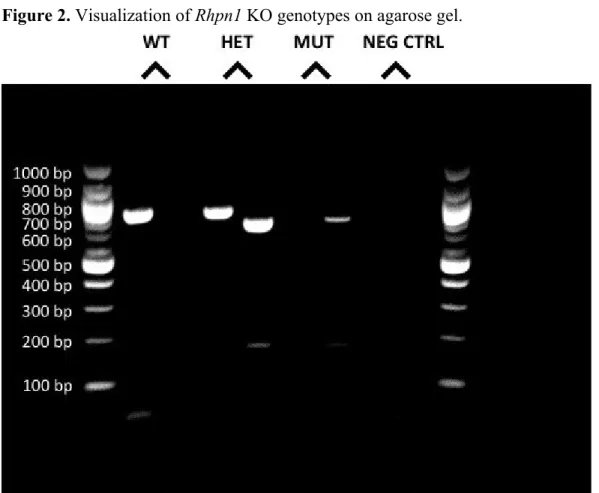
phenotype was assessed in an open field arena and affected animals were crossed to maintain the line (Eisener-Dorman et al. 2012). Rhpn1 KO mice were maintained by breeding heterozygotes, resulting in wildtype (WT), heterozygous (HET), and mutant (MUT) progeny.
Genotyping
DNA of the Rhpn1 mice was extracted from tail tissue using a Qiagen DNEasy Blood & Tissue Kit in accordance with standard manufacturer’s procedures. Following extraction, DNA concentration and purity were measured using a NanoDrop 8000 UV-Vis
Spectrophotometer. The concentration of DNA necessary for polymerase chain reaction (PCR) was 30 ng/μL; any measured sample concentration higher than that was diluted down to the correct concentration with double distilled water. Purity of DNA was assessed via the ratio of absorbance at 260 nm and 280 nm (260/280). The accepted range for pure DNA fell between a 260/280 ratio of 1.8-2.0. A ratio outside those limits indicates the presence of protein or other contaminants. DNA was amplified via PCR in order to determine the genotype. Mastermixes were made for both the WT and KO alleles. Primers were designed that targeted the Rhpn1 gene for WT and KO alleles are shown in Table 1.
Exon 6 Intron Exon 7
A
.
Rhpn1
transcript.
B.
Alternative splice variant of
Rhpn1
transcript.
Exon 6 Exon 7
Table 1. PCR primers for Rhpn1 KO mice.
Primer Sequence Product Size
Wildtype_2_Fwd CCGGTGCTGAAAACCTCTAC 793 bp
Wildtype_2_Rev TGCAGGTTGGAGTTGACGTA
KO_2_Fwd TTCAACATCAGCCGCTACAG 711 bp
KO_2_Rev CATGTCTCTTTCCCGAGAGC
The amplified DNA was visualized via gel electrophoresis using a 2% agarose gel. The gel was run for 1.5-2 h at 90 volts (V). WT and KO’s for each mouse ID were run in adjacent lanes. Products were visualized using a Bio-Rad Versadoc 3000 Gel Imaging System.
BCA Protein Assay
The left hemispheres of brains from affected Highper mice (N=2), Rhpn1 KO (N=2), and B6J WT mice (N=2) were dissected and homogenized with a homogenizing kit (Omni International). Kidneys from B6J WT mice (N=2) were also dissected and homogenized due to high expression of Rhophilin-1 in mouse kidney (Lal et al. 2015). 1.5 mL of RIPA buffer as well as 15 µL protease and phosphatase inhibitor was added to each sample. Standards were prepared using a Pierce BCA Protein Assay Kit. Ampules containing 1 mL of bovine serum albumin (BSA) at 2000 µg/mL were diluted with RIPA buffer to prepare nine different standards. The standards and brain samples were pipetted into a 96-well plate in duplicate, with the brain samples diluted by x10. Working reagent was prepared using 50 parts Reagent A: 1 part Reagent B (provided by the kit). Into each well, 200 µL of working reagent was pipetted and placed on a shaker for 30 s. A color change was observed as the samples in each well changed from colorless to varying shades of purple. The plate was then covered and incubated at 37˚C for 30 minutes. After cooling to room temperature, the plate was read using a Beckman Coulter DTX 880 Multimode Detector at 595 nm.
Quantitative Western Blotting
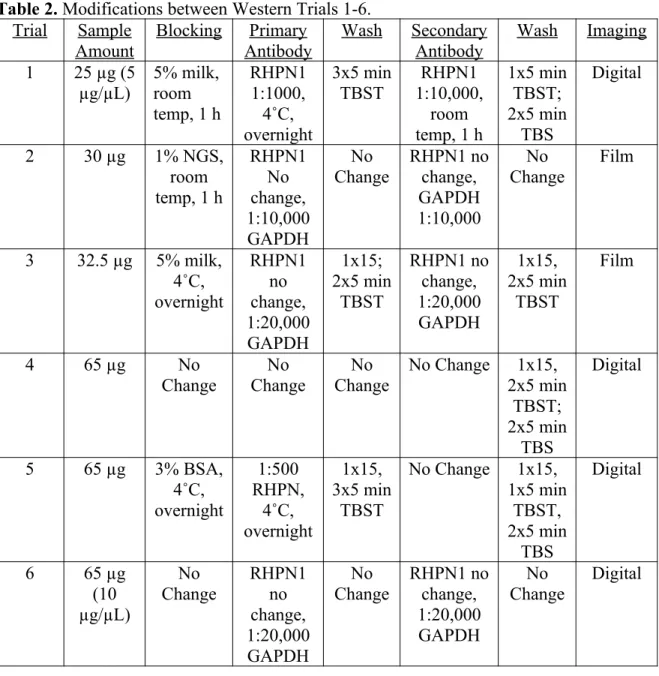
antibody dilutions and wash times varied trial to trial. Imaging of membranes also varied trial to trial between digital and film. The changes between each trial are described in brief in Table 2:
Table 2. Modifications between Western Trials 1-6. Trial Sample
Amount Blocking AntibodyPrimary Wash SecondaryAntibody Wash Imaging 1 25 µg (5
µg/µL)
5% milk, room temp, 1 h
RHPN1 1:1000, 4˚C, overnight 3x5 min TBST RHPN1 1:10,000, room temp, 1 h
1x5 min TBST; 2x5 min
TBS
Digital
2 30 µg 1% NGS, room temp, 1 h
RHPN1 No change, 1:10,000 GAPDH No Change RHPN1 no change, GAPDH 1:10,000 No Change Film
3 32.5 µg 5% milk, 4˚C, overnight RHPN1 no change, 1:20,000 GAPDH 1x15; 2x5 min TBST RHPN1 no change, 1:20,000 GAPDH 1x15, 2x5 min TBST Film
4 65 µg No
Change
No Change
No Change
No Change 1x15, 2x5 min
TBST; 2x5 min
TBS
Digital
5 65 µg 3% BSA, 4˚C, overnight 1:500 RHPN, 4˚C, overnight 1x15, 3x5 min TBST
No Change 1x15, 1x5 min
TBST, 2x5 min
TBS
Digital
6 65 µg
(10 µg/µL) No Change RHPN1 no change, 1:20,000 GAPDH No Change RHPN1 no change, 1:20,000 GAPDH No Change Digital Western Trials
room at 4˚C. Membrane was then washed with TBST (3 x 5 min) before applying goat anti-rabbit secondary horseradish peroxidase antibody at 1:10,000 (2 µL in 20 mL blocking buffer) on a shaker for 1 h on bench top. Membrane was washed with TBST (1 x 5 min) and TBS (2 x 5 min). Amersham ECL Prime Western Blotting Detection Reagent was applied to membrane and allowed to sit on bench top for 5 min before being imaged using a ProteinSimple FluorChem E Imaging System.
(Trial 2) Samples contained 6 µL homogenized brain (30 µg protein), 2.5 µL sample buffer, 1 µL reducing agent, and 0.5 µL deionized water. Membrane was blocked for 1 h in 1% normal goat serum (200 µL in 20 mL TBST blocking buffer). Prior to applying primary antibody, the membrane was cut right under the 55 kDa marker. Primary antibody was applied at 1:10,000 (2 µL in 20 mL of blocking buffer) for GAPDH. Membranes were washed in TBST (3 x 5 min) before applying secondary antibody at 1:10,000 (2 µL in 20 mL blocking buffer) goat anti-mouse horseradish peroxidase for GAPDH and placed on a shaker for 1 h on bench top. Membrane was washed with TBST (1 x 5 min) and TBS (2 x 5 min). Membrane was imaged on film courtesy of the
Burridge Lab (UNC Lineberger Comprehensive Cancer Center).
(Trial 3) Samples contained 6.5 µL homogenized brain (32.5 µg protein), 2.5 µL sample buffer, and 1 µL reducing agent. Blocked for 24 h in 5% non-fat dry milk (7.5 g in 150 mL TBST blocking buffer) on a shaker in cold room at 4˚C. Primary antibody was applied at 1:20,000 (1 µL in 20 mL blocking buffer) for GAPDH and placed on shaker for 1 h on bench top. Membranes were washed in TBST (1 x 15 min; 2 x 5 min) Secondary antibody probing for GAPDH at 1:20,000 (1 µL in 20 mL blocking buffer) and placed on shaker for 1 h on bench top. Membranes washed in TBST (1 x 15 min; 1 x 5 min), and then repeated with TBS.
(Trial 4) Samples were doubled up to a total of 20 µL per well for this trial. Each sample contained 13 µL homogenized brain (65 µg protein), 5.0 µL sample buffer, and 2 µL reducing agent. After primary antibody application, membranes were washed in TBST (1 x 15 min; 2 x 5 min) before applying secondary antibody. Membranes were placed on a shaker for 1 h on bench top and then washed in TBST (1 x 15 min; 1 x 5 min) and in TBS (2 x 5 min) before applying ECL kit and letting sit for 5 min. Blots were imaged using a ProteinSimple FluorChem E Imaging System.
(Trial 6) New working samples were prepared for this trial, with a concentration of 10 µg/µL in each sample. Samples contained 6.5-µL (65 µg) brain, 2.5 µL sample buffer, and 1 µL reducing agent. In addition to the eight samples that have been used in each trial, another sample containing 3T3 cell lysate (courtesy of the Burridge Lab) was also prepared due to previous success by the Burridge Lab in obtaining a signal. The membrane was cut under the 55 kDa marker to separately apply primary antibody for RHPN1 and GAPDH. Membranes were then washed in TBST (1 x 15 min; 3 x 5 min) before applying secondary antibody. Membranes were placed on a shaker for 1 h at room washed in TBST (1 x 15 min; 1 x 5 min) and TBS (2 x 5 min) before imaging.
Results:
Rhpn1 KO mice bred in HETxHET manner result in WT, KO, and MUT progeny A representative gel used for genotyping Rhpn1 mice is shown in Figure 2.
Preparation of BCA Standard Curve
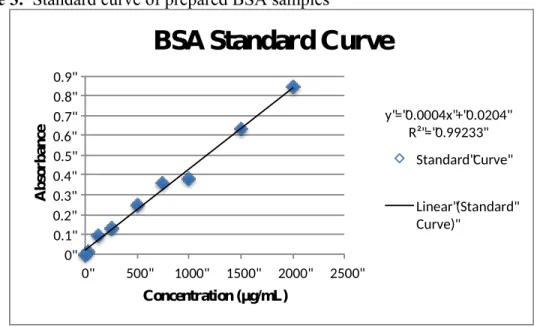
The standard curve was prepared by diluting down samples of BSA with known concentrations to a range of varying concentrations (Table 3). The absorbance values of these standards are then read with a spectrophotometer, averaged, and then corrected by subtracting the absorbance value of the “blank” (Table 4) from each sample’s absorbance value.
Table 3. Preparation of BSA standards for BCA Assay. Vial Diluent Volume
(µL) Vol. and Sourceof Std (µL) Final Std. Conc.(µg/mL)
A 0 300 of BSA stock 2000
B 125 375 of BSA stock 1500
C 325 325 of BSA stock 1000
D 175 175 of Vial B
dilution
750
E 325 325 of Vial C
dilution
500
F 325 325 of Vial E
dilution
250
G 325 325 of Vial F
dilution 125
H 400 100 of Vial G
dilution 25
I 400 0 0
Table 4. Absorbance readings for BSA standards. Readings were averaged and then corrected by subtracting the absorbance average from (I) for each standard.
Concentration
(µg/ml) Absorbance#1 Absorbance#2 AbsorbanceAverage CorrectedAverage
(A) 2000 1.1691 1.3151 1.2421 0.84765
(B) 1500 1.0463 1.007 1.02665 0.6322
(D) 750 0.7445 0.7559 0.7502 0.35575
(E) 500 0.6648 0.6196 0.6422 0.24775
(F) 250 0.5076 0.5422 0.5249 0.13045
(G) 125 0.4756 0.5017 0.48865 0.0942
(H) 25 0.412 0.4046 0.4083 0.01385
(I) 0 0.4137 0.3752 0.39445 0
After the curve has been generated (Figure 3), it can be used to determine the concentrations of the homogenized brain samples that are plated alongside the standards and read with a spectrophotometer. The absorbance values for the samples were
averaged and corrected in an identical manner to the standards (Table 5).
Figure 3. Standard curve of prepared BSA samples
y"="0.0004x"+"0.0204" R²"="0.99233" 0" 0.1" 0.2" 0.3" 0.4" 0.5" 0.6" 0.7" 0.8" 0.9"
0" 500" 1000" 1500" 2000" 2500"
A bs or ba nc e Concentration (µg/mL)
BSA Standard Curve
Standard"Curve"
Linear"(Standard" Curve)"
Table 5. Absorbance readings for homogenized brain samples. Sample # Absorbance
#1 Absorbance #2 Absorbance Average Corrected Average Concentration (µg/mL) Concentration (µg/µL) Highper #1
0.9462 0.9228 0.9345 0.54005 1299.13 12.99
Highper
#2 0.84 0.8508 0.8454 0.45095 1076.38 10.76
Rhpn1
Rhpn1
KO #2 0.8334 0.8768 0.8551 0.46065 1100.63 11.01
B6J WT CTRL
#1
0.9263 0.9164 0.92135 0.5269 1266.25 12.66
B6J WT CTRL
#2
0.901 0.8839 0.89245 0.498 1194.00 11.94
B6J WT Kidney
#1
0.9624 0.8617 0.96205 0.5676 1368.00 13.68
B6J WT Kidney
#2
0.9983 0.9912 0.99475 0.6003 1449.75 14.50
Western Blots
With a molecular weight of 76.2 kDa, bands representing RHPN1 would be expected to be present slightly above the 70 kDa marker when compared to the protein ladder used in the trials (shown below):
GAPDH served as a loading control for these trials due to the fact that it’s
expressed in nearly all tissues and cells, providing a stable option to use as a control. In addition to its reliability as a control, the molecular weight of GAPDH is roughly 37 kDa, making it easy to differentiate between the two signals cutting the membrane and probing with the antibodies.
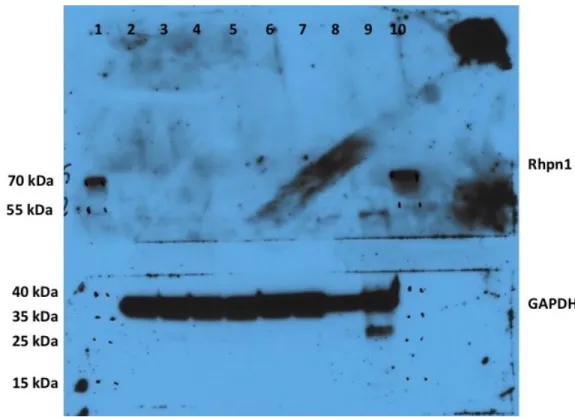
Multiple trials were performed in succession in order to troubleshoot and fine tune variables to obtain optimal results. For Trial 1, we began by using 25 µg of protein, blocked the membrane in 5% non-fat dry milk at room temperature for an hour, and probed with the primary antibody overnight at 4˚C and secondary antibody at room temperature for an hour. The first trial was then digitally imaged (Figure 5):
RHPN1 Expecte d
Figure 4. Western blot of Trial 1. Each well represents: 1) Protein ladder 2) Highper 3) Highper 4) Rhpn1 KO 5) Rhpn1 KO 6) B6 WT 7) B6 WT 8) B6 WT Kidney #1 9) B6 WT Kidney #2 10) Protein ladder.
Several issues were apparent after the first trial. While there was a faint signal for both kidneys, there was no evidence of any signal in any of the other lanes. In addition to that, a high background on the blot also made it difficult to read. Furthermore, the imaging system that was used had been damaged with water behind the lens, which also made this blot hard to read. Adjustments that were made leading up to the second trial included increasing the protein amount to 30 µg, switching the blocker to 1% normal goat serum, and imaged the blot on film. We also probed for GAPDH in the second trial (Figure 6).
While there was greater success in eliminating the background compared to the first trial, there doesn’t appear to be any signal on the RHPN1 blot. There’s also some smears on the blot that make it difficult to read. The GAPDH signal came out very strong as expected. For Trial 3, the adjustments made were to increase the protein amount to 32.5 µg, switching back to 5% non-fat dry milk and blocking overnight at 4˚C at the
suggestion of our collaborator in the Burridge Lab. We also increased the total time spent washing the membranes. The results of Trial 3 are shown in Figure 7 below:
Figure 7. Western blot of Trial 3. Processed on film overnight. Each well represents: 1) Protein ladder 2) Highper 3) Highper 4) Rhpn1 KO 5) Rhpn1 KO 6) B6J WT 7) B6J WT 8) B6J WT Kidney #1 9) B6J WT Kidney #2 10) Protein ladder.
These changes resulted in a blot with virtually no background, but no signals on the RHPN1 blot. The GAPDH bands were not as uniform compared to the previous trial either. For Trial 4, the changes we made were increasing the protein amount to 65 µg, and retooling the wash times. We also switched back to digital imaging after the system had been repaired (Figure 8).
The results in Figure 9 were quite similar to Figure 8. No signals again for RHPN1, and missing bands for GAPDH as well. For Trial 5, we made additional changes, deciding to probe with the primary antibody overnight at 4˚C with a greater dilution, and blocked the membrane in 3% BSA.
Figure 9. Western blot of Trial 5. Each well represents: 1) Protein ladder 2) Highper 3) Highper 4) Rhpn1 KO 5) Rhpn1 KO 6) B6J WT 7) B6J WT 8) B6J WT Kidney #1 9) B6J WT Kidney #2 10) Protein ladder.
kidneys appeared right above 70 kDa similar to Figure 2. In addition, several non-specific bands appeared in the kidney lanes between 40 kDa and 55 kDa. For Trial 6, we remade working solutions of the brain and kidney samples, using a concentration of 10 µg/µL instead of 5 µg/µL. We also used a 3T3 cell lysate sample that was borrowed from our collaborator in the Burridge Lab that had previous success in obtaining a signal for RHPN1. We also probed for GAPDH in this trial (Figure 10).
Figure 10. Western blot of Trial 6. Each well represents: 1) Protein ladder 2) Highper 3) Highper 4) Rhpn1 KO 5) Rhpn1 KO 6) B6J WT 7) B6J WT 8) B6J WT Kidney #1 9) B6J WT Kidney #2 10) 3T3 cell lysate 11) Protein ladder.
Discussion:
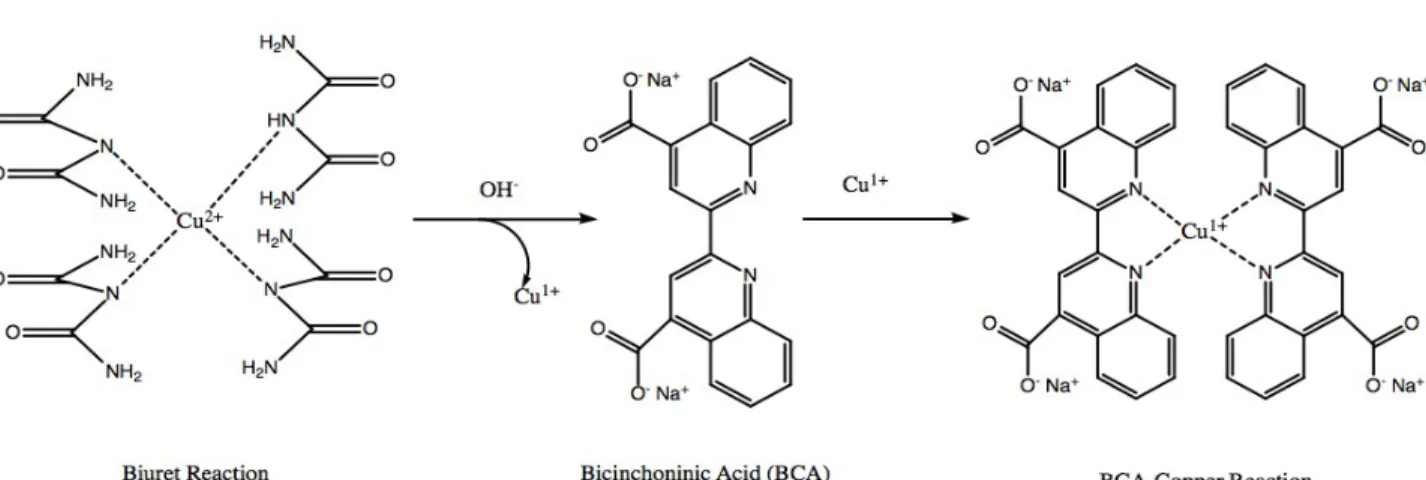
The BCA assay is a copper-based assay involving a two-step reaction that leads to the reduction of copper from Cu2+ to Cu1+ and the chelation of bicinchoninic acid (BCA)
to Cu1+. The formation of this complex produces a very bright purple color. The first
step of the reaction, known as the Biuret reaction, leads to the reduction of Cu2+ to Cu1+ as
polypeptides chelate with Cu2+ ions to produce a violet blue color (Smith et al, 1985).
Color intensity varies depending on the concentration of the protein. In the second step of the process, the Cu1+ ions produced by the Biuret reaction chelate with BCA, with each
complex consisting of two BCA molecules and one Cu1+ ion and results in a purple
measure protein concentrations as shown in the formation of the standard curve in this experiment and for the samples in question as well. The two-step reaction is shown below in Figure 11:
Figure 11. BCA-Cu1+ complex formation.
After the protein concentrations from the brain and kidney samples were
determined from the standard curve, the next step was visualizing the protein via Western blotting. This required significant troubleshooting as several issues arose with the resulting Western blots. The initial issue that arose came from the very high background on the blots, making it very difficult to read and see if there was any protein present. We were able to correct this and significantly reduce the background by increasing the overall number of washes between application of the primary and secondary antibody. We also moved from blocking at room temperature to 4˚C in order to reduce the
likelihood of any non-specific binding occurring. We also moved away from using 5% non-fat dry milk as a blocker in favor of BSA as well due to the fact that there is a greater chance for non-specific binding when using milk and milk poses a greater chance of being incompatible with certain detection labels. With BSA, there’s only one protein in the blocking solution so there’s also less cause for concern in any sort of cross-reaction with the antibody that can also occur when using milk.
There was some initial success with getting the GAPDH loading control to work, with bands appearing right around the expected 35 kDa. In subsequent blots however, the GAPDH bands were uneven and in some cases missing from some of the lanes after reducing the dilution to 1:20,000. Without adjusting any of the amounts used, later trials had GAPDH bands appearing in their correct position on the blot, leading us to believe that there might have been an issue with how the gel had been run. After successfully reducing the background and getting the loading control to work, the next issue was that there was no signal whatsoever for the RHPN1 protein. In addition to all the other previous adjustments, we then moved to apply the primary antibody for a 24-hour period instead of 1 hour on the bench top. We found bands to be exhibited on the RHPN1 membrane after this adjustment, however they were not at the expected weight for RHPN1. In separate trials we found bands exhibited both above and below the expected 70 kDa marker (Figure 9 and Figure 10). Albeit weak, faint bands were observed in the kidney samples in the expected area for RHPN1.
70 kDa marker, which if assumed to be RHPN1 could be the result of protease degradation or an unbroken quaternary structure, respectively (Mahmood and Yang, 2012). With that assumption however, another issue arises due to the fact that the Rhpn1 KO samples are exhibiting bands where they shouldn’t be. We utilized 3T3 cell lysate in Trial (6) to see if the expected band lined up with the other bands that we are continually seeing above and below the 70 kDa marker. Due to the fact that we didn’t get a band at all, more troubleshooting will be necessary before the next experiment with regards to the lysate. When given the sample from our collaborator, we weren’t given specifics as far the concentration of the sample and how much to use when preparing the denaturing electrophoresis samples. We will likely need to use a larger amount of lysate, the
reasoning being the comparison of GAPDH bands of the cell lysate to the other samples. Additional directions to consider is to use mass spectrometry to break down the proteins into strands of amino acids and match them up to known sequences to see if the bands we are seeing are indeed RHPN1. Another direction would be to explore using different antibodies in the hope that some detection labels could work better with the blocking solutions we have been using. Our current antibody is targeting amino acids 478-505 from the C-terminal region of RHPN1. Since we’re not sure which region of the protein is altered, an alternative antibody that tags an earlier portion of the protein could be an option in obtaining a stronger signal.
Conclusions:
Thus far we have successfully been able to get a properly working loading control for the Western blots. As previously mentioned, more troubleshooting will be necessary in getting a signal for RHPN1. Some options include utilizing a different primary antibody, changing the amount of primary antibody and protein used, using different blockers, as well as potentially homogenizing new brain samples and running another BCA assay. Mass spectrometry is another possible option to explore. Once we
Acknowledgements:
Dr. Lisa Tarantino: Thank you for welcoming me into your lab (and always asking if I have my Epipen). Working in this lab has been one of the brightest spots of my UNC career, thank you for allowing me to learn and grow from this experience.
Sarah Schoenrock: Thank you for being patient with me and teaching me so many things. I’ve learned so much in the span of this year and you are to credit for that growth. Looking forward to calling you Dr. Schoenrock very soon!
Ken Walsh: Thank you for being my wise sensei and literally teaching me all there is to know about Western blots, this project would have never happened if it weren’t for everything you did. Thank you for the great stories and the awesome conversations as well!
Joe Farrington: Thank you for the constant jokes and laughs, all the Pick 6’s, and for being one of the nicest people I’ve ever met. You made lab such a fun place to be, thank you for making it feel like home.
References:
1. Bierut LJ, Dinwiddie SH, Begleiter H, Crower RR, Hesselbrock V, Nurnberger JI Jr, Porjesz B, Schuckit MA, Reich T (1998) Familial transmission of
substance dependence: alcohol, marijuana, cocaine, and habitual smoking: a report from the Collaborative Study on the Genetics of Alcoholism. Arch Gen Psychiatry 55:982-988.
2. Covington, H; Miczek, K. (2001) Repeated social-defeat stress, cocaine or morphine. Psychopharmacology, 158:388-398.
3. Crabbe JC, Belknap JK, BuckJK (1994) Genetic animal models of alcohol and drug abuse. Science 264:1715-1723.
4. Eisener-Dorman AF, Bailey JS, Grabowski-Boase L, Huitron-Resendiz S, Roberts AJ, Wiltshire T, Tarantino LM (2012) Characterization of Highper, an ENU-induced mouse mutant with abnormal psychostimulant and stress
responses. Psychopharmacology 223:407-419.
5. George FR, Goldberg SR (1989) Genetic approaches to the analysis of addiction processes. Trends Pharmacol Sci 10:78-83.
6. Haile CN, Hiroi N, Nestler EJ, Kosten TA (2001) Differential behavioral responses to cocaine are associated with dynamics of mesolimbic dopamine proteins in Lewis and Fischer 344 rats. Synapse 41:179-190
7. Lal MA, Andersson AC, Katayama K, Xiao Z, Nukui M, Hultenby K, Wernerson, A, Tryggvason K (2015) Rhophilin-1 is a key regulator of the podocyte cytoskeleton and is essential for glomerular filtration. Journal of the American Society of Nephrology: JASN 26:647-662.
8. Mahmood T, Yang PC (2012) Western blot: Technique, theory, and trouble shooting. N. Am. J. Med. Sci 4:429-434.
10. Peck JW, Oberst M, Bouker KB, Bowden E, Burbelo PD (2002) The RhoA-binding protein, rhophilin-2, regulates actin cytoskeleton organization. J Biol Chem 277:43924-43932.
11. Piazza PV, Deminiere JM, Maccari S, Mormede P, Le Moal M, Simon H (1990) Individual reactivity to novelty predicts probability of amphetamine self-administration. Behav Pharmacol 1:339-345.
12. Ruiz-Durantez E, Hall SK, Steffen C, Self DW (2006) Enhanced acquisition of cocaine slef-administration by increasing percentages of C57BL/6J genes in mice with a nonpreferring outbred background. Psychopharmacology (Berl) 186:553-560
13. Seale TW, Carney JM (1991) Genetic determinants of susceptibility to the rewarding and other behavioral actions of cocaine. J Addict Dis 10:141-162 14. Smith PK, Krohn RI, Hermanson GT, Mallia AK, Gartner FH, Provenzano MD,
Fujimoto EK, Goeke NM, Olson BJ, Klenk DC (1985) Measurement of protein using bicinchoninic acid. Anal Biochem 150 76-85.
15. Uhl GR, Elmer GI, LaBuda MC, Pickens RW (1995) Genetic influences in drug abuse. In: Bloom FE, Kupfer DJ (eds) Psychopharmacology: the fourth
generation of progress. Raven, New York, pp. 1793-1806.
16. Wiltshire T, Ervin RB, Duan H, Bogue MA, Zamboni WC, Cook S, Chung W, Zou F, Tarantino LM (2015) Initial locomotor sensitivity to cocaine varies widely amond inbred mouse strains. Genes, Brain, and Behavior. 14:271-280.