Sharif University of Technology
Scientia IranicaTransactions C: Chemistry and Chemical Engineering http://scientiairanica.sharif.edu
Surface modication of vulcanized EPDM rubber by
Ag(II): Kinetic study of Ag(II) generation and surface
characterization
Sh. Mokhtari
a, F. Mohammadi
a;, and M. Nekoomanesh Haghighi
ba. Petrochemicals Synthesis Department, Iran Polymer and Petrochemical Institute, Tehran, P.O. Box 14965/115, Postal Code 14977-1311, Iran.
b. Department of Engineering, Iran Polymer and Petrochemical Institute, Tehran, P.O. Box 14965/115, Postal Code 14977-1311, Iran.
Received 4 October 2016; received in revised form 2 October 2017; accepted 7 May 2018
KEYWORDS EPDM surface modication; Electro-membrane reactor;
Kinetic parameters; Silver(II);
Cyclic
voltammety and choronopotentiometry techniques.
Abstract.Ethylene Propylene Diene Monomer (EPDM) rubber is widely used in various outdoor and industrial applications. However, in order to improve its adhesion properties, some surface modications are required. Mediated electrochemical oxidation by Ag(II) was, thus, employed to evaluate the feasibility of EPDM surface modication. The electrochemical behavior of Ag(I)/Ag(II) redox couple was initially studied at dierent temperatures in an electro-membrane cell using IrO2/Ta2O5anode. The reversibility of
the redox reaction improved at low temperatures. The apparent rate constant for Ag(I) oxidation (k1) at 3 kA m 2was 2:20310 3(s 1). The surface chemistry, morphology, and
wettability of the activated EPDM rubber by Ag(II) were then analyzed, and the modied EPDM surface showed a signicant decrease in the water contact angle resulting in an increase in the surface free energy and improved wettability. ATR analysis revealed the presence of oxygen-containing polar groups on the modied rubber surface. SEM results showed that the short treatment time at room temperature only changed the morphology of the rubber surface, which is attributed to the etching of the outermost surface. © 2018 Sharif University of Technology. All rights reserved.
1. Introduction
The versatility of EPDM applications as an elastomer is attributed to its excellent bulk properties, such as low density, thermal protection, and admirable mechanical properties, in comparison with other elastomers used in similar applications [1]. In addition, EPDM rubber is cost eective in production and does not produce toxic compounds during burning process; hence, a
remark-*. Corresponding author. Tel.: +98 21 48662455; Fax: +98 21 44580192
E-mail addresses: [email protected] (Sh. Mokhtari); [email protected] (F. Mohammadi);
[email protected] (M. Nekoomanesh Haghighi) doi: 10.24200/sci.2018.20455
able growth can be materialized in the rubber industry for various outdoor and industrial applications, such as waterproof coatings, electrical insulation, pipes, and mounts in the last decades. However, EPDM suers from low values of surface energy which leads to poor adhesion properties of solid substrates. With the purpose of improving this characteristic, surface modication is, thus, required without aecting the bulk properties [2]. Therefore, plasma treatment has been extensively employed for treatment of polymer surfaces aiming to improve adhesion properties [3-5].
In recent years, increasing attention has been paid to the development of electrochemical modication of polymers by generation of powerful ionic oxidants as mediators such as silver(II), cerium(IV), cobalt(III), and manganese(IV) obtained from their stable lower
oxidation states [6,7]. The indirect electrolysis using Ag(I)/Ag(II) couple has the advantage of operating at low temperature and pressure. The process is easily controllable and no toxic or carcinogenic emissions are formed once proper precautions are undertaken [8,9].
Although the electrochemical oxidation of Ag(I) in acidic media has been already studied by dierent researchers, a majority of publications have been fo-cused on the applications of electro-generated Ag(II) using either expensive platinum or gold anodes for oxidation of chlorinated hydrocarbons [10], organic compounds [11], alcohols with a side chain of aromatic molecules [12], a mixed waste treatment process [13], and ethylene glycol destruction by a rotating disk electrode [14] or employing less available materials, as anode material such as antimony-doped tin dioxide, lead dioxide, Boron-Doped Diamond (BDD) [8,15], nio-bium [16], and uorine-doped tin oxide electrodes [17]. However, unfortunately, the kinetic of Ag(II) electro-generation has been overlooked. Therefore, the elec-trochemical characteristics of Ag(I)/ Ag(II) couple in commercially available IrO2/Ta2O5 anode need to
be explored. Therefore, in the rst part of this work, the electrochemical behavior of the Ag(II)/Ag(I) redox couple in nitric acid media are reported and evaluated in IrO2/Ta2O5 anode in a three-electrode
system using Naon®membrane. Cyclic voltammetry
and chronopotentiometry techniques are utilized to investigate the reversibility of the Ag(II)/Ag(I) redox couple in various concentrations of Ag(I) nitrate and a lower range of anolyte temperatures, compared to the conventional practices, in a membrane-divided cell. Kinetic and mass transfer characteristics of Ag(I) oxi-dation, including standard rate constant and diusion coecient at dierent operational variables, are also investigated. An optimum electrolyte composition and process parameters are consequently tackled in order to modify the EPDM rubber surface in these conditions.
In the second part, the surface electrochemical treatment of EPDM rubber was studied based on Ag(II) generated in optimum conditions obtained in this study.
Earlier studies revealed that the electrochem-ical treatment resulted in substantial improve-ments in adhesion properties and surface modica-tion of polypropylene (PP), styrene-butadiene block copolymer (SBS), fully-formulated vulcanized rubber (SBR) [6], PP-EPDM [18,19], and polybutadiene rub-ber (PB) [20]. In recent years, the possibility of using electrochemical technique for polymer modication has been studied particularly by Brewis, Dahm, and coworkers [6,7]. Preliminary results conrmed that the concentration rate of oxygen introduced onto the PP surface after electrochemical treatment by Ag(II) was limited to about 4% of atom oxygen, while at least 10% of atom oxygen was created into SBS and SBR.
In the case of SBS and SBR treated by Ag(II), the time-of-ight Secondary Ion Mass Spectroscopy (SIMS) recognized the chemical changes caused by Ag(II) treatment and the presence of hydroxyl, carbonyl, and carboxyl groups [6].
Through an electrochemical treatment technique, a large improvement to adhesion levels was obtained through the instrumentality of PP and HDPE, whereby the anolyte consisted of a solution of silver nitrate in dilute nitric acid [6]. Moreover, Brewis and Dahm [7] suggested that silver(II) ions attacked directly the carbon-hydrogen bonds of the polymers or unsaturated bonds of carbon-carbon in the diene polymers, leading to the formation of organo-silver complexes.
Recently, characterization and electrochemical surface modication of PP-EPDM blend by silver(II) have been reported, compared to those of the untreated and ame-treated blends. Our results revealed that, compared to the ame-treated method, treatment by Ag(II) can improve adhesion strength of the PP-EPDM by 20.7% [18]. Similarly, recently, Ronagh et al. [21] considered surface modication of BR and NR blends by Mediated Electrochemical Oxidation (MEO). They also reported a remarkable increase in surface oxygen content for BR, promoted by oxidation time noticeably. Although various scholars [6,7,18-21] have studied polyolen and rubber surface modication by MEO, electrochemical oxidation of EPDM rubber has not been addressed in literature yet. Therefore, the main objective of the second part of this study is aimed at evaluating the eectiveness of the mediated electrochemical treatment by Ag(II) for EPDM surface modication. The vital section of this investigation characterizes the generated polar groups on the acti-vated surface and tackles the adhesion problem of the EPDM lms. Herein, Ag(II) treated surface of the EPDM rubber is thus analyzed by contact angle mea-surement (CA), and total reection-Fourier transform infrared spectroscopy (ATR-FTIR) is attenuated. The modied EPDM surface morphology is also studied by Scanning Electron Microscopy (SEM). Thereafter, the results are compared to those of the untreated EPDM lm.
2. Experimental analysis 2.1. Chemicals
Ag(I) nitrate (Sigma-Aldrich, 99 wt.%) solution was prepared in aqueous nitric acid (Merck Inc.) to produce the concentration in the range of 0.05-1 mol/L. All other solutions were prepared from analytical grades (Merck Inc.) using deionized water.
2.2. Material
Kumho Chemical Company supplied samples of EPDM rubber with diene content of 4.5% and ethylene content
of 57%. The formulations included 100 phr (parts per hundred) of rubber, 5 phr of ZnO3 of stearic acid,
1 phr of antioxidant, 0.5 phr of Tetramethylthiuram Monosulde (TMTM), 1 phr of Mercaptobenzothiazole (MBT), and 2 phr of sulfur.
The rubber vulcanization was performed by an oscillating disk rheometer in 1.70 Hz oscillation fre-quency, 1 0:03 amplitude of oscillation, and 160
0:3C die temperature. The curing conditions and
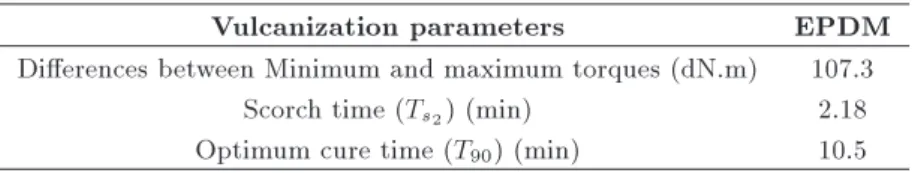
dierent properties of cured rubbers, such as optimum cure time, scorch time, minimum and maximum torque, and their dierences, were then optimized, as listed in Table 1. The vulcanization curve of the EPDM sample was also obtained, as depicted in Figure 1. According to these results, the scorch time (Ts2) for EPDM was
10 minutes. The dierence between minimum torque (ML) and maximum torque (MH) was also 107 dN.m.
Figure 1. Vulcanization curves of the EPDM rubber obtained by rheometry.
Rendering rheometer's vulcanization parameters was performed by a hot press to form rubber lms with a thickness of about 700 micron. Prior to any treatment, cleaning of the rubber samples (typically 3 2 cm2)
was carried out with a trichloromethane-based solvent; thereafter, they were dried at room temperature for 24 h. In the second part, after generating Ag(II) in optimum conditions, the rubber samples were placed in adjacent to the anode in the anolyte.
2.3. Electrolysis in a three-electrode H-type cell The electrogeneration of Ag(II) was performed in a divided H-type electrochemical cell, separated by a cation-exchange Naon® membrane (NF 115/H+).
The electrodes included commercial IrO2/Ta2O5(70/30
mol%) with a thickness of 10-12 m and titanium plates with a thickness of 2 mm as working, and counter electrodes with corresponding apparent surface area as much as 10 and 1.5 cm2, respectively [22]. The
reference electrode was a silver/silver chloride in 1 M KCl (E0= 0:222V versus SHE). The gap between two
electrodes was 8 cm. Figure 2 represents a schematic diagram of the electrochemical system used in this study. Prior to each test, the electrodes were cleaned by 2 mol/L HNO3 followed by the washing process
done with distilled water. The membrane was also treated by the procedure reported earlier [23]. The concentration of Ag(II) nitrate was determined by a back titration method using an excess of standard acid ammonium-free ferrous sulphate with a standard potassium permanganate solution as an indicator [9]. 2.4. Electrochemical study
Electrochemical measurements were carried out us-ing PGSTAT30 Potentiostat/Galvanostat model
(Eco-Figure 2. Schematic diagram of electro-membrane cell. Table 1. EPDM vulcanization parameters based on ASTM D2084.
Vulcanization parameters EPDM
Dierences between Minimum and maximum torques (dN.m) 107.3 Scorch time (Ts2) (min) 2.18 Optimum cure time (T90) (min) 10.5
Chemie Autolab) tted with the General Purpose Electrochemical Software (GPES). Cyclic voltammetry and chronopotentiometry techniques were employed to study those parameters that aect silver(I) oxidation. The cyclic voltammograms were obtained between 0.5-2.5 V versus Ag/AgCl at a potential sweep rate of 10-200 mV s 1. The anodic and cathodic peaks during
Ag(I) oxidation were detected automatically by the standard Autolab software (Eco chemie, GPES).
During cyclic voltammetry and chronopotentiom-etry experiments, the anolyte solution was not stirred; however, in order to have a uniform Ag(II) ion, distri-bution within the anolyte stirrer was used during the EPDM surface modication by Ag(II).
3. Results and discussion 3.1. Cyclic voltammetry studies
Figure 3 shows the eect of potential sweep rate on the cyclic voltammograms of Ag(I)/Ag(II) redox couple in a DSA (IrO2/Ta2O5) anode in the electrolyte
containing 0.1 mol/L Ag(I) nitrate in 6 mol/L of nitric acid at 298 K. Each curve is chosen from the third cycle. Although the peaks might not be observed sharply, they were detected automatically by the Autolab software (Eco Chemie, GPES), and their presence was conrmed within the reported potential range. Moreover, earlier investigations reported that the anodic and cathodic peaks at cyclic voltammo-grams obtained for electrochemical oxidation of Ag(I) to Ag(II) in nitric acid might be masked by oxygen evolution as a side reaction [10,16,24]. Therefore, background curve was also obtained in the absence of Ag(I) in the anolyte, as depicted in Figure 2, in order to evaluate the impact of oxygen evolution on the main voltammogram. However, as observed, following the subtraction of the background current
Figure 3. Cyclic voltammetry at various scan rates (T = 25C, Ag(I) nitrate: 0.1 mol/L, and supporting
electrolyte: 8 mol/L of nitric acid).
from the actual CV curves, shapes of anodic and cathodic peaks did not change signicantly. This can mislead one to the idea that, due to Ag(I) oxidation, some other unknown electrochemical processes may be realized during the anodic polarization; thus, the correct quantitative treatment of the experimental data may not be possible unless the impacts of unknown side electrochemical/chemical reactions are taken into account. However, by reviewing the related literature concerning the electrochemical oxidation of Ag(I) to Ag(II), one realizes that there are no unknown ad-ditional electrochemical side reactions during Ag(I) oxidation except oxygen evolution and charging of anodic double layer, which intrinsically does not come up with any peak, and silver oxide deposition onto the anode, which is a chemical precipitation, not an electrochemical reaction. This was because no addi-tional peak was observed in the cyclic voltammograms between 0.5-2 V versus Ag/AgCl in this medium in either CV curves obtained in this study or those reported earlier [12,15,25]. Besides, the mass of AgO precipitation at the end of experiment was less than 2%, according to our measurements. The only factor that makes the peaks in the CV curves equivocal is possibly the result of the anode activity reduction and an anodic overpotential increase during several anode potential cycling.
As also seen in Figure 3, the separation of peak potential increases with a scan rate. Table 2 lists separation of the peak potentials and the ratio of cathodic to anodic peak currents calculated from cyclic voltammograms recorded in the potential range of 0.5 to +1.9V versus AgjAgCl. The peak separation between the oxidation and reduction peak potentials (Ep) is approximately 68-110 mV at dierent scan
rates (> 59 mV). In addition, the ratio of cathodic to anodic peak currents is 0.38 (< 1:0), indicating its quasi-reversible nature for the silver redox couple with respect to IrO2/Ta2O5 anode [26,27]. It should be
noted that both peak separations and ratio of cathodic
Table 2. The eect of potential sweep rate on the peak separation potentials and the ratio of peak currents (T = 25C, Ag(I) nitrate: 0.1 mol/L, and nitric acid: 8
mol/L).
Potential sweep rate
(mV s 1)
Separation of the peak potentials
(mV)
Ratio of cathodic to anodic peak
currents
10 61 0.43
20 68 0.31
75 71 0.28
100 94 0.18
Figure 4. Randles-Sevcik plot (T = 25C).
to anodic peak currents are strongly inuenced by a scan rate. This is also in consistent with the other's ndings with regard to electrooxidation of Ag(I) in concentrated H2SO4 in a uorine-doped tin-oxide
anode [17].
The graphs of resulting peak currents versus square root of a scan rate for the oxidation and reduction reactions based on Randles-Sevcik equation (Eq. (1)) are also shown in Figure 4:
ip= 2:69 105n3=2D1=2Cb1=2; (1)
where ip is the peak current density (A cm 2), n
is the number of exchange electrons in the reaction, v is the scan rate in (V s 1), D is the diusion
coecient of Ag(I) in anolyte (cm2s 1), and Cb is the
Ag(I) nitrate concentration in the bulk (mol/L). The diusion coecient of Ag(I) in 8N HNO3was estimated
using the value of the slope from the Randles-Sevcik plot in Figure 4. As seen, a linear relationship between peak current density and the square root of the scan rate was obtained, showing a diusion-controlled reaction in IrO2/Ta2O5 anode. Thus, the oxidation
of Ag(I) to Ag(II) in IrO2/Ta2O5 anode could be
considered as a fast electron-transfer reaction. Similar results were observed for this electrochemical reaction in BDD electrode [8] and platinum anode [12], in which the higher oxidation state of Ag(I) could be obtained through a fast reaction. However, an initial diusion coecient of as much as 5:52 10 5 cm2s 1 at 25C
was calculated for Ag(I) based on these results which is surprisingly one order of magnitude higher than those reported earlier for Ag(I) ions using boron-doped diamond in 6 mol/L HNO3 (D = 8:51 10 6 cm2
s 1), antimony-doped tin dioxide (D = 6:3410 6cm2
s 1), and gold (D = 5:05 10 6 cm2 s 1) in 3 mol/L
HNO3. This discrepancy may be explained in the way
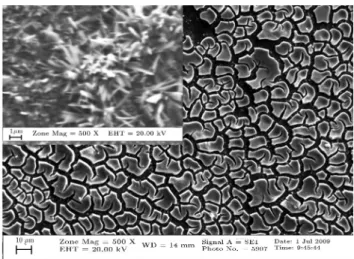
that the well-known Randles-Sevcik Equation used in the initial calculations is basically established upon the application of two-dimensional (2D) electrodes [8]. However, a close look at the SEM photograph of the DSA anode used in this study (see Figure 5) shows
Figure 5. SEM image of IrO2/Ta2O5with a cracked-mud
structure [18] (Ag(I) nitrate: 0.6 mol/L, nitric acid: 8 mol/L, and scan rate: 100 mV s 1).
that the actual surface of a DSA anode coating is a cracked-mud structure, which makes the anode coating (IrO2) porous; on the other side, three-dimensional
(3D) surface as in this issue was also fully explored by Trasatti and Petrii [28] and others [22]. Therefore, the real or electrochemically active surface area of 3D DSA anodes is generally about 10-20 times larger than its geometric area [22] improperly chosen as 1.5 cm2 as for the geometric surface area in our initial
calculations. Considering the ratio of the real to the geometric surface area in this study: (10-20) / 1.5, the actual peak current densities fall between (28-55 mA/cm2) corresponding to diusion coecients within
(1:82 5:72) 10 6 cm2/s with an average value of
3:82 10 6 cm2/s based on Randles-Sevcik Equation.
These values of diusion coecient for Ag(I) ions are now more consistent with the results reported by other researchers [8,25].
The number of studies on the electrochemistry of Ag(I)/ Ag(II) at below ambient temperatures is scarce [24]. Accordingly, cyclic voltammograms of Ag(I)/Ag(II) redox couple were obtained at dierent anolyte temperatures ranging from 10C to 30C,
and the results are displayed in Figure 6(a). The corresponding charge density involved in the oxidation/ reduction of Ag(I)/ Ag(II) couple is also represented in Figure 6(b). According to these results, by increasing temperature, the peak potential separation decreases from 252 to 191 mV, though the ratio of cathodic to anodic peak current is closer to one at lower tem-peratures. The CV responses in Figure 6(a) indicate that, at higher temperatures, anodic peak current is masked with O2 evolution; thus, the competing water
oxidation by Ag(II) process impacts the stability of Ag(II) in this medium and becomes more predom-inant [13]. Moreover, the poorly dened cathodic peak current observed means that the rate of Ag(II)
Figure 6. (a) Cyclic voltammetry at dierent temperatures. (b) Charge density for the Ag(I)/Ag(II) redox couple.
reduction is slower than that of the forward oxidation reaction.
As a result, at low temperatures, particularly below 30C, a more favorable electrochemical response
to oxidation of Ag(I) could be achieved because its con-version was higher in our previous obtained results [23]. Moreover, anolyte media at high temperatures favor NOx production by its reduction [9].
Other ndings in the literature also showed the similar behavior of low Ag(II) eciency at high tem-peratures using platinum anode [10].
The measurements of charge density during Ag(I) oxidation at various electrolyte temperatures showed some enhancement mainly due to oxygen evolution; however, with respect to Ag(II) reduction, charge density decreased considerably (see Figure 6(b)). It was already reported that the retardation of Ag(II) re-duction at elevated temperatures might be the result of slow adsorption of the charged species on AgO-covered IrO2/Ta2O5 electrode, which is also compatible with
the results reported earlier for the Pt electrode [12,25]. A series of cyclic voltammograms for Ag(I) to Ag(II) oxidants in IrO2/Ta2O5 anode at various
elec-trolyte temperatures were obtained to evaluate the formal potential (E0=), diusion coecient, and the
standard rate constant of this reaction. Table 3
sum-Table 3. Parameters for the Ag(II)/Ag(I) couple at various temperatures, estimated from cyclic
voltammograms recorded in the potential range from 0.5 to +2 V versus Ag/AgCl at 100 mV s 1. Ag(I) nitrate:
0.5 mol/L in 8 mol/L of HNO3.
Temperature (C)
E00
(V) versus Ag/AgCl
106D
(cm2 s 1)
103K0
(cm s 1)
10 1.672 4.23 2.12
12 1.698 4.09 1.64
25 1.693 3.82 1.33
28 1.703 3.78 1.27
30 1.685 3.01 1.24
marizes these estimated values. According to Eq. (2), E0= of the Ag(I)/Ag(II) couple in 8 mol/L HNO
3 was
determined by taking the mean average of the anodic and cathodic peak potentials where \m" is the number of scans:
E0== m
P
i=1(Epai+ Epci)=2
m : (2)
The diusion coecients (D) and standard rate con-stant (k0) were estimated at various temperatures by
Eqs. (3) and (4), respectively [27]:
Ip= 0:4463 nF AC(nF=RT )1=21=2D1=2; (3)
= K0=[D(nF=RT )]1=2; (4)
where Ip, , C, and A are the peak current, scan
rate, anolyte concentration, and electrode surface area, which is the real surface area in this study, respectively. is the degree of reversibility which can be calculated roughly by the peak potential separation. Moreover, value is considered to be equal to 0.1 for peak separation values about 212 mV and above [29].
As observed, the formal potential changed slightly within the temperature range of 10C to 30C, while
both diusion coecient and rate constant decreased with temperature, indicating that the electrochemistry of the Ag(I)/Ag(II) redox couple was favorable at elevated temperature due to acceleration of oxygen evolution and instability of silver(II) ions [10,11,23,24]. The standard rate constant obtained in this study agrees fairly well with the earlier measurements which were in the range of 2.3-2.910 3 cms 1 [16] using
boron-doped diamond on niobium (BDD/Nb) and platinized titanium (Pt/Ti) anodes in an electrolyte containing 0.05 mol/L of AgNO3 in 6 mol/L of nitric
acid at 30C.
3.2. Chronopotentiometry study
Figure 7 represents chronopotentiometry diagrams for Ag(I)/ Ag(II) redox couple, showing anode potential
Figure 7. Anode potential versus Ag/AgCl as a function of electrolysis time at various temperatures.
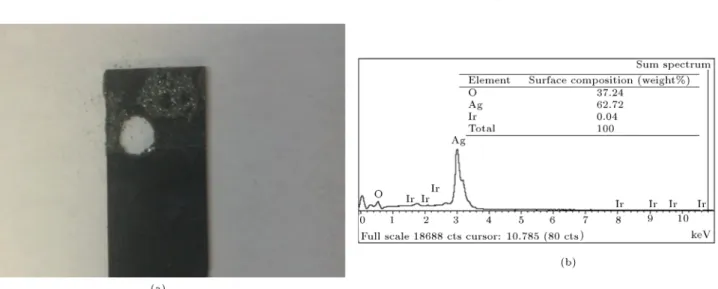
versus electrolysis time at various temperatures. As evident, the anode potential increases moderately as the anolyte temperature rises. It is mainly due to the enhanced competing oxygen evolution at elevated temperatures [30]. Besides, according to Figure 8(a) and the EDX analysis of the anode surface after 10 min at 35C (Figure 8(b)), the formation of AgO on the
anode surface becomes more predominant.
In addition, chronopotentiometry study was car-ried out to monitor the actual potential of the anode against nitric acid concentration, as a supporting electrolyte, during electrolysis. The working electrode potential was thus measured in dierent concentra-tions of the supporting electrolyte as anolyte, and the corresponding results are shown in Figure 9. As observed, an increase in anode (over)potential was observed upon increasing HNO3 concentration, and
its value uctuated considerably during electrolysis, particularly at 10 mol/L of HNO3. This issue
re-veals that, at the upper limit of acid concentration (10 mol/L and above), the competing Oxygen Evo-lution Reaction (OER) and NOx production may be
more predominant, hence leading to the deterioration
Figure 9. Anode voltage versus Ag/AgCl as a function of time for various nitric acid concentrations (Ag(I)-nitrate: 0.6 mol/L, scan rate: 100 mV s 1).
of the electro-membrane cell performance during elec-trolysis.
3.3. Apparent rate constants for oxidation/ reduction of Ag(I)/Ag(II) couple
The reaction of Ag(I) can be described simply by the following reaction scheme [17]:
Ag(I),k1
k2Ag(II): (5)
The succeeding rate law is written in the written to predict the apparent rate constants for Ag(I) oxidation (forward) and Ag(II) reduction (backward):
dCred
dt = dCoxd
dt = k1Coxd k2Cred; (6) where Cred and Coxd are the concentrations of Ag(I)
and Ag(II) at time t, respectively, while k1and k2 are
the apparent rate constants for oxidation of Ag(I) and reduction of Ag(II), respectively.
k1 can be calculated from the slope of:
Ln
(CCox;0 Cox;e
ox Cox;e
versus electrolysis time according to the following equation:
Ln
(CCox;0 Cox;e
ox Cox;e
=
1 XAe
k1t; (7)
where COx;0and COx;e are the initial and equilibrium
concentrations of Ag(I), respectively. XAe is also the
Ag(I) conversion at equilibrium per Eq. (8):
XAe= 1 (Cox;e=Cox;0): (8)
By using the equilibrium constant (kc), k2 can be
obtained from Eq. (9): kc =CCox;e
red;e =
k1
k2: (9)
According to Figure 10, a plot of Lnh(Cox;0 Cox;e Cox Cox;e
i against electrolysis time based on Eq. (8) shows a linear relationship (R2= 0:92 0:99), verifying the rst-order
reaction rate. The apparent rate constants, Ag(II) yield, current eciency, and energy consumption at dierent current densities were thus estimated and listed in Table 4. As expected, the current eciency initially increased signicantly with the current density up to 3 kAm 2; then, it decreased considerably. This
Figure 10. Polts of ln [(CA0-CAe)/(CA-CAe)] versus
electrolysis time for Ag(I) oxidation at dierent current densities (Ag(I)-nitrate: 0.5 mol/L, nitric acid: 8 mol/L). The standard deviation values are below 5% of the measured values.
fact is associated with the main electrochemical reac-tions in IrO2/Ta2O5 anode Ag(I) oxidation and water
electrolysis [11]. Accordingly, compared to the water electrolysis, Ag(I) oxidation improved inconsiderably with increasing the current density; hence, the CE decreased [23]. On the other hand, Ag(II) yield improved upon increasing the current density; however, the increase in Ag(II) yield after 3 kAm 2 is slight.
To put it dierently, higher anodic potential resulting from higher current densities would favor the silver oxides on the anode surface harmful to the reaction kinetics. Consequently, tted k1 and k2 increased by
the current density. It means that, after 3 kAm 2,
the rate of Ag(II) reduction (backward) is more than Ag(I) oxidation (forward) in Eq. (5); thus, Ag(II) yield increases slightly. Moreover, higher current densities lead to solvent oxidation and HNO2 production which
can be detrimental to the current eciency and energy consumption. Therefore, the current density of 3 kA m 2is the optimum value for A (I) oxidation.
3.4. Surface modication of EPDM rubber by Ag(II)
Surface wettability, functionality, morphology, and composition of Ag(II) treated EPDM rubber were studied with respect to the untreated EPDM sample by contact angle measurement, ATR, SEM, and EDX. Figure 11 depicts the contact angles and the polar component of surface free energy for both treated and untreated EPDMs as a function of electrolysis time. As evident, Ag(II) treatment produced an essential
Figure 11. Water contact angle and polar surface tension of untreated EPDM rubber and Ag(II) treated sample. Table 4. Parameters obtained from 0.5 mol/L of Ag(I) nitrate oxidation in IrO2/Ta2O5 anode at dierent current
densities.
Current density (kA/m2)
Anode potential vs. Ag/AgCl (V)
Yield (%)
Energy consumption
(W h g 1)
Current eciency
(%)
k1 104
(s 1)
k2 104
(s 1)
1 1.72 6.88 1.06 26.77 0.39 5.29
2 1.95 14.32 1.19 26.87 1.05 6.03
3 2.45 25.25 1.18 44.92 2.20 6.42
Table 5. Surface free energy resulting from electrochemical treated surfaces at dierent electrolysis times in comparison with untreated and ame-treated samples.
Type of treatment
Time (min)
Surface free energy (mN/m) p d p+ d
Untreated { 0.1 32.1 32.2
Electrochemically treated by Ag(II)
5 8.1 36.3 44.4 10 8.2 36.5 44.7 20 8.0 36.1 44.1 Flame treatment (ame speed : 400 mm/s) { 7.2 33.8 41.0
Figure 12. Water contact angle of Ag(II) treated EPDM rubber at dierent anolyte temperature.
modication on the EPDM surface chemistry, promot-ing a signicant reduction in water contact angle as a consequence of the increase in polar component of surface free energy, compared to the untreated EPDM rubber. It was also observed that the wettability of the EPDM rubber improved by increasing the electrolysis time up to 10 min; then, it was stabilized due to the steady-state concentration of Ag(II). Figure 12 shows changes in the water contact angle for the EPDM rubber after mediated electrochemical treatment by Ag(II) as a function of anolyte temperature. As observed, the anolyte temperature has a reverse eect on the surface wettability. Chemical etching and surface degradation of the EPDM surface at higher anolyte temperatures can explain this matter. This observation is in good agreement with the results obtained earlier for surface modication of PP-EPDM blend surface [18].
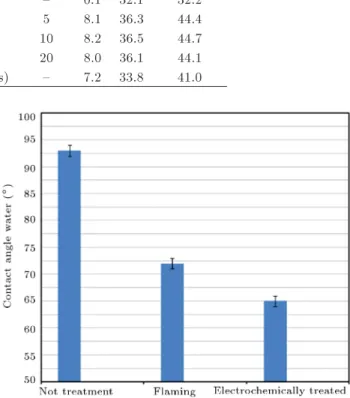
The results for contact angle measurements after electrochemical treatment in the presence of Ag(II) ions, in comparison with those of the untreated and ame-treated samples, were also obtained, as depicted in Figure 13. As observed, a substantial decrease in contact angle was seen after electrochemical treatment by Ag(II). It was reported previously that plasma treatment also changed the water contact angle of an EPDM lm down to 54 [31,32].
Based on Owens and Wendt method [18], by using water and diiodomethane, the total surface energy (t) and the polar component of the surface
Figure 13. Water contact angle of the EPDM samples treated by dierent methods.
energy (P) for all samples were evaluated, as listed
in Table 5. The maximum uncertainty calculated for the surface free energy was 1 mN/m. As observed, the water contact angle for the EPDM surface after electrochemical treatment dramatically decreased after 10 min, compared to the untreated sample. A further increase in electrolysis time led to a small change in the contact angle, showing that prolonged electrolysis time did not favor wettability. Besides, the ame-treated EPDM sample has a lower polar component due to less polar groups. However, the surface free energy and polar components were promoted considerably after electrochemical treatment.
The optimum operating parameters for EPDM surface modication were found to be consisting of anolyte temperature of 24C, contact time of EPDM
rubber with anolyte (10 min), and cell voltage of 2.2-2.4 volt.
Figure 14 presents the ATR-FTIR absorption of EPDM rubber surface treated by Ag(II) in comparison with the untreated sample. The band of 1750 cm 1
was assigned to the asymmetric C=O stretching band of Zn-stearate present in this system, appearing to be more evident after treatment, hence conrming the
Figure 14. ATR-IR spectra of Ag(II) treated EPDM rubber in comparison with untreated sample.
introduction of the carboxylic groups in the manufac-turing of rubber [1,33].
The intensive absorption peaks at 1267, 1166, and 1037 cm 1 after Ag(II) treatment were attributed to
-C-O stretching bands and formation of ester bands within the wave number range of 900 to 1300 cm 1.
Likewise, the strong wide absorption band on Ag(II) treated EPDM surface observed at around 3450 cm 1
was associated with the presence of hydroxyl and carboxyl groups [33]. It was clearly shown that, by A(II) treatment, free radicals on the EPDM surface were generated. These free radicals were combined with oxygen to form new functional groups (>C=O bond); hence, the surface became more hydrophilic in nature.
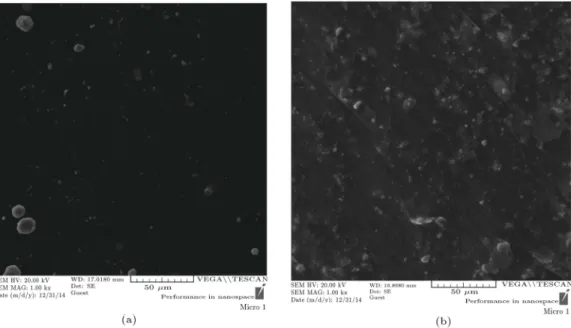
SEM micrographs taken from the untreated and electrochemically treated EPDM samples are
repre-sented in Figure 15. As evident, the untreated EPDM surface (Figure 15(a)) showed a smooth and even surface with no observable pores at this magnica-tion. However, for the EPDM sample oxidized by Ag(II) (Figure 15(b)), micro roughness was observed on the surface at the same magnication, indicating that Ag(II) treatment had an impact on the EPDM morphology. This observation is in agreement with the ndings of an earlier study in which morphology changes are detected after plasma treatment of an EPDM surface [33]. However, Da Maia et al. [1] showed that short plasma treatment time only changed the chemistry of the utmost EPDM rubber surface layers, keeping the integrity.
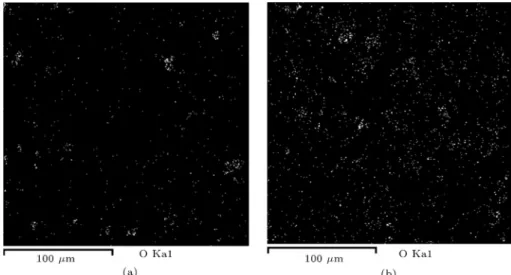
Figure 16 shows energy dispersive X-ray oxygen dot mapping of the untreated and Ag(II) treated samples. The number of oxygen dots on Ag(II) treated surface increased considerably (21.98 wt.%) in compar-ison with that of the untreated sample (8.27 wt.%). A good correlation between EDXA results and ATR-IR spectra shown in Figure 14 was established due to the formation of oxygen containing functional groups after Ag(II) treatment.
It is necessary to note that a controlled surface modication by Ag(II) does not have a signicant impact on the bulk properties, according to a recent study conducted in our laboratory [34]. A desired level of surface modication of Polybutadiene (PB) rubber was obtained after Ag(II) treatment without altering the PB bulk properties. DMTA analysis revealed that the changes of tan and glass transition temperature (Tg) after electrochemical oxidation by Ag(II) were not
noteworthy. Moreover, changes in modulus of elasticity followed a slight rising trend. It is thus expected that electrochemical treatment by Ag(II) should not have
Figure 16. EDX map of oxygen for EPDM rubber surface: (a) Untreated, and (b) treated by 0.6N of Ag(II) for 10 min.
a reasonable eect on the bulk properties of EPDM rubber. However, further study in our laboratory is underway to determine possible changes in tensile strength and elongation of the EPDM rubber after electrochemical oxidation by Ag(II).
4. Conclusion
The electrochemical conversion of Ag(I)/Ag(II) in nitric acid was found to be a quasi-reversible and diusion-controlled reaction in IrO2/Ta2O5 anode
based on the cyclic voltammetry study. The kinetic of Ag(I)/Ag(II) redox reaction improved at low tempera-tures, particularly below ambient temperature, while the peak potential separation decreased at elevated temperatures. This was mainly due to higher stability of Ag(II) ions, and the current eciency at low tem-perature improved due to the suppression of oxygen evolution at low temperatures. Chronopotentiometry study in dierent acid concentrations, as a supporting anolyte, showed a signicant increase in the anode po-tential. The apparent rate constant for Ag(I) oxidation (k1) at 10C and 0.5 mol/L of Ag(I) nitrate solution
was 2:203 10 3 (s 1).
EPDM rubber surface was treated electrochem-ically by the Ag(II) mediator at dierent anolyte temperatures. The measured contact angle values for the EPDM illustrated a signicant decline after Ag(II) treatment at room temperature in comparison with those for untreated and ame-treated samples. The anolyte temperature had also a reverse eect on the surface wettability. This is a promising technique to improve EPDM adhesion properties. ATR results approved incorporation of oxygen containing functional groups, such as carbonyl and hydroxyl, on the modied EPDM.
Based on the morphology study by SEM, the number and size of rubber particles formed on the
treated surface were reduced and chemically modied after a short contact with Ag(II) ions. The results also indicated that the EPDM surface morphology changed after Ag(II) treatment. EDX analysis also demon-strated the incorporation of about 22% oxygen on the rubber surface after treatment, mainly attributed to the formation of new functional groups.
Nomenclature
DSA Dimensionally Stable Anode
MEO Mediated Electrochemical Oxidation CVcurves Cyclic Voltammetry curves
CD Current Density (kA/m2)
EC Energy Consumption (W h g 1)
IP Peak current density (A cm 2)
n The number of exchange electrons in the reaction
v Scan rate (V s 1)
D Diusion coecient of Ag(I) in anolyte (cm2 s 1)
Cb Ag(I)-nitrate concentration in the bulk
(mol/L)
E0= Formal potential (V)
m Number of scans
Epai Anodic peak potential (V)
Epci Cathodic peak potential (V)
C Anolyte concentration (mol/L)
A Electrode surface area (cm2)
Degree of reversibility
K0 The standard rate constant (cm s 1)
Coxd Concentration of Ag(II) (mol/L)
k1 Apparent rate constants for oxidation
of Ag(I) (S 1)
k2 Apparent rate constants for reduction
of Ag(II) (S 1)
COx;0 Initial concentration of Ag(I) (mol/L)
COx;e Equilibrium concentration of Ag(I)
(mol/L)
XAe Ag(I) conversion at equilibrium
kc Equilibrium constant
t Total surface energy (t) and the
polar component of the surface energy (mN/m)
P Polar component of the surface energy
(mN/m)
d Disperse component of the surface
energy (mN/m) References
1. Da Maia, J., Pereira, F., Dutra, J., Mello, S., Becerra, E., and Massi, M. \Inuence of gas and treatment time on the surface modication of EPDM rubber treated at afterglow microwave plasmas", Applied Surface Science, 285, pp. 918-926 (2013).
2. Oliveira, Jr. M., Mello, S., da Silva Sobrinho, A., Grigorov, K., Massi, M., and Maciel, H. \Surface modication of EPDM rubber by microwave excited plasmas", Surface Engineering, 26, pp. 519-524 (2010).
3. Dutra, J.C.N., Massi, M., Otani, C., De Cassia
Lazzarini Dutra, R., Diniz, M.F., and Urruchi, W.I. \Surface modication of EPDM rubber by reactive argon-oxygen plasma process", Molecular Crystals and Liquid Crystals, 374, pp. 45-52 (2002).
4. Grythe, K.F. and Hansen, F.K. \Surface modication of EPDM rubber by plasma treatment", Langmuir, 22, pp. 6109-6124 (2006).
5. Santos, R.P., de Oliveira Junior, M.S., da Costa Mat-tos, E., Diniz, M.F., and Dutra, R.D.C.L. \Study by FT-IR technique and adhesive properties of vulcanized EPDM modied with plasma", Journal of Aerospace Technology and Management, 5, pp. 65-74 (2013).
6. Brewis, D., Briggs, D., Dahm, R., and Fletcher, I. \A ToF-SIMS study of electrochemical pretreatments for polymers", Surface and Interface Analysis, 29, pp. 572-581 (2000).
7. Brewis, D. and Dahm, R. \A review of electrochemical pretreatments of polymers", International Journal of Adhesion and Adhesives, 21, pp. 397-409 (2001).
8. Panizza, M., Duo, I., Michaud, P., Cerisola, G., and Comnellis, C. \Electrochemical generation of silver (II) at boron-doped diamond electrodes", Electrochemical and Solid-State Letters, 3, pp. 550-551 (2000).
9. Jones, C., Del Campo, J., Nevins, P., and Legg, S. \De-contamination/destruction technology demonstration for organics in transuranic waste", AEA Technology Engineering Services, Inc. (US) (2002).
10. Bringmann, J., Ebert, K., Galla, U., and Schmieder, H. \Electrochemical mediators for total oxidation of chlorinated hydrocarbons: formation kinetics of Ag (II), Co (III), and Ce (IV)", Journal of Applied Elec-trochemistry, 25, pp. 846-851 (1995).
11. Lehmani, A., Turq, P., and Simonin, J.P. \Oxidation kinetics of water and organic compounds by silver (II) using a potentiometric method", Journal of The Electrochemical Society, 143, pp. 1860-1866 (1996).
12. Fleischmann, M., Pletcher, D., and Ranski, A. \The kinetics of the silver (I)/silver (II) couple at a platinum electrode in perchloric and nitric acids", Journal of Applied Electrochemistry, 1, pp. 1-7 (1971).
13. Smith, W., Purdy, G., and McKee, S., Comparison of Silver (II), Cobalt (III), and Cerium (IV) as Electron Transfer Mediators in the MEO Mixed Waste Treat-ment Process, Los Alamos National Lab., NM (United States) (1997).
14. Farmer, J., Hickman, R., Wang, F., Lewis, P.,
and Summers, L., Initial Study of the Complete Mediated Electrochemical Oxidation of Ethylene Gly-col, Lawrence Livermore National Lab., CA (United States) (1991).
15. Panizza, M. and Cerisola, G. \Direct and mediated anodic oxidation of organic pollutants", Chemical Re-views, 109, pp. 6541-6549 (2009).
16. Racaud, C., Savall, A., Rondet, P., Bertrand, N., and Groenen Serrano, K. \New electrodes for silver (II) electrogeneration: Comparison between Ti/Pt, Nb/Pt, and Nb/BDD", Chemical Engineering Journal, 211, pp. 53-59 (2012).
17. Po lczynski, P., Jurczakowski, R., and Grochala, W. \Stabilization and strong oxidizing properties of Ag(II) in a uorine-free solvent", Chemical Communications, 49, pp. 7480-7482 (2013).
18. Mokhtari, S., Mohammadi, F., and Nekoomanesh, M. \Surface modication of PP-EPDM used in automo-tive industry by mediated electrochemical oxidation", Iranian Polymer Journal, 25, pp. 309-320 (2016).
19. Mokhtari, S., Mohammadi, F., and Nekoomanesh, M. \Mediated electrochemical degradation of polystyrene by silver (II): Optimization and kinetic studies", Int. J. Chem. Tech. Res., 5, pp. 2656-2671 (2013).
20. Ronagh-Baghbani, M., Mohammadi, F., and Naderi, G. \Surface characterization of polybutadiene and natural rubbers oxidized by silver (II)", Soft Materials, 14, pp. 187-198 (2016).
21. Ronagh-Baghbani, M., Naderi, G., and
Moham-madi, F. \Mediated electrochemical oxidation of vulcanized polybutadiene/organoclay nanocomposite-characterization and kinetic study", Polymer Degrada-tion and Stability, 131, pp. 30-41 (2016).
22. Klink, M.J., Ebenso, E., and Crouch, A.M. \Physico-chemical characterization of dierent preparation routes of binary and ternary metal oxides on titanium substrates", Int. J. Electrochem. Sci., 7, pp. 3018-3030 (2012).
23. Mokhtari, S., Mohammadi, F., and Nekoomanesh, M. \Eect of process parameters on the concentration, current eciency and energy consumption of electro-generated silver (II)", Chemical Papers, 69, pp. 1219-1230 (2015).
24. Rance, P., Nikitina, G., Korolev, V., Kirshin, M.Y., Listopadov, A., and Egorova, V. \Features of electrol-ysis of nitric acid solutions of silver: I. behavior of Ag (II) in HNO3 Solutions", Radiochemistry, 45, pp. 346-352 (2003).
25. Denuault, G., Fleischmann, M., and Pletcher, D. \A microelectrode study of the mechanism of the reactions of silver (II) with manganese (II) and chromium (III) in sulphuric acid", Journal of Electroanalytical Chemistry and Interfacial Electrochemistry, 280, pp. 255-265 (1990).
26. Leung, P., Ponce de Leon, C., Low, C., and Walsh, F. \Ce (III)/Ce (IV) in methanesulfonic acid as the pos-itive half cell of a redox ow battery", Electrochimica Acta, 56, pp. 2145-2153 (2011).
27. Bard, A.J. and Faulkner, L.R., Electrochemical Meth-ods: Fundamentals and Applications, Wiley New York (1980).
28. Trasatti, S. and Petrii, O. \Real surface area measure-ments in electrochemistry", Pure and Applied Chem-istry, 63, pp. 711-734 (1991).
29. Nicholson, R.S. \Theory and application of cyclic voltammetry for measurement of electrode reaction kinetics", Analytical Chemistry, 37, pp. 1351-1355 (1965).
30. Matheswaran, M., Balaji, S., Chung, S.J., and Moon, I.S. \Silver-mediated electrochemical oxidation: Pro-duction of silver (II) in nitric acid medium and in situ destruction of phenol in semi-batch process", Journal of Industrial and Engineering Chemistry-Seoul, 13, pp. 231-243 (2007).
31. Basak, G.C., Bandyopadhyay, A., Neogi, S., and
Bhowmick, A.K. \Surface modication of argon/ oxy-gen plasma treated vulcanized ethylene propylene di-ene polymethyldi-ene surfaces for improved adhesion with natural rubber", Applied Surface Science, 257, pp. 2891-2904 (2011).
32. Moraes, J.H. and Sobrinho, H.S. \Surface improve-ment of EPDM rubber by plasma treatimprove-ment", J. Phys. D: Appl. Phys., 40, pp. 7747-7752 (2007).
33. Bohm, K. \Compost quality determination using in-frared spectroscopy and multivariate data analysis",
Institute of Waste Management, Vienna, University of Natural Resources and Applied Life Sciences, PhD, p. 104 (2009).
34. Ronagh-Baghbani, M. \Mediated electrochemical ox-idation of polybutadiene rubber and polybutadi-ene/organoclay nano composite by silver (II)", PHD Thesis, Iran Polymer and Petrochemical Institute (2016).
Biographies
Shahrnaz Mokhtari is a Researcher of Chemical En-gineering at the Petrochemicals Synthesis Department, Iran Polymer and Petrochemical Institute (IPPI), Tehran, Iran. He received BSc and MSc degrees in Petrochemical Engineering from Tehran University, Tehran, Iran in 2001 and 2007, respectively, and PhD degree in Polymer Engineering from Iran Polymer and Petrochemical Institute, in 2015. His main area of interest includes mediated electrochemical oxidation of polymers and hydrocarbons, electromembrane, and gas conversion process.
Fereidoon Mohammadi is an Associate Professor of Chemical Engineering at the Petrochemicals Synthesis Department, Iran Polymer and Petrochemical Institute (IPPI), Tehran, Iran. He received a BSc degree in Petrochemical Engineering from Amirkabir University of Technology, Tehran, Iran in 1988; he received MSc and PhD degrees in Chemical Engineering from University of New South Wales, Sydney/Australia in 1993 and 1997, respectively. His main area of interest includes mediated electrochemical oxidation of polymers and hydrocarbons, ion exchange membrane fabrication and recycling, electromembrane process such as PEM fuel cell, chlor-alkali, and Ionic polymer-metal composite.
Mehdi Nekoomanesh Haghighi is a Full Profes-sor of Chemistry at Polymerization Engineering De-partment, Iran Polymer and Petrochemical Institute (IPPI), Tehran, Iran. He received a BSc degree from Pars College, Tehran, Iran in 1981; MSc degree from UMIST in 1987, and PhD degree from Manchester University in 1991. His main area of interest includes coordination polymerization of olens, polymerization & characterization of styrenic polymers, reactions of polymers and characterization of polymers. His pub-lications are: 89 research articles published in inter-national ISI journals; 48 research articles published in national journals 24 research articles published in international seminars.