Stephen M. Bahnaman. Staffing Virtual Reference: A Comparison of User Questions and Library Web Site Traffic at Duke University Libraries. A Master’s Paper for the M.S. in L.S degree. April, 2007. 41 pages. Advisor: Robert Losee
Synchronous virtual reference (VR) services, usually in the form of online chat interfaces
or instant messaging (IM), are increasingly provided by academic libraries as a way to enhance accessibility and provide better reference services to digital native users. This
study evaluates the accessibility and value of synchronous VR service at Duke
University. Using a complete sample of VR transcripts from a single week, the study compares the number and content of VR inquiries with usage statistics for the library’s
Web site, especially areas of the site that are related to the most common types of VR questions asked. The central goal of the study is to determine the optimal hours for
staffing VR by predicting user needs from Web traffic in areas that seem to generate VR questions. The analysis of question content also offers insight into user behavior,
allowing for an evaluation of what kinds of questions patrons ask.
Headings:
Reference Services/Automation
College and University Libraries
Internet/College and University Libraries
by
Stephen M. Bahnaman
A Master’s paper submitted to the faculty of the School of Information and Library Science of the University of North Carolina at Chapel Hill
in partial fulfillment of the requirements for the degree of Master of Science in
Library Science.
Chapel Hill, North Carolina April 2007
Approved by
Table of Contents
Introduction………2
Literature Review………...3
Methodology………...10
Results and Discussion………..15
Conclusion……….27
Tables and Figures……….31
Introduction
In 1997, Ferguson and Bunge proposed the possibility of librarians and other information professionals providing synchronous, real-time reference service to patrons
through a digital medium (p. 260). Only ten years later, chat reference services have proliferated across multiple kinds of libraries to the extent that some researchers are calling for improved theoretical research on chat reference practices on the grounds that
“[t]his technology is no longer new” or novel (Pomerantz, 2005, p. 1288). Academic libraries have adopted chat reference, also called synchronous virtual reference (VR),
extensively to the point that it has become truly commonplace. A large amount of literature has been generated dealing with academic libraries’ experiences implementing VR and providing VR service.
In an effort to contribute to the growing body of literature that seeks to assess and evaluate VR services, this study treats VR as a library service that, like all library
services, should be as accessible to its users as possible. Access to VR, which typically occurs through library sites on the World Wide Web (WWW), necessarily requires two things: that the chat service can be found by patrons, and that the chat service is staffed
by a librarian or other staff member when the patron attempts to use the service. This study addresses the latter requirement, staffing, and seeks to evaluate whether the hours
Using VR chat transcripts and library server transaction log statistics, the study
attempts to answer the question: During what hours of the week should academic
libraries staff VR services? By examining transcripts collected by VR software as well as server log analyzer software, the study combines two often-separated pieces of data that
many academic libraries collect. Thus, while this particular study only uses data from the library system at Duke University, the study’s method could be applied and amplified in
other academic libraries or across library systems as a basis for comparison and to assess the potential for generalizing these findings.
Literature Review
Synchronous Virtual Reference Services
Synchronous VR, also called chat reference, services have proliferated across public, academic, and special libraries in response to increased demand. Demand for access to reference help online in real time has been strong, as much library use now
tends to happen remotely via the Internet (Lee 2004; Welch 2005). Good reference service can be provided to patrons using asynchronous virtual reference, usually through
email (Pomerantz, Nicholson, Belanger, & Lankes, 2004); but synchronous VR has in many cases taken off as the preferred method of delivery of these services. In 2000, Gray argued that “the future of [synchronous VR] appears to be bright” because the only major
limitation to the service was the existence of user-friendly software (2000, p. 373). Obviously, the widespread adoption of instant messaging software and the development
Carolina State University, for example, chat surpassed e-mail as the preferred method for
patrons to contact librarians remotely (Boyer, 2001, p. 124).
The ability to talk to a librarian remotely, at the exact moment when an unknown arises, is obviously attractive to the patron. It also meets the dominant success factors of
electronic reference, which are “availability of the service to the user at the point of need, and a minimal turnaround time for patrons to get the answers and/or help they need”
(Moyo, 2004, p. 224). Obviously, point of need concerns and turnaround time issues would motivate libraries to provide VR service. This is especially true in an academic environment where the idea of remote users does not only include patrons far from the
library, but to multitasking students doing research or writing papers in their dorm rooms, in some cases under significant time pressure (Ibid., p. 223). Because of concerns related
to the quality of student research and the use of quality sources, the provision of reference services when and where they are working is of paramount importance in an academic library. As Moyo states, “[t]here should be mechanisms in the virtual space that permit
users…to seek help during the course of conducting online research. Virtual reference services are proving to be one major way of bridging this gap” (p. 229).
Synchronous VR service is therefore both widely adopted and perceived as a crucial element of providing quality reference services to academic patrons. But as Pomerantz notes, relatively little research has been done that truly seeks to assess what
are the optimal choices for libraries to make in providing VR service (2005). These choices relate to such factors as the reference transaction and interview itself, the
VR in the published literature has involved the analysis of chat logs or transcripts, Lee’s
2004 study demonstrates a wide variety of qualitative and quantitative data that can be obtained from these documents. Chat transcripts can be analyzed in terms of the speed of transactions, the types of questions users ask, the nature and formality of communication
on both sides, and so forth. The present study represents an attempt to contribute to the evaluation of VR services by investigating when users are most likely to seek VR
services.
Opening Hours, 24/7, and Library Demand
In recent years, academic libraries have increased the hours they remain open, often to 24-hour-a-day levels in an effort to keep up with student needs (Albanese, 2005).
Despite the round-the-clock accessibility of online resources and students’ comfort level with these resources, librarians and patrons have argued for increased opening hours on the grounds that library space is the most useful space on campus for students who have
the need to study or work overnight. The limited amount of survey research that has been conducted related to library hours indicates that patrons, especially students who live on
campus, tend to value extended library hours even if those hours only include extended evenings and not overnight (Curry, 2003; Fox, 2000; Crawford, 2002). When hours have been extended, typically student requests have been the primary motivating factor for
library administrators (Curry, 2003, p. 376). Students have historically voiced demands for library space after hours, leading to controversial incidents at some universities
For this study, the question of accessibility is related less to space than to
reference service, especially VR service to patrons who may not be located in the
physical library. In many cases, libraries which remain open late do so with limited staff, often sacrificing reference service during late hours. Much of this is a staffing concern,
but part of it may have to do with the fact that library users, especially the generation of undergraduates who tend to use the library overnight, are retreating from reference
services in favor of anonymous interactions with digital resources including digital reference (Gray, 2000, p. 372). The lack of overnight reference service has not appeared as a concern of library patrons in the survey literature, but it is reasonable to at least
admit the possibility that if students stay up late enough to demand that libraries remain open, they might also benefit from overnight chat reference service.
A limited amount of research has been conducted into how a business
establishment that provides service to customers, such as a store, should determine the best hours to be open. The first service organizations to open themselves to 24-hour
opening days were call centers that served the needs of catalog customers and late-night infomercial respondents (Otto, 2000, p. 55). Call centers in many ways are not unlike
VR services; they aim to respond to customer needs when and where they arise, even if that is during the middle of the night. Beyond semi-virtual establishments like call centers, brick-and-mortar retail establishments tend to increase sales by extending their
hours. Formally stated, extended hours improve the “internal environment” of a retail establishment because they decrease customers’ opportunity cost of shopping (Kumar &
environment where one store is open later, earlier, or 24 hours and another store
maintains more limited hours. In retail establishments, extended hours are adopted primarily because the demands of certain consumer groups change by time of day, and providing goods at these times of day allows stores to sell to more customers.
Determining the best hours, if 24-hour service is not the right choice, is primarily based upon the establishment’s experience with the number of customers they serve at each
hour and whether or not competitors are open during certain hours (Mudambi, 1996, pp. 696-698). In the case of VR, the relevant commodity is not items sold but rather help given; but the logic of reaching out to the maximum possible number of customers given
the resources of the provider remains important. While academic library reference is not usually presented as a competitive endeavor like retail sales, unmet demand is to some
extent a violation of the library’s mission of accessibility.
VR has developed on the basis of accessibility and the desire to “allow patrons to access the library anyway, anyhow, or anywhere,” particularly through the WWW
(McGlamery and Coffman, 2000, p. 385). VR, especially real-time chat reference, seeks to remove the need for students to be in the physical library to receive high-quality
reference assistance; VR seeks to hit students where they live, so to speak. Because VR is predicated on this outreach model of service delivery, determining what times of the day and week students are inclined to have needs that lead to VR questions is critical to
delivering optimal or near-optimal service. If patrons tend to operate on the library web site during the late night, staffing VR during those hours might be a priority for academic
Much of the literature that specifically addresses the question of providing VR
services at all hours of the day justifies the service by appealing to anecdotal and even hypothetical cases. These include “the person with the full time job, who settles down for a couple of hours study after getting the family meal and the kids to bed,” as well as a
student population that includes a number of people who stay up very late (Jane and McMillan, 2003, p. 242-3). Even with at least a cursory reason to provide reference
services 24 hours a day, literature related to VR has emphasized the need to bolster library web site content and tutorials to provide reference-like service at all hours, presumably in lieu of providing an online librarian at all hours (Boyer, 2001). On the
final evaluation, it may be that “the matter of availability [in terms of hours] is much less important than is our capability to offer virtual reference services in real time to patrons
and other information seekers” (Dougherty, 2002, pp. 45-46). As Dougherty argues, providing reference service of a strong quality via VR systems is more important than simply having a body on the other side of the chat interface or the instant messenger
window. Nevertheless, accessibility can be significantly enhanced by staffing VR when patrons are most likely to need it.
Library Web Site Use
For years, libraries have gathered statistics related to a variety of services
including circulation, reference transactions, and the number of people who walk through the door. As Internet use has increased among college students, libraries’ patrons have
especially in public services, and reference services are now offered online to some
extent by a vast majority of academic libraries (Mudrock, 2002). Libraries have tried to provide services to students who prefer to use the WWW than to come into the library, and have sought to identify themselves as portals to the broader WWW for their students
by including links to search engines on their own pages (Tolppannen, Miller, & Wooden, 2000). It is almost a cliché now to say as McGillis and Toms do that in the current
context, “[the] library web site is the virtual public face—the quasi-equivalent of the front door, signage, pathfinders, collections, services and, to an extent, people” (2001, p. 355). Indeed, one might argue at this point that because of the habits of the current
WWW-using generation of college students, tracking use of the library’s web site is a truly authentic way to measure user behavior, demand, and usage (Welch, 2005).
Despite the large emphasis that libraries and the library literature have placed on web site design and use, tracking users with server log statistics is still perceived as a novel idea in much of the library literature. Even as recently as 2005, authors such as
Coombs are writing basic explanatory articles about how to use server logs, which track a variety of statistics about the use of each page of a library’s web site. Still, the use of
server logs to track usage and perform more detailed analysis of who uses library sites, when users use them, and how users move through sites has been encouraged if not widely adopted since the mid-to-late 1990s (Stavin & Owen, 1997; Hiott, 1999). Even
the earliest studies of web site usage were done in an effort to assess and evaluate service; “statistics that we gathered during this project…will enable us to shift our concentration
While it is unclear to what extent libraries are using server log statistics in
self-studies that never see publication, a number of published self-studies have indicated that server log statistics are still being used in ways that move beyond simple evaluations of the amount of web site traffic. Though in some cases, “analyzing the server logs…has
created as many questions as it has answered” (Coombs, 2005, p. 20), the use of server log analysis to evaluate specific projects, behavior, and pages has been very productive
according to the published literature. Log analysis has been used to evaluate and modify pages intended to receive heavy use (Ghaphery, 2005). In 2002, Mudrock published the results of a study performed at the University of Washington which analyzed both server
statistics and the use of e-mail reference, in order to improve significantly the
University’s Reference Tools page. Data related to the search terms used to bring up
various types of pages has been used to evaluate user behavior as well as the amount of problematic jargon used on library web pages (Wright, 2004). In the growing tradition of using server log statistics to assess and evaluate user behavior related to particular
WWW-based library services, the present study couples VR transcripts with server statistics in an effort to assess when best to staff VR chat services.
Methodology
This study seeks to evaluate the accessibility of VR to online patrons in an
academic library system, specifically by evaluating which hours of the day are most heavily populated by VR activity and other online activity which would lead to VR
this evaluation is, therefore, “When are patrons most likely to have needs that will lead
them to seek VR assistance?” To answer this broad question, three more specific sub-questions were used. First, during what hours do patrons use VR most frequently? Second, for what kinds of questions do patrons most often seek VR assistance? And
third, based on the previous answers, what areas of library site activity predict VR traffic and the need for VR assistance?
To answer these three sub-questions and build toward an answer to the primary question, the author chose to evaluate VR services within the Perkins Library System at Duke University Libraries. Duke is a large university with an extensively branched
library system, and a well-established VR service which is easily accessed by patrons. Within library web pages, Duke patrons are rarely more than one click from the gateway
page to VR services, called “Ask A Librarian.” Duke’s patrons also have two options for pursuing VR assistance, via either dedicated online chat software (Velaro) or instant messaging software (AOL Instant Messenger). During the study and throughout normal
semester hours, chat reference services were available at Duke from 9:00 A.M. to 12:00 midnight Monday through Thursday; 9:00 A.M. to 5:00 P.M. Friday; Saturday from 1:00
P.M. to 5:00 P.M.; and Sunday from 1:00 P.M. to 12:00 midnight. The study attempts to determine the best hours for staffing VR by evaluating Duke patrons’ VR transactions and comparing them with use of the library’s web site in areas which seem to generate
and potentially predict VR traffic.
From February 18 through February 24, 2007, 123 VR transcripts were gathered
from Duke University Libraries. Transcripts included all synchronous VR through Duke’s instant messaging service as well as its customer service chat software.
Identifying information such as screen names, patrons mentioning their name or location,
and IP addresses were masked by a librarian before being presented to the author. Of these 123 transcripts, 19 were deemed unusable because they (a) did not contain any
questions or inquiries; or (b) represented improper use of the service, including
harassment of the librarian. The 104 remaining transcripts represent the first set of raw data for the study.
From each of these 104 transcripts, data were gathered in four categories: (1) the
date and day of the week the transaction began; (2) the time of day the transaction began;
(3) the type of question or unknown the user initially voiced; and (4) the portion of the library web site where the patron’s unknown is likely to have originated. Specific results for each of these variables are discussed below in more detail, but for methodological
purposes question content was coded according to what kind of task the user was
attempting to perform, including researching a topic, retrieving a known item, or citing a
source. This coding of question type has precedent in the type of coding used by Lee in his multifaceted investigation using chat transcripts (2004, p. 100). The web site origin of each question was coded based first on whether the user identified a part of the library
site they were using, for example, if the user mentioned a catalog entry or that he or she was using the databases section. If the user did not mention a specific part of the library
originated; this includes the section on citations for questions about citations, and the
catalog for questions about how to access specific items the library holds.
After coding, results for the date and time variables were analyzed in order to determine when VR is most used generally and for certain specific purposes.
Additionally, data related to the likely origin of the question within the library site were analyzed in order to determine what library web pages might predict VR traffic, use, or
demand.
Library Web Site Traffic
Server log statistics for the web site at Duke University Libraries represent the second set of raw data for the study. Statistics are available to library employees via a
tracking program that collects raw logs and translates them into data that is sortable and filterable by date and time, as well as by specific pages used, which were the two key elements of the study. Based on the statistics related to the pages that apparently generate
the most VR traffic gathered from the VR transcripts, specific areas of the library site were isolated as key areas for predicting VR demand. The traffic in these areas, broken
down by time of day, is presented below as the second set of data. The data related to web traffic is crucial to the study because it identifies activity that leads to VR inquiries during times of day when VR is not staffed and therefore actual VR activity is
nonexistent.
One key area of the web site for statistical inquiry is the directory where VR
services are located, the “Ask A Librarian” directory. Statistics related to the Ask
Name” which contains instructions on how to register for AOL Instant Messenger. This
page generates a significant amount of traffic during all hours. For example, during the week of February 18-February 24, when VR transcripts were collected, 652 of 2018 (32.3%) total hits on the Ask directory were generated by the screen name page. A great
deal of the traffic on the screen name page originates outside Duke University, because this page is ranked very highly in unaffiliated WWW search engines when terms such as
“AIM screen name” are entered. Because of the fact that most traffic on this page originates from outside Duke—and therefore involves non-VR-related patrons—it skews the data, especially during the overnight hours of 12-8 A.M. This page was excluded
from the data related to the Ask directory.
Obviously, the use of server log statistics has limitations. Statistics related to hits,
which are gathered by log analyzers like the one used at Duke, do not actually correctly identify the number of times pages are viewed because of browser caching, the use of proxy servers, and institutional firewalls (Dowling, 2001, p. 34). Nonetheless, even “[i]f
the absolute numbers of views and users on a site are affected by an unknowable fudge factor, we can at least assume that this uncertainty remains relatively stable and compare
measurements over time” (Ibid., p. 35). Because this study primarily investigates visitors by hour of the day and day of the week, the limitations of log analyzers are controlled to some extent by the fact that these uncertainty factors should remain constant at all hours
and on all days of the week. For all server log statistics gathered in this study, in order to get the biggest possible sample, data were collected from January 11-March 28, 2007,
through Wednesday means that each day of the week is represented the same number of
times, thereby ensuring that no overrepresentation occurred for any day of the week.
Results and Discussion
Chat Transcripts: Day and Time
During the week studied, which included Sunday through Saturday early in the
semester with school in session, VR traffic was relatively consistent throughout the week. As Table 1 indicates, Monday through Thursday each had between 17 and 23
transactions, representing from 16.4 percent to 22.1 percent of the total transactions for
the week, with Wednesday as the mode but only by a very small margin. Sunday, when VR is only staffed after 1:00 P.M., generated a surprisingly high amount of traffic, with
15 transactions representing 14.4 percent of the total. Friday, with VR staffed only from 9:00 A.M. to 5:00 P.M., only had three transactions, or 2.9 percent of the total. Perhaps most surprising is the fact that Friday was surpassed even by Saturday, with six
transactions or 5.8 percent in its small four-hour window from 1:00 P.M. to 5:00 P.M. This preliminary data gathered from the chat transcripts seems to indicate that Sunday
through Thursday might be priority days for staffing VR, with Friday and Saturday representing lower-priority days of the week. Saturday, though, represents 4.9 percent of the hours VR is staffed while also representing 5.8 percent of the transactions, indicating
that the hours VR is staffed on Saturday are not slow hours relative to the rest of the week.
The data by day of the week is less helpful than some of the other data in
days when traffic is highest, namely Monday through Thursday. It should be noted,
however, that the days when VR is not staffed after 5:00 P.M., Friday and Saturday, are also the days with the lowest amount of VR traffic. This low traffic might be accounted for by the fact that Friday and Saturday simply offer VR for fewer hours than the other
days, or the fact that they are traditionally regarded as the days when students are least involved in doing library research and schoolwork. However, the relatively low Friday
and Saturday traffic at least suggest the possibility that VR might be in higher demand after 5:00 P.M., when it is not staffed on these days.
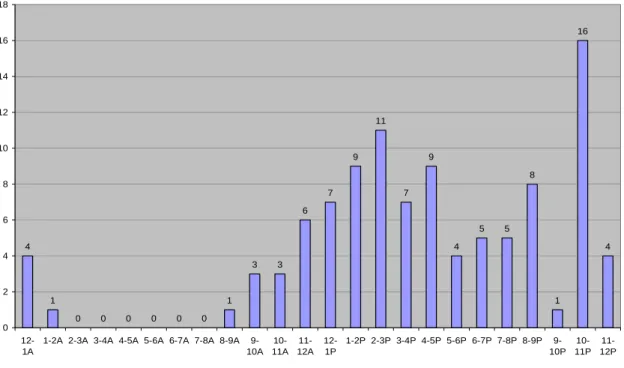
The data related to the hour of the day when VR transactions took place is
significantly more complex than the data related to the day of the week. As Figure 2 indicates, VR transactions overall increase steadily from opening at 9:00 A.M. through
3:00 P.M., decrease slightly through 5:00 P.M., lull during the dinner time hours between 5:00 and 8:00 P.M., and then generally pick up again between 8:00 and 9:00 P.M. and then between 10:00 and 11:00 P.M. The significant drop between 9:00 and 10:00 P.M.,
when only one transaction occurred during the entire week, is very difficult to explain, and may be an anomaly attributable to the small sample size of the survey. What is
obvious from the data here is that 10:00 to 11:00 P.M. is the hour of the most significant activity, representing 15.38 percent of the total transactions for the week. Of particular note are the transactions that occurred after VR was officially closed, especially the five
transactions that occurred between 12:00 and 2:00 A.M., when the night librarians evidently answered chat requests or IM requests anyway. That transactions between
being closed, may indicate pent-up demand for late-night VR help. Further data about
traffic in the Ask A Librarian directory will help us to discover whether late-night demand is being unmet, that is, whether patrons are visiting the chat options and finding no live VR help available.
Overall, the data from the chat transcripts suggest that VR service at Duke tends to be most heavily used Sunday through Thursday, and during the hours between 11:00
A.M. and 5:00 P.M. and after 8:00 P.M. The most crucial hours for staffing VR, at least during the hours when it is currently staffed, appear to be Sunday through Thursday, 11:00 A.M. through 3:00 P.M. and 8:00 P.M. through 12:00 midnight. Staffing VR
during only these hours would cover only 48 of 82, or 58.6 percent, of the hours VR is covered during the week. VR librarians during these hours would have covered 71 of the
104 transactions that occurred during the week studied, or 68.2 percent, which means that by covering under three-fifths of the hours librarians would have covered over two-thirds of the questions asked during the week. Of course, this only leaves the 5:00-8:00 P.M.
dinner hours and the 9:00-11:00 morning hours off, and all day on Friday and Saturday, and sacrifices almost one-third of the patrons. At the very least, one could argue from
this data that staffing VR from 9:00-11:00 A.M. on weekdays is probably less crucial than the other times as these morning hours, which represent 12.2 percent of the total hours worked, only represent 5.8 percent of the total VR inquiries received. Overall,
though, the cost of losing those six patrons on a weekly basis may outweigh the cost of having a staff member present at their computer during these regular business hours,
sessions after 12:00 midnight, that extending VR hours might increase the library’s
accessibility to its patrons.
Chat Transcripts: Questions and Origins
The types of questions asked via VR during the week varied a great deal, but had enough commonality among them that grouping them by question type was possible. As
Table 2 indicates, a heavy plurality of the questions, 44.2 percent, involved the patron seeking to retrieve a known item about which they already had much information. This included a number of questions about finding books in the stacks, as well as questions
like “do you have this specific article by a specific author?” The next most common question type, representing 14.4 percent of the total, involved the traditional reference
interaction of researching a topic, either finding resources about a specific topic or getting started using library resources to figure out what to do research about.
Administrative questions, which include unknowns such as where to pick up reserve
materials, hours of opening, and how to pay fines, made up 13.5 percent of the
transactions. Finding unknown items, that is, questions such as “I need to find a book
about this topic” that did not necessarily imply doing research, made up 11.5 percent of the total. A full 10.6 percent of the questions were specifically related citing sources, including primarily how to format citations for papers. Ready reference questions where
the patron expected a specific fact as the answer made up only 2.9 percent of the total, while questions about how to use software provided by the library made up 1.9 percent.
Obviously, the major finding related to the types of questions asked is the
preponderance of questions involving finding known items. After trying to find items on the shelf or not understanding catalog entries, or having trouble with an online database, patrons seek VR help in order to find the item. Over two thirds of these inquiries can be
traced back to the catalog, either because a patron is having trouble understanding the catalog or had to use the catalog to find the shelf where the item does not appear to be
located. The relatively high frequency of questions related to citing sources, which make up over one-tenth of the questions, may indicate a lack of familiarity of the patron with Duke’s helpful Citing Sources page, which is linked from the main home page. It may
also indicate the need for a human touch in providing citation help, beyond what can be provided by this online pathfinder. In any case, use of the Citing Sources page may be a
strong predictor of VR traffic simply because of the relatively high number of questions asked about this specific topic. Topical research, finding unknown items, and
administrative questions each make up a similar fraction of the total. However, these
types of questions originate from a variety of sources including simply the student’s own class work, and may indicate relatively less about the use of VR services. In many cases,
questions involving finding unknown items likely originated in the Databases section of the library site, which may be another chief indicator. The general lack of ready
reference questions is particularly telling; students do not appear to use Duke’s VR
service as a question-answering service as much as a help desk for finding library materials. Overall, the data related to question type is certainly less helpful in trying to
The web site origins of the VR transcripts clustered together in a way fairly
similar to the question types. Data related to the origins of these transactions is collected in Table 3. In many cases, the patron identified either a section of the library web site or a database that they were using at the time of their VR transaction. In other cases, the
origin was either obvious or logically concluded from the nature of the patron’s request. In 104 transactions, ten categories were identified as the WWW origin of the request.
Two categories, none and outside library, are much less helpful for this analysis because they are not tracked by or within the scope of the university libraries. Transactions for which “none” was identified as the origin include a large number of topic research
questions where the patron appeared to be visiting VR early in the research process or to complete a specific assignment, as well as a directional question, questions about
particular library software, and ready reference questions. In each of these cases, determining where patrons came from to use VR would be quite difficult and not
particularly useful for macro-level analysis of server log statistics. Transactions with no
discernible WWW origin made up 17.3 percent of the total. A further 6.7 percent of the transactions were determined to originate from relatively specific web pages outside the
library, including other Duke web pages and sites that contain references to articles or books that patrons then asked about via VR.
Of the questions for which a WWW origin could be determined, the majority of
the transactions overall originated from the library catalog and the library databases. Catalog-related inquiries made up 31.7 percent of all transactions, while database-related
citations. The My Account area of the library web site, which is where students can
check and pay fines and try to renew items, made up only 4.8 percent of the transactions, and all of these were administrative. The Interlibrary Loan (ILL) section of the library web site accounted for 3.9 percent of the transactions, half administrative and half based
on trying to retrieve known items. Finally, small percentages could be traced back to the rare books section of the library web site, the pages providing information about
circulation policy, and the pages related to class reserves.
Data related to the origin of these VR transactions is especially helpful in determining what areas of library web site traffic might best be examined in order to
determine at what hours patrons are engaging in activity that leads them to seek VR help. Based on the transactions studied during this one-week period, the library catalog and the
pages related to databases could be strong indicators of potential VR need. If use of the catalog and databases sections of the library web site is especially heavy outside of the hours that VR is currently staffed, it might be reasonable to conclude that VR hours
should be extended. Beyond the catalog and databases, the Citing Sources pages are a strong indicator of specific needs related to citations. Citation questions make up 10.6
percent of VR transactions, despite presumably making up a relatively small subset of the information-seeking behavior of students. If citation questions are to some extent
overrepresented, then looking at the library’s web pages that instruct students in how to
Server Log Statistics: Ask A Librarian
Before turning to the more speculative enterprise of using the server log statistics from the catalog, the databases, and the Citing Sources pages, it is first necessary to examine the traffic on VR’s home directory, Ask a Librarian (Ask). As indicated above,
traffic on this directory excluded traffic on the site related to AOL Screen Names which primarily originates from off campus and skews the data. Traffic on this directory is
probably the best predictor of VR demand, since it is the gateway to the library’s various VR services. As indicated by Table 4, Ask is used most during the early part of the week and follows a relatively similar pattern to the number of actual VR transactions from
Saturday through Thursday. However, Friday traffic, representing 13.3 percent of all traffic, is relatively high compared to the number of VR transactions that occurred on the
Friday studied. Saturday and Sunday seem to generate the smallest amount of traffic on the Ask directory, indicating that patrons may be less interested in pursuing synchronous VR, asynchronous VR, or telephone reference on those days. Clearly, the days Monday
through Thursday are the key days for staffing VR, but each day accounts for at least a fair percentage of the traffic on Ask.
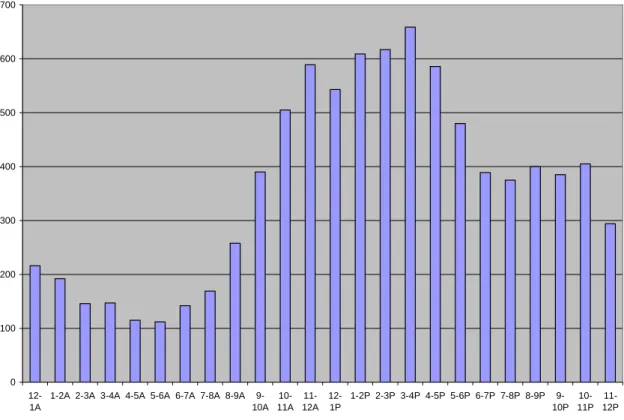
In terms of hours of the day, Figure 2 indicates that traffic is predictably highest during the daytime hours, generally growing from 10:00 A.M. through 4:00 P.M. and then taking a downturn through the evening hours. Traffic on the Ask directory shows a
smaller trend toward the dinnertime downturn followed by the evening upswing that actual VR transactions showed. This variance is difficult to account for precisely. Of
between 12:00 A.M. and 2:00 A.M. are only somewhat less heavy than 8:00 A.M.
through 9:00 A.M., and all of these are nearly as busy as the 11:00-12:00 P.M. hour, indicating that opening earlier in the morning at 8:00 and later at night until 2:00 might be potential growth areas for VR services. Though traffic during these hours is by no
means huge, staffing VR between 12:00 and 2:00 A.M. might be an option if reference services are difficult to find at the desk; of course, even during the 12:00-1:00 A.M. hour
only about three visitors per day access the Ask directory, which is not a huge number.
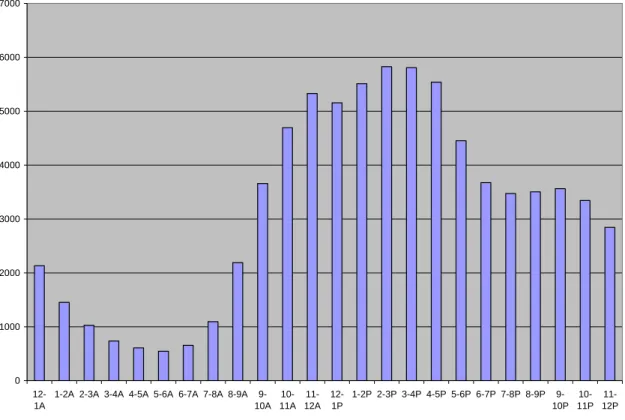
Server Log Statistics: Catalog
As stated previously, the library catalog seems to be the origin point for about one third of the questions that users ask via VR. Examining catalog use might be a good way
to predict user need for VR help. As Table 5 indicates, catalog use exhibits basically a similar pattern to Ask use, with a substantial lull during the weekend and with most traffic occurring Monday through Thursday. Weekend days would therefore seem more
expendable in terms of staffing VR, as users access the catalog less often and therefore will likely have fewer needs related to finding materials or deciphering difficult catalog
entries.
Figure 3 shows that catalog visitor traffic follows nearly the same pattern as Ask traffic, increasing through the morning before dropping off somewhat in the evening,
holding on a bit through the early morning hours—especially 12:00 to 1:00 A.M.—and then dying down significantly during the late night hours after 1:00 A.M. The catalog
a heavier-use time than many of the other hours that VR is not currently staffed, and that
the late-night hours truly are the lowest-use hours of the day by a large margin.
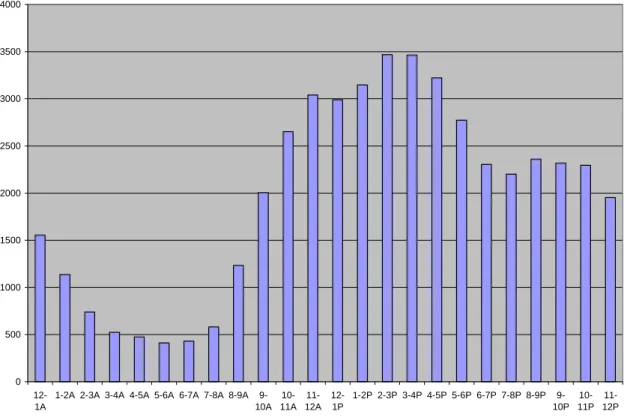
Server Log Statistics: Databases
Roughly one fifth of all VR transactions appeared to originate in the library’s various online databases, all of which must be accessed through the same major
directory. Use of databases also might be expected to indicate generally that patrons are engaging in research by accessing articles online. Notably, the statistics related to the databases, as seen in Table 6 and Figure 4, follow trends that are almost identical to the
trends in the library catalog. Differences include a slightly higher proportion of visitors on Sunday and a slightly lower proportion on Friday, which might be explained by the
fact that Sunday is a traditional “homework night” while Friday is not; it is possible that database use follows a homework night pattern more closely than a catalog pattern, and certainly possible that this is true for VR transactions. Additionally, database traffic
appears to drop off less than catalog traffic between the 11:00-12:00 P.M. hour and the 12:00-1:00 A.M. hour, indicating that traffic may linger on the databases a little more
after midnight than catalog traffic does. Still, very similar trends are visible to the ones indicated by the catalog statistics and the Ask statistics.
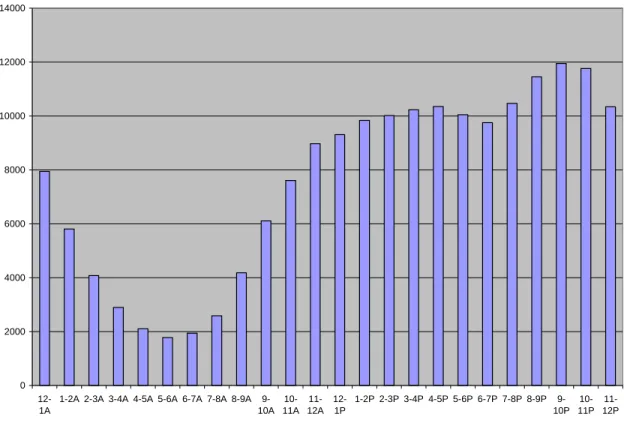
Server Log Statistics: Citing Sources
Over one tenth of VR transactions are related to the specific act of citing sources.
reason for this is that a much higher proportion of Citing Sources traffic originates from
off campus, as people looking for instructions on citations often access Duke’s pages through online search engines. Indeed, entering the words [citing sources] into Google’s search engine yields a Duke page in this directory as the first hit. What this means for the
purposes of this study is that Citing Sources traffic is probably a less useful indicator of VR potential than the other directories. It is not possible to recalibrate the data on this
directory in a way similar to what was done for the Ask directory’s Screen Name page, because no individual pages in this directory seem to have a heavy bias toward off- or on-campus traffic.
Traffic patterns on the Citing Sources directory, in Table 7, follow a much tighter “homework night” pattern than any of the other directories, as indicated by the very low
percentage made up by Saturday traffic and the fact that Sunday traffic is greater even than Friday. Since help citing sources would usually only be needed when assignments are being completed, this is unsurprising. Indeed, VR questions related to citing sources
only were asked on homework nights during the week studied, over half of them after 8:00 P.M. Analysis similar to this is helpful because it indicates to an extent what kinds
of questions to expect on different days and at different times; specifically, that citation questions are more likely to occur at night and on traditional homework days.
Patterns by hour on the Citing Sources directory, shown in Figure 5, show a
significant upswing throughout the day and then increase to their highest levels after 7:00 P.M. Though this may not indicate Duke-only activity, the heavy evening use pattern is
actually indicates more traffic between 12:00 A.M. and 1:00 A.M. than it does any other
hour before 11:00 A.M., indicating heavy after-midnight use. If we assume that questions related to citation formatting and the like are somewhat urgent questions, related to the completion of assignments, this may be a somewhat strong indicator that
the 12:00 to 1:00 A.M. hour could be a useful time to offer VR services to a homework-completing patron. However, because of the difficulty of determining how much of the
Citing Sources traffic represents Duke traffic, these particular findings are mitigated somewhat.
Summary and Recommendations
If urgency plays a role in VR need, as might be indicated by the increased number
of VR questions during lower-traffic evening hours, then certainly staffing VR later in the night might be a good option. Of particular note are the four VR transactions that did take place during the 12:00-1:00 hour despite the service being closed, indicating some
substantial demand after midnight even during an early part of the semester. In general, choosing to staff VR after midnight should be done with the knowledge that activity
diminishes significantly between the 12:00-1:00 hour and the 1:00-2:00 hour and then dies down even more after 2:00. While Duke like all universities must make decisions about VR based on the availability of staff, it nonetheless appears that having VR
available at least from midnight to 1:00 A.M. on the days it is currently staffed until midnight might help a reasonably high number of patrons.
Of the hours that VR is currently staffed, it appears to be the case that the
on the Ask directory, probably the best indicator of VR demand, is higher during these
hours than during the evening hours after 6:00 P.M., but the number of questions asked during the evening hours is higher, perhaps because of increased off-campus usage after school hours or because of the relative urgency with which help is needed later in the
day. Lack of urgency related to assignments may also explain the extremely low VR demand on Fridays despite the fact that Friday is the fifth-most popular day for traffic on
Ask and all of the other directories used here, except for Citing Sources.
Conclusion
The use of VR transcripts and server log statistics to determine the best hours for staffing VR services in academic libraries seems potentially very productive. By
analyzing server traffic on the areas of the university’s Web site that seem to yield the most VR inquiries, university libraries can learn several things. The analysis of chat transcripts by type of question asked and where these questions originate can potentially
tell us what kinds of questions new VR staffers should be trained in, as well as what any VR librarian should expect. By examining when VR traffic currently occurs, libraries
can determine what hours might require additional staff if their VR system is very heavily used. Further, analysis of days and times of current chat transactions can indicate what hours could be forsaken to free up staff to engage in other useful work. Of course, as the
literature indicates, libraries rarely cut back on opening hours of any services at the present juncture, but if hours exist in VR coverage that are truly not busy and not likely to
The use of server log statistics is only now fully becoming adopted in library
research. A particularly useful way to analyze server logs is to look at traffic patterns such as hours of the day and days of the week to indicate the trends in usage. As seen in this study, in many cases trends such as an increase throughout the working day might be
visible across directories, across libraries, and across institutions. Such trends could theoretically provide valuable insight into user behavior and library use patterns. More
significantly for the purposes of studying VR, this study can represent a model for determining how VR traffic relates to traffic on specific areas of the web site. In this case, VR traffic picked up in the evening in a way similar to that of the Citing Sources
directory, indicating that urgent user needs may generate more VR questions even when activity on the Ask a Librarian directory and the rest of the library web site may be low.
Limitations
The study of VR transcripts requires a significant amount of data to observe real
trends. In the case of this study, 104 transactions were gathered, which is by no means a very small number; still, more transactions would yield a much more vivid picture of user
VR behavior and solidify the observed trends related to time of day and question origin. Additionally, there is no standard schematic for classifying virtual or in-person reference questions into definite categories; this is obviously partially due to the nebulous nature of
unknowns and the multifaceted nature of many questions. Still, the development of a more standardized schematic for the variable of “type of question” studied in many
The study of server log statistics is flawed in many ways, as Dowling indicates
(2001). In the case of this study, the openness of the Duke web site to outside users who are not the target population for VR services has obviously skewed the data in the study in many ways, as evidenced by the need to eliminate a page from the Ask A Librarian
analysis and the potential uncertainty related to the Citing Sources data. Furthermore, data related to number of visitors, hits, or page views is flawed because of browser
caching, the fallible nature of server logging software, and the general difficulty of sifting through so much data. In this particular study, little could be done to examine specific hours of specific days because the software would not allow filtering at that level.
Obviously, improvements are needed in the output given by such software and the reliability of the data the software provides. Still, with enough data, trends can be
examined, and looking at semester-long trends related to days and hours in entire directories is much more reliable than attempting to analyze traffic within very specific time frames.
Directions for Further Research
Studies like this one can obviously be used to assess when to open VR services in academic and other libraries, if these libraries keep web server statistics in a useful format for a librarian to access. Beyond this particular study, though, the potential
relationships between server log data and chat transcript data are extensive. Attempting to determine the web site origin of VR questions can lead to improved services on those
especially in the case of resources like online catalogs which are often difficult to
understand for some patrons. Looking at hours and origins of questions could indicate a great deal about user behavior at specific times of day; users may need VR help more often with citations at night and the catalog in the morning, or may need database help
more often on Sunday. Additionally, close analysis of server logs could track user behavior through library sites before and after they seek VR help, potentially indicating a
great deal about the way in which users navigate library pages and indicating what pages could feature VR-related links more prominently.
Overall, the sky appears to be the limit for server log statistics as long as these statistics are kept reliable and accessible. This study demonstrates one way in which
server logs can be used to evaluate a particular aspect of a particular library service. VR services could stay open 24 hours at any library, and certainly this would be useful to some patrons; the library web site is used at all hours of the night. But in the case of
Duke at least, the hours after 2:00 A.M. are especially light in terms of traffic in all the areas that might indicate heavy VR use. While there is no substitute for complete
Tables and Figures
Table 1: VR Transactions by Day of Week, February 18-February 24, 2007.
Day Number Percent
Sunday 15 14.4
Monday 19 18.3
Tuesday 21 20.2
Wednesday 23 22.1
Thursday 17 16.4
Friday 3 2.9
Saturday 6 5.8
TOTAL 104 100.0
Figure 1: VR Transactions by Hour of Day, February 18-February 24, 2007.
Chats by Hour
4
1
0 0 0 0 0 0
1 3 3 6 7 9 11 7 9 4 5 5 8 1 16 4 0 2 4 6 8 10 12 14 16 18 12-1A
1-2A 2-3A 3-4A 4-5A 5-6A 6-7A 7-8A 8-9A 9-10A 10-11A 11-12A 12-1P
1-2P 2-3P 3-4P 4-5P 5-6P 6-7P 7-8P 8-9P 9-10P
10-11P
Table 2: Types of Questions Asked Via VR, February 18-February 24, 2007.
Question Number Percent
Retrieve Known Item 46 44.2
Research a Topic 15 14.4
Administrative 14 13.5
Find Unknown Item 12 11.5
Cite Source 11 10.6
Ready Reference 3 2.9
Use Library Software 2 1.9
Directional 1 1.0
TOTAL 104 100.0
Table 3: Website Origin of Questions Asked Via VR, February 18-February 24, 2007.
Origin Number Percent
Catalog 33 31.7
Databases 21 20.2
NONE 18 17.3
Citing Sources 11 10.6
Outside Library 7 6.7
My Account 5 4.8
Interlibrary Loan 4 3.9
Rare Books 2 1.9
Circulation 2 1.9
Reserves 1 1.0
Table 4: Visitors to Ask A Librarian Directory by Day of Week, January 11-March 28, 2007.
Day Number Percent
Sunday 808 10.8
Monday 1292 17.2
Tuesday 1341 17.9
Wednesday 1164 15.5
Thursday 1210 16.1
Friday 999 13.3
Saturday 684 9.1
TOTAL 7498 100
Figure 2: Visitors to Ask A Librarian Directory by Hour of Day, January 11-March 28, 2007. 0 100 200 300 400 500 600 700 12-1A
1-2A 2-3A 3-4A 4-5A 5-6A 6-7A 7-8A 8-9A 9-10A 10-11A 11-12A 12-1P
1-2P 2-3P 3-4P 4-5P 5-6P 6-7P 7-8P 8-9P 9-10P
10-11P
Table 5: Visitors to Catalog by Day of Week, January 11-March 28, 2007.
Day Number Percent
Sunday 6953 11.4
Monday 10596 17.4
Tuesday 10211 16.8
Wednesday 9175 15.1
Thursday 9618 15.8
Friday 8388 13.8
Saturday 5970 9.8
TOTAL 60911 100
Figure 3: Visitors to Catalog by Hour of Day, January 11-March 28, 2007.
0 1000 2000 3000 4000 5000 6000 7000
12-1A
1-2A 2-3A 3-4A 4-5A 5-6A 6-7A 7-8A 8-9A 9-10A
10-11A
11-12A
12-1P
1-2P 2-3P 3-4P 4-5P 5-6P 6-7P 7-8P 8-9P 9-10P
10-11P
Table 6: Visitors to Databases by Day of Week, January 11-March 28, 2007.
Day Number Percent
Sunday 4568 12.1
Monday 6905 18.3
Tuesday 6705 17.8
Wednesday 5878 15.6
Thursday 5743 15.2
Friday 4646 12.3
Saturday 3289 8.7
TOTAL 37734 100
Figure 4: Visitors to Databases by Hour of Day, January 11-March 28, 2007.
0 500 1000 1500 2000 2500 3000 3500 4000 12-1A
1-2A 2-3A 3-4A 4-5A 5-6A 6-7A 7-8A 8-9A 9-10A 10-11A 11-12A 12-1P
1-2P 2-3P 3-4P 4-5P 5-6P 6-7P 7-8P 8-9P 9-10P
10-11P
Table 7: Visitors to Citing Sources by Day of Week, January 11-March 28, 2007.
Day Number Percent
Sunday 21330 13.2
Monday 30801 19.1
Tuesday 31084 19.3
Wednesday 26832 16.6
Thursday 26071 16.2
Friday 15537 9.6
Saturday 9528 5.9
TOTAL 161183 100
Figure 5: Visitors to Citing Sources by Hour of Day, January 11-March 28, 2007.
0 2000 4000 6000 8000 10000 12000 14000
12-1A
1-2A 2-3A 3-4A 4-5A 5-6A 6-7A 7-8A 8-9A 9-10A
10-11A
11-12A
12-1P
1-2P 2-3P 3-4P 4-5P 5-6P 6-7P 7-8P 8-9P 9-10P
10-11P
References
Albanese, A.R. (2005). The best thing a library can be is open. Library Journal, 130 (15), 42-44.
Boyer, J. (2001). Virtual reference at North Carolina State: The first one hundred days. Information Technology and Libraries, 20 (3), 122-128.
Coombs, K. A. (2005). Using Web server logs to track users through the electronic forest. Computers in Libraries, 25 (1), 16-20.
Crawford, J. (2002). A study of issues in administering library services to nursing studies students at Glasgow Caledonian University. Health Information and Libraries Journal, 19 (June), 90-97.
Curry, A. (2003). Opening hours: The contest between diminishing resources and a 24/7 world. Journal of Academic Librarianship, 29, 375-385.
Dougherty, R. (2002). Reference around the clock: Is it in your future? American Libraries 33 (5), 45-46.
Dowling, T. (2001). Lies, damned lies, and Web logs. Library Journal Net connect, Spring, 34-35.
Ferguson, C. D. & Bunge, C. A. (1997). The shape of services to come: Values-based reference service for the largely-digital library. College and Research Libraries, 28, 252-265.
Fox, A. (2000). The after-five syndrome: Library hours and services for adult learners. Reference Librarian, 69/70, 119-126.
Gaughan, T. G. (1993). Concerned students occupy (sort of) UC/SB library.
American Libraries, 24, 370-371.
Ghaphery, J. (2005). Too quick? Log analysis of Quick Links from an academic library website. OCLC Systems & Services, 21 (3), 148-155.
Gray, S. M. (2000). Virtual reference services: directions and agendas. Reference & User Services Quarterly, 39, 365-375.
Jane, C. & McMillan, D. (2003). Online in real-time? Deciding whether to offer a real-time virtual reference service. The Electronic Library, 21, 240-246.
Lee, I. J. (2004). Do virtual reference librarians dream of digital reference questions?: A qualitative and quantitative analysis of email and chat reference.
Australasian Academic and Research Libraries, 35 (2), 95-110.
Kniffel, L. K. (1993). Carnegie Mellon student protest gets library hours restored.
American Libraries, 24, 903-904.
Kumar, V. & Karande, K. (2000). The effect of retail store environment on retailer performance. Journal of Business Research, 49, 167-181.
McGillis, L. & Toms, E. G. Usability of the academic library Web site: implications for design. College & Research Libraries, 62, 355-367.
McGlamery, S. & Coffman, S. (2000). Moving reference to the Web. Reference & User Services Quarterly, 39, 380-386.
Moyo, L. (2004). Electronic libraries and the emergence of new service paradigms. The Electronic Library, 22, 220-230.
Mudambi, S. M. (1996). Games retailers play. Journal of Marketing Management, 12, 695-706.
Mudrock, T. (2002). Revising ready reference sites: Listening to users through server statistics and query logs. Reference & User Services Quarterly, 42, 155-163.
Otto, L. (2000). Cashing in on 24-7 operations. Journal of Property Management, 65 (3), 55-58.
Pomerantz, J., Nicholson, S., Belanger, Y., & Lankes, R. D. (2004). The current state of digital reference: validation of a general digital reference model through a survey of digital reference services. Information Processing and Management, 40, 347-363.
Pomerantz, J. (2005). A conceptual framework and open research questions for chat-based reference service. Journal of the American Society for Information Science and Technology, 56, 1288-1302.
Stavin, T. & Owen, I. (1997). Gathering usage statistics at an environmental health library web site. Computers in Libraries, 17 (3), 37.
Tolppannen, B. P., Miller, J., & Wooden, M. H. (2000). An examination of library World Wide Web sites at medium-sized universities. Internet Reference Services
Welch, J. M. (2005). Who says we’re not busy? Library web page usage as a measure of public service activity. Reference Services Review, 33, 371-379.