This project was made possible by funding from the Water
Resources Research Institute of the University of North Carolina. My appreciation is extended to the Institute, and to the Department of Environmental Sciences and Engineering of the School of Public Health, for facilitating the research experience, and for fostering an educational environment that is focused on improving global humanitary conditions.
My deepest personal gratitude goes out to Dr. Philip Singer
who made possible this opportunity for my educational
development. His practical knowledge of current water treatment issues guided this project in an applicable direction for use by local drinking water utilities. Dr. Singer was a constant source of inspiration, guidance, and scientific discernment. The research experience he has provided will continue to be invaluable to my career as a professional engineer.
I am greatly indebted to Dr. Louise Ball and Dr. Francis DiGiano for their time and advice throughout the course of this study. Their comments and suggestions provided insight into the testing procedures and the interpretation of results.
Dr. Ball's efforts in establishing the protocol for the Ames
bioassay procedures are highly appreciated.
The three readers of this report. Dr. Singer, Dr. Ball, and Dr. Michael Aitken, have spent numerous hours in order to improve the accuracy and readability of this text. I am thankful for their time and excellent suggestions. Above all, the readers have been extremely tolerant of a fluctuating and greatly extended schedule, and I cannot express enough gratitude for their patience.
Appreciation is warmly extended to a woman I greatly admire for her myriad accomplishments and personal integrity, Ms. Hope Taylor. Hope set up and conducted all of the Ames bioassay tests for this project, under the direction of Dr.
Ball. The mutagenicity work was tedious and meticulous,
requiring long hours for few results. I am grateful for Hope's
contribution to the study, and for her constant words of encouragement.
To all of the young scientists who shared space in the Rosenau basement, and to C.L. Lassiter for his administrative detangling, a hearty thanks is put forward for easing inherent
List of Tables... v
List of Figures... vi
1. 0 Introduction... 1
2.0 Background and Theoretical Considerations... 4
2 .1 Jordan Lake Watershed... 4
2.1.1 Hydrology... 4
2.1.2 Water Quality... 7
2.1.2.a Point-Source Pollution... 7
2.1.2.b Nonpoint-Source Pollution... 8
2.1.2.C Stream and Lake Measurements... 11
2.1.3 Comparison to Falls Lake Watershed... 12
2 .2 Chlorination of Drinking Water... 14
2.2.1 Free Chlorine Chemistry... 15
2.2.2 Reactions with Ammonia... 16
2.2.3 Reactions with Bromide... 19
2.2.4 Reactions with Natural Organic Material. 20 2.2.5 Chloro-Organic Byproducts and Relationships... 21
2.2.6 Models... 25
2.3 Removal of Natural Organic Material by Coagulation... 27
2.4 Removal of Natural Organic Material by Granular Activated Carbon... 31
2.5 Ozone and Monochloramine as Alternative Oxidant/Disinfectants to Chlorine... 34
2.5.2 Ozone... 34
2.5.2 Inorganic Chloramines... 38
2 . 6 Mutagenicity of Drinking Water... 3 9 2.6.1 Ames Bioassay... 39
2.6.2 Mutagenicity of Chlorinated Drinking Water... 41
2.6.3 Mutagenicity from Alternative Treatment Processes... 43
3 . 0 Experimental Methods... 48
3.1 Site Selection and Sampling Procedures... 48
3 .2 General Treatment Scheme... 52
3 . 3 Preparation of Glassware... 54
3.4 Coagulation... 55
3 .5 Chlorination... 56
3 . 6 GAC Treatment... 57
3 . 7 Ozonation... 58
3 . 8 TOC Analysis... 60
3 . 9 TOX Analysis... 60
3.10 THM Analysis... 62
3 .11 Ames Bioassay Sample Preparation... 64
4 .1 Raw Water Characteristics... 67
4.2 Coagulation, Settling, Filtration... 69
4 . 3 Chlorination Results... 74
4.3.1 General Results - All Samples... 74
4.3.2 Results by Source... 82
4.4 GAC Adsorption and Chlorination... 89
4.5 Ozone and Chloramine Disinfection... 93
4 . 6 Ames Bioassay Results...99
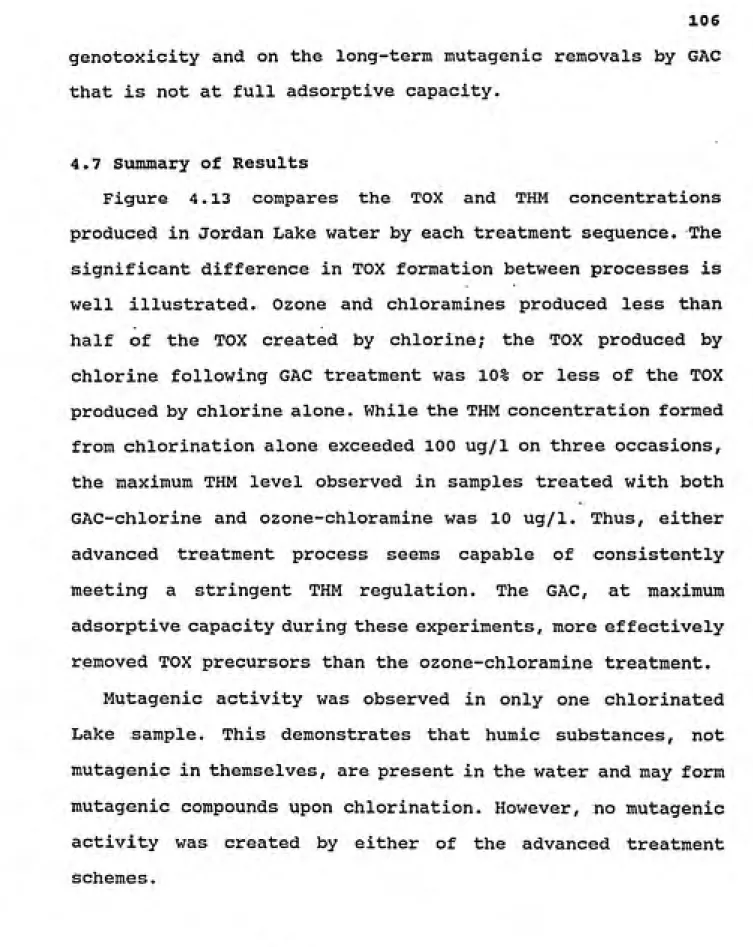
4 . 7 Summary of Results...106
5.0 Conclusions and Recommendations ...108
5.1 Conclusions...108
5.2 Recommendations for Further Research...112
References...114
Appendices...123
A: Batch Reactor Design and Velocity Gradients...123
B: GAC Column Design...12 6
C: Gas Chromatography of Trihalomethane Analysis...128
D: Ames Bioassay Results...129
Table Number
4 .1 Raw Water Characteristics... 68 4.2 Results of Coagulation, Settling and Filtration... 70
4 . 3 Chlorinated Sample Characteristics... 75
4.4 Chlorine and Byproduct Relationships; Comparison
to Other Research... 80 4.5 - GAC/Chlorinated Sample Characteristics... 91 4.6 Ozone/Chloraminated Sample Characteristics... 94
4.7 Chloramine and Byproduct Relationships; Comparison
to Other Research... 96 4.8 Ames Bioassay Results for Samples of Significant
Mutagenic Activity: Jordan and Falls Lakes....100 4.9 Ames Bioassay Results for Samples of Significant
Mutagenic Activity: Jordan Lake Tributaries
Figure Number
2 .1 Jordan Lake Watershed... 5
2 . 2 Segments of Jordan Lake... 6
2.3 1985 NPDES Dischargers in Jordan Lake Watershed... 9
2.4 1985 NPDES Dischargers in Falls Lake Watershed.... 13
2.5 Theoretical and Real Breakpoint Chlorination... 17
3 .1 Jordan Lake and Sampling Locations... 49
3 . 2 Falls Lake and Sampling Location... 50
3 . 3 General Treatment Scheme... 53
4.1 TOC Removal by Coagulation and Filtration: Jordan and Falls Lake Samples... 71
4.2 TOC Removal by Coagulation and Filtration: Tributary Samples and Treatment Plant Finished Water... 72
4.3 Correlation Between TOC Concentration in Filtered Water and Chlorine Consumed... 76
4.4 Correlation Between Chlorine Consumed and TOX Production... 77
4.5 Correlation Between Chlorine Consumed and THM Production... 77
4.6 Correlation Between TOC Concentration in Filtered Water and TOX Production... 79
4.7 Correlation Between TOC Concentration in Filtered Water and THM Production... 79
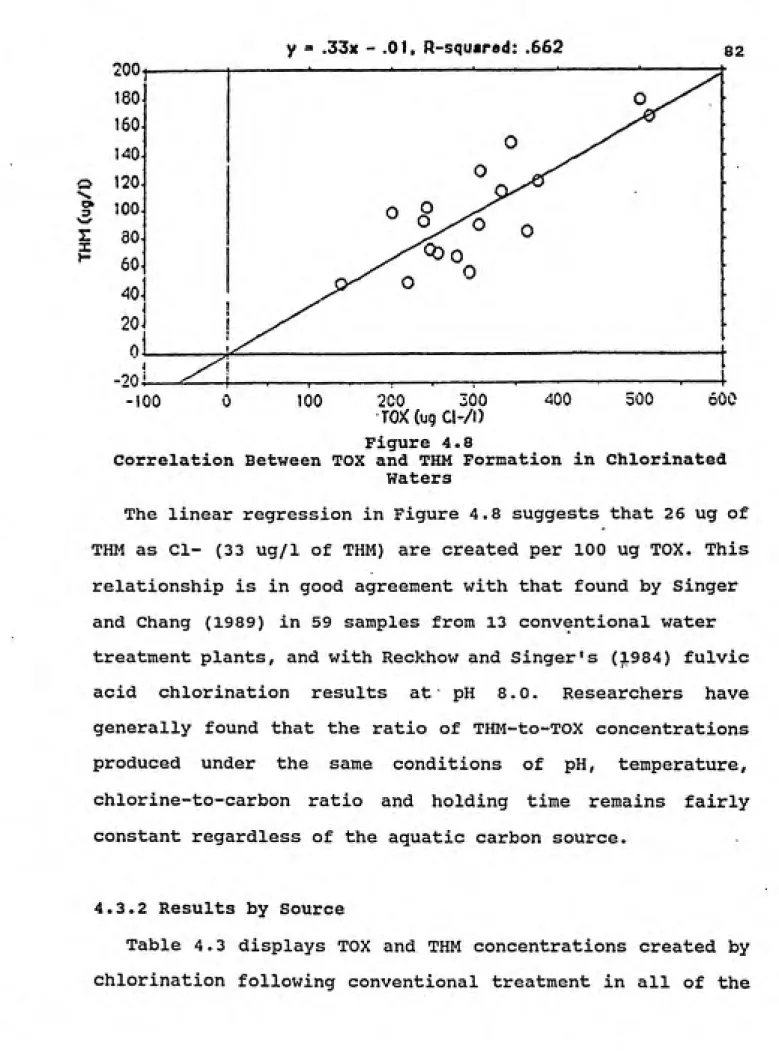
4.8 Correlation Between TOX and THM Formation in Chlorinated Waters... 82
4.9 Jordan and Falls Lake Samples: TOX and THM Production... 84
4.10 Jordan Lake Tributaries: TOX and THM Concentrations... 8 6 4.11 Jordan Lake Tributaries: Molar Distribution Among THM Species... 88
4.12 TOX and THM Concentrations in Finished Water From Two Local Water Treatment Plants... 90
4.13 Jordan Lake Finished Water Quality Comparison: Production of THM, TOX and Mutagenicity...107
1.0 Xntroduct:ion
Jordan Lake, located in Chatham County in central North
Carolina, was built by the Army Corps of Engineers in 1980 for
flood control and recreational use. Prompted by steadily
growing development in the area with increasing demands on
existing water supplies, Jordan Lake is currently being considered as a drinking water source for several nearby communities. Tributaries to Jordan Lake drain industrial and urban centers, and samples from these sources have
demonstrated toxicity in several bioassays. Elevated concentrations of metals and the presence of synthetic organic chemicals in one of the tributaries have raised concerns over the suitability of the lake as a source of drinking water.
Classified by the N.C. Department of Environmental Management as eutrophic, Jordan Lake water contains relatively high concentrations of total organic carbon (TOC) and humic
material. When treated with oxidants and disinfectants, humic substances may react to form compounds generally referred to as disinfection byproducts (DBFs). Trihalomethanes (THM), a class of potentially carcinogenic reaction products from the chlorination of aquatic humic material, have been regulated in drinking water by the U.S. Environmental Protection Agency
since 1979. New maximum contaminant levels (MCLs) in drinking
water for these and other DBFs will soon be announced. In
harmful impurities in the water as well as to evaluate the
potential formation of DBFs from various treatment processes.
The primary objective of this research was to test three treatment process trains for Jordan Lake water and to compare the finished water quality from each of the trains. Conventional surface water treatment consisting of coagulation, sedimentation and filtration was applied to samples of the raw water collected during four different seasons. Part of the filtered water was then disinfected with chlorine. Another portion was filtered through granular activated carbon followed by disinfection with chlorine. A third portion was treated with ozone followed by the addition of monochloramine. These three processes were applied to four samples of Jordan Lake water during one year and to four samples from Falls Lake near Raleigh, N.C., for purposes of comparison. Falls Lake is currently used as a source of drinking water for the City of Raleigh. Water quality and treatment effectiveness were measured in terms of turbidity
reduction, TOC removal, formation of THM and total organic
halides (TOX), and Ames mutagenicity.
The Ames genotoxicity bioassay is a method of assessing the collective presence of harmful compounds without analyzing for
specific chemicals. Results from this assay indicate a
relative level of genetic mutation potential in the whole
sample rather than from any specific compound. The Ames
2.0 Background and Theoretical Considerations
2.1 Jordan Lake Watershed
2.1.1 Hydrology
The Jordan Lake watershed encompasses the Haw River basin, covering 1310 square miles and including large parts of Guilford, Alamance, Rockingham, Caswell, Chatham and Orange counties and the Greensboro and Burlington metropolitan centers (North Carolina Department of Environmental Management
(DEM), 1985a). The tributaries New Hope Creek, Morgan Creek
and Northeast Creek drain a basin of 322 square miles including sections of Orange, Durham and Wake counties. Figure 2.1 shows the Jordan Lake Watershed. The two basins support approximately the same average runoff per area, so
essentially 80% of water inflow enters the lake from the Haw River and 20% from New Hope Creek (Moreau and Challa, 1985). However, the lake is structured such that about 95% of the storage pool is in the New Hope arm. When the lake surface is
at 216.0 feet above mean sea level (MSL), it is at the top of the conservation pool, and volume is estimated by the Army
Corps of Engineers to be 215,130 acre-feet.
Figure 2.2 shows Jordan Lake divided into four geographical
segments. In 1985, Moreau and Challa studied the water
-^ I
SBORO (/»!
DUXHtM
\
SCALE
/Vm^
a
Figure 2.1
Jordan Lake Watershed
B. EVERETT JORDAN LAKE '
DURHAM
s HILL ^r:L, \
mm CI
ciinia~ci
•gmant «'^
/
o« S«gm«nt lA III
m
Pittsbem
gment
Segment
,nfc-*Ci
Figure 2.2
to Segment II occurred during 2 6% of that year, from II to III for 23% and from III to IV during 19% of the year. Projecting the volume of exchanges during the largest backflow period, a maximum of 8% of Segment I water (Haw River inflow) was estimated to occur in Segment III (assuming complete mixing).
2.1.2 Water Quality
Jordan Lake was designed by the Army Corps of Engineers as
a flood control measure for downstream communities and for
recreational use. It began filling in 1981 and was reclassified in October 1983 by the North Carolina Environmental Management Commission (EMC) as Class A-II, raw water supply, in order to protect the water quality while investigations could be undertaken to determine the Lake's suitability as a drinking water source. Because of the intense industrial, urban and agricultural use of the watershed, the water quality in Jordan Lake is succeptible to impact by heavy metals, synthetic organic chemicals (SOCs), and nutrients from both point . and nonpoint basin sources. With the reclassification, the EMC required an evaluation of toxicant
sources in the watershed by the N.C. Department of Environmental Management (DEM).
2.1.2.a Point-Source Pollution
The Haw River carries effluents from 18 direct industrial
dischargers that treat 105 industrial wastestreams. The New Hope Creek basin receives waters from 3 major municipal plants that treat 25 industrial effluents, and from 1 industry
directly (DEM, 1985a). Direct and indirect industrial
dischargers to the Haw are by number 50% textile mills, 10%
machinery and metals manufacturers, 8% chemical plants, 2% tobacco processors and 3 0% miscellaneous. Industries in the New Hope basin are by number 19% metals and machinery, 12%
chemical manufacturers, 7% tobacco and textiles and 62% miscellaneous. The DEM monitors dischargers who have National Pollution Discharge Elimination System (NPDES) permits for releasing permit-specified concentrations and toxicants in
their effluent streams. "Toxicants" refers to substances that
cause toxicity in a bioassay and thus includes heavy metals and SOCs that may not be on the NPDES permit. Of the 169 NPDES permits in the Jordan Lake watershed, 25 permitted dischargers are known sources of toxicants, mostly heavy metals such as chromium, cadmium, copper and zinc (DEM, 1985a). Figure 2.3
shows the locations of the 1985 NPDES permit holders in the watershed. SOC analyses conducted by the DEM in 1984 on the effluents from the East and South Burlington and Durham City WWTPs all resulted in no compounds detected.
2.1.2.b Nonpoint-Source Pollution
Metals detected in the Jordan Lake watershed have been
y^
2
2
a u 0 G
ca u u c 00 V u u u o 0) u
•3f
Figure 2.3
land use in three of the major urban areas in the basin
accounted for urban sources of almost all deposited lead, 50-75% of the copper and 70-95% of the zinc measured in the waters, as well as significant amounts of the detected cadmium, arsenic, chromium, mercury and nickel. Pesticides from agricultural areas adsorb to soil particles and are deposited in streams and rivers by erosion and stormwater runoff (DEM, 1985a). The U.S. Soil Conservation Service estimated the amount of highly erodible (defined as greater than 12 tons erodible soil per acre) agricultural land in the
Jordan Lake watershed to be 8.2% of the Haw River basin and
2.7% of the New Hope Creek basin (DEM, 1985a). The growing development in the watershed may cause these percentages to rise with increased forest clearance for agriculture and construction, higher loading rates of stormwater runoff to soils from impervious surfaces, and a greater impact from new highways and traffic. These sources of nonpoint pollution
increase the rate of soil deposition into streams along with
the concentration of anthropogenic compounds adsorbed onto soil particles. Thus it can be expected that non-biodegradable pesticides and other anthropogenic matter are being deposited
2.1.2.C Stream and Lake Measurements
Prior to 1980, heavy metal concentrations in tributary streams often exceeded water quality standards; measurements in the last decade indicate significant reductions in metals concentrations due to wastewater treatment plant improvements and industrial pre-treatment processes (DEM, 1985a). The DEM analyzed Haw River water in 1983 for SOCs and identified 52 compounds including EPA priority pollutants trichlorobenzene, toluene and naphthalene at low ug/1 to unquantifiable
concentrations. Toxic biocides discovered in the Haw River in
1983 were identified by the DEM as triorganotin compounds common to textile mills. However, three SOC analyses of Jordan Lake in 1983 and 1984 resulted in no detectable compounds, but one analysis by the DEM in 1985 recorded 7 unidentified compounds in water collected from Segment I.
The Triangle Area Water Supply Monitoring Project is a comprehensive water quality study of six water supply reservoirs including Jordan and Falls Lakes. The project is a
joint effort of Chatham, Durham, Johnston, Lee, Orange and
Wake counties through the Triangle J Council of Governments
(TJCOG). The U.S. Geological Survey (USGS) and N.C. Department of Natural Resources and Community Development (NRCD) began collecting water and sediment samples at 32 stream and
reservoir sites in October 1988 and will continue monitoring for nutrients, metals, bacteria and SOCs for three years
metals in Jordan Lake were safely below water quality standards and nutrients such as phosphorus were similar in concentrations to previous years (TJCOG, 1989). Trihalomethanes were measured at 5 to 8 ug/1 downstream from wastewater treatment plants indicating the presence of chlorinated organic compounds. One or more of the pesticides diazinon, lindane and dieldrin were detected at levels up to 0.2 ug/1 in 34 out of 74 total samples and in 9 of 10 samples collected from the Haw River near Bynum. The North Carolina water quality standard for lindane is 0.01 ug/1 and for dieldrin it is 0.002 ug/1; there is presently no standard for diazinon. The same samples collected from the Haw River contained several undifferentiated alkanes and polyaromatic hydrocarbons in the 10 ug/1 range.
2.1.3 Comparison to Falls Lake Watershed
Falls of the Neuse Lake, hereafter referred to as Falls Lake, is located in Durham and Wake Counties, N.C., and is part of the Upper Neuse River system. Tributaries to Falls Lake include the Eno, Flat and Little Rivers and Ellerbe and Knapp of Reeds Creeks. The Falls Lake watershed covers 77 0 square miles and 10,703 acres (DEM, 1985b). Figure 2.4 shows
V
7\
OS CB -H
\i
L
Figure 2.4
the Eno River, and the John Umstead Hospital via Knapp of Reeds Creek. Falls Lake currently serves as the primary
drinking water source for the City of Raleigh, N.C.
Jordan and Falls Lakes are similar in terms of hydrology, nutrient loading and non-point source pollution. Classified as hyper-eutrophic by the DEM in 1985 based on total phosphorus, total nitrogen, secchi depth and chlorophyll a content. Falls Lake ranked as the most eutrophic lake in N.C. that year.
Jordan Lake was similarily classified and ranked the third
most eutrophic lake in N.C. by the same survey (North Carolina Department of Natural Resources and Community Development, 1986) .
2.2 Chlorination of Drinking Water
The discovery of the formation of organic contaminants in
drinking water due to chemical reactions between the disinfectant and organic material in the water has led to over a decade of research on disinfection byproducts (DBFs). Research has been aimed at discovering the composition and
formation routes of DBFs, associated health risks, and
precursor structures and their removal. In 1979, the U.S. Environmental Frotection Agency (USEFA) amended the Interim Drinking Water Standards to include a maximum contaminant level (MCL) of 100 ug/1 for total trihalomethanes (THM), a
group of potential carcinogens that may represent up to 3 0% of
water. Amendments to the Safe Drinking Water Act were added in 1986 that require the USEPA to set new MCLs for drinking water DBFs based on health effects research. Although the new
requirements were scheduled to be published in 1991, the EPA
has postponed final regulations until more definitive research can be completed concerning the chemical makeup, toxicological
effects and control methods of DBFs created by chlorine and alternative disinfectants, and until a balance between the chemical and microbial risks from the application of
disinfectants can be evaluated.
2.2.1 Free Chlorine Chemistry
Chlorine is usually applied in water treatment processes as
a gas (CI2) . It is quickly and completely converted in water
to hypochlorous acid (HOCl) as follows:
CI2 + H2O = HOCl + H+ + CI" (2.1)
Equation 2.1 has a rate constant at 25°C of K21 = 0.1 1 molds'
(Morris, 1966). Hypochlorous acid is in equilibrium with the unprotonated hypochlorite ion (OCl) as shown in Equation 2.2; the pKa for this relationship at 25°C is 7.5.
HOCl = H+ + OCr (2.2)
matter, particularly carbohydrate-related compounds, into nitrogen and carbon dioxide gases and carboxylic acids
(Johnson and Jensen, 1986) . Direct oxidations account for
50-80% of the chlorine consumption and are responsible for the effectiveness of chlorine as a strong disinfectant (Hileman, 1982). The formation of C-chlorinated or N-chlorinated
compounds by substitution reactions, especially with humic and
other aromatic compounds, has been the subject of extensive
research since the discovery of trihalomethanes in drinking water by Rook in 1974.
2.2.2 Reactions with TUnmonia
When chlorine is added to a water that contains ammonia, or vice versa, the chlorine and ammonia rapidly react to form chloramines such as monochloramine (NHjCl), dichloramine (NHClj) , and trichloramine or nitrogen trichloride (NCI3) . The species, together referred to as combined chlorine, occur simultaneously as described by Equations 2.3 through 2.5; the distribution is dependent on the chlorine to ammonia-N ratio
(Cl2:NH3-N), chlorine dose, temperature, and pH.
NH3(aq) + HOCl = NHgCl + Up (2.3) NH2CI + HOCl = NHCI2 + HgO (2.4) NHCI2 + HOCl = NCI3 + H2O (2.5)
The effect of the chlorine to ammonia ratio on chloramine speciation between pH 6 and 9 is depicted in Figure 2.5 and is
H3 (D O n (D (1- H-O S » (D ^ P» H-W H H O (D (u ro fs* • •O oi O H-!^ n-o H" O H H-3 iu rt H-O 1.4- 1.2-(0 DC (0 C O E E < 15
C
0.8-<D C
O 0.6H
SZ O CD DC 0.2--f—r 0 Breakpoint Combined Chlorine Free Chlorine
Chlorine/Ammonia Molar Ratio
the theoretical reactions that would occur without interaction
from organic compounds in the water; the solid line describes speciation in a real water with organic reactions. At chlorine
to ammonia-N molar ratios less than one, the chlorine is
rapidly converted to monochloramine according to Equation 2.3.
The rate constant for this reaction at 25°C and pH 8.0 is Kjj
= 4.6 X 10^ L mol'''s"'' (Weil and Morris, 1949) . This reaction is
most rapid at pH 8.5 and is complete in about 1 minute.
Between molar ratios of 1 and 1.5 more chlorine is available to substitute onto the already-formed
monochloramine (Equation 2.4). Dichloramine is formed more
slowly than monochloramine with a rate constant Kg 4 = 2.7 x
10^ Lmol'''s''' at 20°C (Morris, 1967) . Dichloramine is less
stable than monochloramine and decomposes by the following simplified reaction:
2 NHClj + HjO = N2 + HOCl + 3H* + 3Cl' (2.6)
Some nitrate is also formed in this decomposition (Morris,
1967). The residual total chlorine decreases as more added
chlorine proceeds through reactions 2.3, 2.4 and 2.6 until the minimum total chlorine residual, or "breakpoint," is reached.
The theoretical breakpoint occurs at a CljiNHj-N molar ratio
equal to 1.5 at which no chlorine residual is'found. In real waters, the breakpoint ratio is closer to 2 because some of the ammonia is oxidized to nitrate directly. Furthermore, some chlorination reactions with organic compounds occur more
rapidly than the chloramine formation reactions, causing the
As more chlorine is added beyond the breakpoint, the
ammonia has been entirely converted to N2 and the total chlorine residual occurs as free chlorine. Nitrogen
trichloride is formed according to Equation 2.5 when the
Cl2:NH3-N molar ratio is greater than 2 and the pH is less than
7.5 (Jolley and Carpenter, 1983). In a real water, the total
chlorine may also include some organic chloraraines that were not oxidized by the free chlorine (Scully, Yang and Mazina,
1984) .
2.2.3 Reactions with Bromide
Bromide exists in most natural fresh waters at low concentrations (<100 ug/1), but it is found at higher concentrations in brackish water, seawater and in some
industrial effluents. Bromide is quickly oxidized by chlorine
to form hypobromous acid with a rate constant at pH 8 and 25°C
of 2.95 X 10^ L mol'^'s"'" (Farkas, et.al., 1949):
HOCl + Br' = HOBr + Cl' (2.7)
The bromine species Brj, HOBr and OBr' are distributed
according to the system pH similar to the distribution of
chlorine. However, Brg is present in neutral pH regions and
HOBr and OBr" are equimolar at pH 8.7 and 25°C (Jolley and Carpenter, 1983). _
monobromamine has a half life of 19 hours at pH 8 and 25°C. Dibromamine has a half-life under the same conditions of 3 0 minutes (Jolley and Carpenter, 1983).
2.2.4 Reactions with Natural Organic Material
In order to quantify the amount and types of chlorinated organic reaction products in natural waters, researchers have characterized precursor structures that are targets for these reactions. About half of the dissolved organic carbon in
terrestrial streams is present as humic substances,
hydrophobic macromolecular structures from plant diagenesis (Jolley and Carpenter, 1983). About 25% of the total carbon is arranged in aromatic structures that researchers feel may be most responsible for chlorine consumption (Rook, 1977; Norwood
and Christman, 1987; Reckhow et al., 1990).
Fulvic and humic acids comprise the majority of humic
material in most surface waters. Fulvic acids have molecular
(Peters et al., 1980). However, humic acids are usually a
small percentage of the total humic material and may be easier
to remove by conventional treatment methods than the smaller
fulvic acids (Babcock and Singer, 1979; Collins et al., 1986).
In an investigation of chlorination products of humic and
fulvic acids, over 100 reaction products, not all containing
chlorine, were identified (Christman et.al., 1983). A later
study found similar chlorination products from fulvic acid and
implicated reactive phenolic structures that undergo ring
rupture as primary precursor structures for organohalide
formation (Norwood and Christman, 1987).
2.2.5 Chloro-Organic Byproducts and Relationships
While the chemical structure of organic material in the
water may help predict chlorinated byproduct formation,
relationships between the byproducts and chlorination
conditions may also aid in estimating byproduct types and
quantities. Specific byproducts that have been isolated in
chlorinated drinking waters include the volatile THM,
haloketones (HK) such as 1,1,1-trichloroacetone (TCAC),
(Suffet et al., 1976), and haloacetonitriles (HAN) such as
dichloroacetonitrile (DCAN) (Oliver, 1983); and the
nonvolatile compounds trichloroacetic acid (TCAA),
dichloroacetic acid (DCAA), dichlorosuccinic acid (DCSA),
dichloromalonic acid (DCMA) and chloral hydrate (CH) (Quimby
Together, these compounds account for up to 5 0% of the total
organic halogen concentration (TOX) in chlorinated drinking
waters. Reckhow and Singer (1990) chlorinated raw drinking
waters from several cities at pH 7, a chlorine dose of 2 0 mg/1
and a reaction period of 72 hours. On the average, the waters
consumed 2 mg chlorine per mg TOC in the sample under these
conditions. An average 23% of the chlorine consumed became
incorporated into the TOX. The major chlorination products
comprised the following average percentages of the TOX: THM,
22%; TCAA, 17%; DCAA, 7%; and TCAC and DCAN, 0.7%. Finished
waters from the same treatment plants had similar average
product percentages of the TOX: THM, 23%; TCAA, 11%; DCAA, 9%.
The distribution and quantities of chlorinated compounds
produced depends on several parameters including the
chlorine-to-carbon ratio, free chlorine contact time, system pH and
temperature, and background concentrations of ammonia and
bromide. Important observations made by several researchers
about the interrelationships between these parameters are
summarized below.
Increasing the chlorine-to-carbon molar ratio beyond 0.1,
Reckhow and Singer (1984) observed a sharp increase in TOX,
chloroform (CHCI3) and TCAA up to a molar ratio of 1.0, then
a much slower increase of all the species at higher molar
ratios. DCAA increased to about the same concentration
regardless of the ratio. Miller and Uden (1983) found that
chlorine-to-carbon molar ratios up to 2.0, but were broken down at the higher ratio of 5:1. Other products appeared only
at high chlorine-to-carbon ratios indicating the prerequisite
of rigorous oxidation for formation.
Reckhow and Singer (1984) observed a similar trend in TOX, THM and TCAA formation by lengthening the free chlorine
contact time as by increasing the chlorine-to-carbon ratio:
rapid formation in the first few hours followed by a slower
steady-state rate of formation. CHCI3 became a larger
percentage of the TOX from 9% after 30 minutes to 27% after
3 00 hours. TCAA increased at the same rate as the CHCI3 for 12
hours, then slightly decreased. DCAA remained 5-6% of the TOX
during the entire 3 00 hours. DCAN increased for 3 0 hours, then
decreased to below detection at 170 hours. In Miller and
Uden's experiment (1983), nearly 90% of the final
concentrations of TCAA, DCAA, CHCI3 and CH were attained
within 24 hours.
The general effects of pH noted by Reckhow and Singer
(1984) are decreasing TOX with increasing pH, increasing CHCI3
with increasing pH, and higher formation of TCAA and DCAA at low pH. Miller and Uden (1983) reasoned that HOCl is a much
stronger oxidant than OCl'. More highly oxidized chlorination
products such as TCAA may be expected at pH values below the
pKg for HOCl of 7.5. The formation of CHCI3 is a base-catalyzed
reaction that is not as dependent on the oxidation of fulvic
values. Chloral hydrate is unstable at high pH values and
decomposes to produce CHCI3. Krasner et al. (1989) observed the degradation of HAN, HK, CH and possibly cyanogen chloride at high pH values. Reckhow et al. (1990) observed that the TOX produced in humic and fulvic acid solutions at pH 12 was only about 50% of the TOX created at pH 7. They also noticed that when chlorination was at pH 12, the same fraction of TOX as trichloromethyl species was shifted from mostly TCAA at pH 7 to mostly CHCI3. They proposed that as the degree of protonation of a compound shifts with increasing pH, a change
in reaction mechanism from chlorine substitution to oxidation
may occur. This is evidenced by the reduced reactivity of humic substances at high pH and decreased production of TOX. The reduction of TOX observed at high pH may also be due to destruction of C-Cl bonds from base-catalyzed hydrolysis.
Fleischacker and Randtke (1983) noted a stronger increase in CHCI3 than TOX with increasing temperature. They predicted that at lower temperatures the TOX is comprised of mostly CHCI3 intermediates. Oliver (1980) observed a similar quantity of THM produced between a heated sample that was chlorinated at pH 7 and a sample chlorinated at ambient temperature at pH
11.
Several researchers have attempted to quantify the
incorporation of raw water bromide into THM production and to
explain the competitive reactions between HOBr and HOCl.
production with increasing bromide concentrations. They also
observed a shift from CHCI3 as the largest fraction of the THM
at raw bromide levels less than 0.1 mg/1 to bromoform (CHBrj)
dominance at bromide concentrations greater than 1.0 mg/1. Because the bromide requires oxidation by HOCl, the chlorine
demand may be significantly increased in the presence of high
bromide concentrations. Luong et al. (1982) found the chlorine consumption increased up to 50% in waters containing natural
bromide.
2.2.6 Models
Several models have been developed by researchers in order to help predict and quantify byproduct formation. In 1981, Singer et al. found excellent correlations between the raw water TOC, UV-absorbance (2 54 nm) and THM formation potential
(THMFP). Edzwald et al. (1985) also noted that raw water
UV-absorbance correlated well with THMFP and TOC, and that the relationship was unique to each water source and chlorination conditions. For example, a unique correlation was observed for the THMFP of the same fulvic acid at each different pH. Reckhow and Singer (1984) observed a strong correlation between THMFP and TOXFP and found that about 220 ug TOX were produced per mg TOC at pH 7 when chlorinated with 5 mg chlorine per mg TOC and reacted for 72 hours. Under these same
conditions, CHCI3 comprised about 2 0% of the TOX for a variety
analyzed byproduct formation at 7 treatment plants and also
found an excellent correlation between THMFP and TOXFP. Instantaneous THM correlated well with instantaneous TOX,
suggesting that for conventional surface water treatment
plants that apply coagulation and filtration, THM (ug/1) =
0.3 5 TOX (ug/1).
Oliver and Thurman (1983) correlated physical
characteristics with the THMFP of several fulvic acids and
found strongest relationships between THMFP and both molecular
size and color. Molecular size and color also correlated well
with each other, indicating increasing color with humic
molecule double bond conjugation. A weak correlation between
THMFP and phenolic content disputes the theory that THM
precursor structures are most likely high in phenolic content
and suggests instead that they are highly conjugated aromatic
ring systems.
Amy et al. (1987) developed two models, a multiple linear
regression model with logarithmic transforms and a nonlinear
regression model, to predict THM formation based on
UV-absorbance, TOC, chlorine dose, reaction time, temperature, pH
and bromide level. Over 1000 data points were used to
calibrate the models and a sensitivity analysis of parameters
and model verification using outside data were performed. The
models predicted THM formation within 20% of measured values
useful to simulate the THMFP of untreated waters and to
predict the effect of reaction time on THM formation.
Rechkow et al. (1990) investigated chlorinated byproduct
formation from 10 aquatic humic and fulvic acids and attempted
to relate structural characteristics of the humic material to
byproduct yields and chlorine consumption. A model was derived
to estimate the probable number of activated aromatic rings
that undergo chlorination substitution reactions. The percent
chlorine incorporated into TOX was modelled stoichiometrically
taking into account chlorine consumed by activated aromatic
rings and nitrogenous compounds. The TOX production from
fulvic acid was predicted very well by these models (r^=0.96) .
Good correlations were made between the ratio of TCAAFP to
THMFP and UV-absorbance (2 54 nm) , and between DCANFP and organic N.
2.3 Removal of Natural Organic Material by Coagulation
Surface water treatment plants in the United States have
traditionally used the conventional process combination of
coagulation, sedimentation, filtration and chlorine
disinfection to effectively remove particulate matter and to
inactivate pathogens. Currently, process design and operation
is evolving to achieve more efficient removals of high
molecular weight organic material that may react with
disinfectants to produce potentially carcinogenic disinfection
can be optimized to achieve average reductions of natural organic material of greater than 50%, substantially lowering the amount of disinfectant required and the concentration of
DBFs in the treated effluent.
Babcock and Singer (1979) found that aquatic fulvic acid
solutions required more alum for coagulation and resulted in lower removals of TOC than humic acid solutions. Coagulation of both the humic and fulvic acid solutions resulted in a 70% reduction in chloroform formation, leading the authors to
conclude that chloroform precursors were selectively removed by alum coagulation. The color in fulvic acids has been
correlated with aromaticity and with THMFP (Oliver and
Thurman, 1983) , suggesting that color removal by coagulation
of solutions containing fulvic acids may indicate THM precursor removal. Chadik and Amy (1983) also noted greater
removals of THMFP than TOC in various natural waters by coagulation. High reductions in UV-absorbance (310 nm)
following coagulation indicated that humic acids with more
UV-absorbance and greater THMFP were preferentially removed over fulvic acids that have low UV-absorbance and less THMFP.
Waters of low alkalinity (<20 mg CaCO^/l) were effectively
coagulated by charge neutralization at low alum doses and at
pH 5, whereas high alkalinity sources (>300 mg CaCO^/l)
required larger alum doses at pH 6-7 for removal by aluminum
by charge neutralization at lower alum doses than by sweep floe precipitation at higher doses and pH.
Reckhow and Singer (1984) evaluated the preferential removal of chlorination byproduct precursors by alum
coagulation of a fulvic acid and a natural water and ranked
compound removability from greatest to least as follows: UV-absorbing substances, dichloroacetonitrile (DCAN) and trichloroacetonitrile (TCAN) precursors, dichloroacetic acid
(DCAA) precursors, TOX precursors, THM precursors, TOC and
chlorine demand, and 1-1-1-trichloroacetone precursors. Singer and Chang (1989) determined that precursor removals at 7 water
treatment plants averaged 51% for TOC, 47% for THMFP and 49% for TOXFP.
Jodellah and Weber (1985) coagulated river water and found that higher doses of alum were necessary to achieve similar
TOC reductions than for humic and fulvic acid solutions.
Although TOC removal increased with greater alum doses, the THMFP reduction decreased, indicating that THM precursor removal does not always parallel TOC removal. The authors concluded that coagulation of the water produced an altered organic speciation that responded differently to chlorination
than the untreated water.
Collins et al. (1986) characterized several waters before and after treatment in terms of their molecular weight
distribution, humic substance content and functional group
the preferential removal of humic acids over fulvic acids by
showing a high reduction in organic matter with molecular
weight greater than 5000 (humic acids) but ineffective
removals of organic substances with molecular weight less than
500 (fulvic acids). Their results also concur with those of
others in the preferential removal of UV-absorbing substances
(humic material) and a higher percent removal of THMFP than TOC. The authors separated the treated and untreated waters
into hydrophobic and hydrophilic fractions, accounting for at
least 95% of the organic carbon. The hydrophobic fraction
represented humic material and 85-100% of the color in the
waters, while hydrophilic substances made up the non-humic
organic portion of the aquatic material. The hydrophilic
fraction contributed up to 65% of the nonvolatile TOC (NVTOC) and 56% of the THMFP, and was more difficult to remove than the hydrophobic organic material. Finally, carboxylic acid content was determined for the treated and untreated waters
since the acidic functional groups have a charge density that
affects the electrostatic attraction mechanism of coagulation.
The authors found that the low molecular weight fractions
corresponded to higher carboxylic acidities and were therefore
more difficult to destabilize by coagulation. This concurs
with the higher doses of alum required for effective fulvic
acid coagulation initially reported by Babcock and Singer
2.4 Removal of Natural Organic Material by Granular Activated
Carbon
Granular activated carbon (GAC) has received wide attention for its effective removal of synthetic organic chemicals from industrial effluents and drinking waters. The adsorption
capacity and removal efficiency of a GAC contactor may be
optimized by controlling process conditions such as characteristics of the carbon adsorbent, treatment of the water prior to application to the GAC bed, pH and biological activity.
GAC has several physical and chemical properties that affect its adsorption rate and capacity. Pore sizes of the carbon particle determine the surface area and number of active sites for adsorption. The pore size distribution affects the capacity of the bed and exclusion of some large adsorbates. Because most of the adsorption occurs in the pore spaces, an even distribution of pore sizes throughout the bed assures that a wide range of adsorbates with different molecular configurations will be retained. The surface chemistry of the carbon particles affects its affinity for specific compounds. Functional groups commonly found on the carbon surface are carboxylic, phenolic, hydroxyl, carbonyl and peroxide groups (Ishizaki, 1973); their distribution is dependent on the original source of carbon which is usually bituminous coal, lignite or petroleum coke. These functional
oxygen, causing the surface to become polar and attract water
molecules. The adsorption of water decreases available sites
for organic compounds and blocks pore openings, lowering the
overall capacity (McGuire and Suffet, 1978) . Grain size
distribution affects the build-up of headless through the GAC
bed, and carbon hardness helps to lengthen the life of the
GAC, minimizing troublesome carbon fines that are broken off during operation and reactivation.
The tendency of different compounds to adsorb on GAC
depends on their concentration and on the matrix of other
compounds that are competing for the same sites. Isotherms may be developed for individual compounds or surrogate groups of
compounds such as TOC; an isotherm describes the equilibrium
concentration of adsorbate on the GAC surface as a function of
the bulk equilibrium concentration of adsorbate in solution.
Readily-adsorbed organic compounds include aromatics and
chlorinated aromatics, phenols, pesticides, herbicides and
high molecular weight hydrocarbons. Poorly adsorbed organics
are alcohols, sugars, low molecular weight ketones, acids and
aliphatics, and very high molecular weight compounds or
colloidal organics (Froelich,
1978).-Humic substances are generally poorly adsorbed because they
are usually of molecular weight that is high enough to be
excluded from smaller GAC pores. McCreary and Snoeyink (1980)
found that adsorption of humic material was enhanced at low
substance. Lee et al. (1981) observed that alum coagulation before GAC application increased the capacity and rates of
adsorption for fulvic and humic acids. They noted that the
higher molecular weight fractions of these solutions that are not well adsorbed were significantly reduced by coagulation, resulting in greater access of the lower molecular weight
material to carbon pores that would otherwise be blocked by the higher molecular weight substances. Lengthening the empty
bed contact time (EBCT) increases the adsorption of humic
materials by allowing more time for compounds that adsorb more
slowly. Because humics encompass a wide range of organic
compounds, competition for active sites on the carbon may result in desorption and release of a less sorbable compound
for favored sorption of another. Thus, it is important to
monitor the effluent for increased concentrations of specific contaminants, especially those that are not preferentially adsorbed.
GAC provides an excellent medium for microbiological
activity because of the number of sites for attachment and the
Both of these processes can be expensive and require removal of the contactor from service. In Europe, many plants have chosen instead to optimize conditions for biological growth in the GAC bed, resulting in reasonable organic removals and
longer times between carbon reactivations. There is some
concern in the United States, however, that microbes may be released into the filter effluent and may not be adequately destroyed by disinfection, or may result in the production of harmful disinfection byproducts.
2.5 Ozone and Monochloramine as Alternative
Oxidant/Disinfectants to Chlorine 2.5.1 Ozone
Ozone has been applied for water treatment in Europe since
the early part of the twentieth century, and more recently in
the United States, to achieve disinfection without the
formation of chlorinated organic byproducts. Ozone can react
with compounds in solution by direct molecular activity or by indirect radical reactions (Hoigne and Bader, 1977) . Molecular
ozone is unstable in water. Decomposition of ozone is first
order with respect to the concentration of hydroxide ion (OH")
and molecular ozone concentration in the presence of radical
scavengers that prevent secondary reactions.
compounds, resulting in hydroxylated species that may react
more quickly with molecular ozone than their parent compounds. Free radical reactions may be induced by initiating favorable conditions such as high pH, UV light exposure or the addition of hydrogen peroxide; systems employing such combinations are referred to as advanced oxidation processes and are very effective in destroying compounds resistant to oxidation by molecular ozone such as trihalomethanes (Glaze et al., 1982). Conversely, by maintaining a high concentration of radical scavengers such as bicarbonate or operating at acidic pH, direct molecular ozone reactions are favored over free radical reactions and may be directed toward a more selective group of compounds. For example, Reckhow et al. (1985) observed lower organohalide formation in chlorinated fulvic acid solutions that were ozonated in the presence of bicarbonate than without bicarbonate, indicating that direct ozone reactions were more effective in organohalide precursor destruction than
free-radical reactions.
In natural waters, ozone initially reacts with humic
material at sites with carbon double bonds, electronegative
atoms such as N, P, 0 and S, complexed metals such as iron, and ortho-activated aromatic rings (Glaze, 1986). Humic substances can initiate free radical reactions that may be impeded by the presence of bicarbonate in the water. The nature of the direct and indirect reactions and their
the ozone dose and contact time, and the presence of radical
initiators and scavengers. Under general treatment conditions,
ozonated humic material is not fully oxidized, resulting in
raacromolecular structures and ring-cleavage products that are more hydroxylated, polar, biodegradable and of lower molecular weight than the parent compounds (Singer, 1990) .
Possible ozonation byproducts that may have potential health effects include organic peroxides, hepatotoxic
unsaturated aldehydes, and potentially carcinogenic epoxides
(Glaze, 1986) . Formaldehyde, a low molecular weight carbonyl compound, has been detected in several ozonated surface waters
(Jacangelo et al., 1989; Glaze et al., 1989). Ozone oxidizes
bromide in raw water to hypobromous acid which then can form
bromate and bromo-organic compounds such as bromoforra
similarily to reactions following chlorine oxidation. Preozonation followed by chlorination may enhance chloropicrin
formation (Hoigne, 1989), and preozonation followed by chloramination has been shown to increase cyanogen chloride production (Jacangelo et al., 1989).
of reduced iron and manganese and taste and odor compounds,
and as a coagulant aid (Singer, 1990).
Ozone increases the biodegradability of compounds in water and may thus promote biological activity in downstream
processes or in the distribution system. When applied prior to
filtration, the filter media provides a stable environment for biodegradation and prevents potential downstream regrowth
problems. Ozone followed by activated carbon filtration is termed biological activated carbon (BAG) and is used by many plants in Europe. This system relies on the partial oxidation
of compounds with ozone and further degradation by
microorganisms in the filter, as well as by adsorption on the carbon. Effective removals of TOG, chloro-organic precursors and chlorine-demanding impurities have been demonstrated by degradation processes, enhancing the adsorptive capacity of GAG (Rice, 1980), thereby reducing the frequency and cost of
carbon reactivation.
Ozone is toxic to microorganisms due to its oxidative and free-radical reactivity; thus, it is a very effective disinfectant. However, the use of ozone as a disinfectant is
limited by its rapid decomposition, resulting in no downstream residual disinfection capacity. Furthermore, ozone generates
doses commonly applied in water treatment practice (Chang and Singer, 1991); thus, post-chlorination of preozonated waters may produce undesirable quantities of THM. Monochloramine, which produces lower concentrations of THM than chlorine, is a more appropriate disinfectant to follow ozonation in waters
with high THMFP.
2.5.2 Inorganic Chloramines
Since the regulation of THM (EPA, 1979), monochloramine has
been used as an alternative drinking water disinfectant to free chlorine in order to reduce THM production. Monochloramine is reasonably stable in water at neutral pH and thus provides good residual disinfection in a distribution system. Chlorine and monochloramine both destroy microorganisms by disrupting the integrity of the cell
membrane. A much higher concentration of monochloramine is
required to achieve the same pathogenic kill as chlorine for most microorganisms. However, equivalency may be attained by
extending the contact time of the monochloramine.
Byproduct formation from chloramination has not been well researched. It is commonly understood that while chloramines do not produce the high concentrations of THM that chlorine is
nonpurgeable total organic chloride (NPTOCl) from monochloramine as that formed by the same doses of chlorine. Up to 10 mg/1 of monochloramine added to a fulvic acid solution of 3 mg/1 TOC at pH 7 resulted in <1 ug/1 chloroform after 100 hours, with up to 86 ug/1 TOCl produced. Five real waters were chloraminated and yielded less than 2 ug CHCI3 as Cl"/mg TOC and 12-52 ug TOCl/mg TOC. Good mixing of ammonia and chlorine is an important pre-requisite for limiting
byproduct formation from monochloramine because the free chlorine reacts faster with certain nitrogenous organic
compounds than with ammonia (Weil and Morris, 1949) .
Trichloroacetic acid and dichloroacetic acid were isolated in low concentrations in monochloraminated fulvic acid solutions
(Jensen et al., 1984). Jacangelo et al. (1989) found cyanogen
chloride and chloropicrin at low levels in water treated with
ozone and chloramine. Because chloramination produces
TOX-containing compounds, many that have not yet been identified,
significant research still needs to be conducted on this subject.
2.6 Mutagenicity of Drinking Water
2.6.1 Ames Bioassay
A year after Rook (1974) discovered the presence of
trihaloraethanes in finished drinking water, Ames et al. (1975)
published a simple method of determining potential for
Salmonella typhimurium. The Ames assay employs mutant strains of S. typhimurium which have lost the ability to synthesize
the amino acid histidine. The histidine mutation is
susceptible to reversion following exposure to a mutagenic compound, allowing the bacterium to regain the ability to synthesize histidine and thus reproduce in a minimal-histidine
environment. The number of colonies on the growth plates above the background level are considered proportional to the mutagenic potency of the sample towards that strain. Several
Salmonella strains have been developed which detect different
types of mutagenic response by offering different target sites
on the bacterial DNA; sensitivities of certain strains have been increased by inhibiting the DNA repair ability. Strains TA98, detecting frameshift mutations, and TAIOO, responding to base-pair substitutions, are highly sensitive to mutagenic compounds found in treated drinking waters and thus have been most frequently used for drinking water genotoxicity
assessments.
Indirect-acting mutagens are compounds that may be
benign until altered by enzymes specific to the bacterial strain. The specificity of this mutagen may only be determined
by a lack of mutagenic activity in the strain due to the
protective presence of S9, or by no activity in a different strain that lacks the necessary enzyme for transformation.
Although early studies suggested strong correlations between Ames assay mutagenicity and carcinogenicity in
rodents, a more recent evaluation from a database of 2 64 chemicals showed that only 58% of carcinogens tested displayed mutagenicity by the Ames test while 73% of noncarcinogens were
not mutagenic (Ashby, 1989). Carcinogenicity and mutagenicity
are both signs of chromosomal damage and are thus
independently significant. The Ames assay, due to its relative
simplicity compared to live animal assays, is currently the most widely used and validated short-term test for genotoxicity and is an important screen for potential arcinogenicity.
2.6.2 Mutagenicity of Chlorinated Drinking Water
Mutagenic activity has been detected in chlorinated drinking waters by the Ames assay since the late 1970s (Glatz
et al., 1978; Loper, 1980), and researchers have attempted to
chlorinated waters. Generally, the addition of rat liver S9 has been found to decrease the mutagenic activity of the water samples. Simmon and Tardiff (1978) assayed 22 halogenated compounds that might be found in chlorinated waters. Although chloroform did not exhibit mutagenic activity, the three other common THM species dichlorobromomethane, chlorodibromomethane
and bromoform showed significant activity in strain TAIOO without metabolic activation by S9 (-S9). Kool et al. (1982)
found mutagenic activity in 12 out of 15 drinking waters from
surface supplies in the Netherlands. They separated the mutagenic fraction and found that the majority of the mutagens were in the slightly polar nonvolatile fraction with molecular
weights on the order of 2 00.
In 1984, Holmbom et al. isolated the strong mutagen 3-chloro-4-(dichloromethyl)-5-hydroxy-2(5H)-furanone (MX) from chlorinated kraft pulp effluents and reported that at very low concentrations in the effluent (<10 ug/1), MX produced
2800-10,000 net revertants per nanomole of MX in TA100-S9. Later studies of Finnish chlorinated finished drinking waters showed that MX in concentrations of 5 to 7 0 ng/1 was responsible for up to 50% of the TA100-S9 mutagenicity in the samples (Holmbom
et al., 1990; Kronberg et al., 1990).
Backlund et al. (1989) chlorinated humic and river water at chlorine to TOC molar ratios of 0.5, 1.0 and 2.0, reaction times of 65 and 240 hours and various pHs. They found that
with decreasing pH and with increasing chlorine doses at each
pH. Although in some cases total mutagenicity increased over
the longer reaction period, MX was not detected in the 240-hour samples at pH 7 and 9. Also, MX contribution to total mutagenic activity was less at pH 7 and 9 than at pH 4 and 2. These findings are substantiated by the work of Holmbom et al. (1990) who demonstrated that MX is stable at low pH but undergoes ring opening and dissociation under alkaline conditions. Although the river water and humic water samples exhibited similar levels of mutagenicity under all conditions, the MX concentration and its contribution to total mutagenic activity was much lower in the river water. Thus, significant mutagenicity was produced by chlorinated compounds other than
MX.
2.6.3 Mutagenicity from Alternative Treatment Processes
Many studies have been conducted to assess the formation or removal of mutagenic activity through various water treatment processes. In general, disinfectants ranked in decreasing order of probable mutagenic activity production are: chlorine, chloramine, chlorine dioxide and ozone (Noot et.al., 1989), although ozone has been shown to sometimes produce as much
activity as chlorine (Cognet et.al., 1985). GAC treatment has
Ozone application in water treatment usually decreases raw
water mutagenic activity and subsequent activity produced by
chlorination, but occasionally has been shown to create
mutagenicity. In an early study of the mutagenic effects from
ozonation (Van Hoof, 1983), it was observed that ozonation
after prechlorination and filtration of a European river water resulted in effective removal of TA98-S9 frameshift
mutagenicity formed by prechlorination. TA100-S9 base-pair substitution mutagens created by chlorination were not as effectively destroyed by ozonation, although subsequent activity in this strain decreased at higher ozone doses. TA100-S9 activity before and after ozonation correlated well with UV-absorbance. Separating the extracts by molecular weight fractions, the authors observed large decreases in the concentration of low molecular weight compounds after ozonation. Kool et al. (1982) found that the majority of mutagenic activity in chlorinated drinking waters was associated with the low molecular weight fraction. However, Van Hoof (1983) noted that oxidation of hydrophobic compounds
by ozone was accompanied by the formation of some hydrophilic TA100-S9 mutagens.
In a later study of the same river water (1985), Van Hoof and colleagues preozonated the raw water prior to coagulation, filtration and post-chlorination. The ozonated water resulted in up to a ten-fold increase in TA98-S9 mutagenic activity in
ozone. Thus, ozone applied before chlorination may increase substances that form TA98 mutagenic activity when chlorinated. However, the previous study (Van Hoof, 1983) showed that ozone following chlorination effectively oxidized TA98 mutagens
created by chlorine. Therefore, the mutagenic activity associated with ozone is dependent not only on the raw water
quality but also on the location of ozone application relative
to the chlorine addition in the treatment process.
Cognet et al. (1986) showed that mutagenicity is also related to the ozone dose and contact time. Observing TA98-S9 activity in Seine River water before and after ozonation, they found that a higher ozone dose of 5 mg/l created less mutagenic activity than a lower dose of 1 mg/l. In a batch ozonation study using groundwater, TA98-S9 activity was
observed to increase over the influent level after 5 minutes
contact time, decrease after 10 minutes, significantly increase after 3 0 minutes and decrease to below background after 1 hour. This experiment suggests that different ozonation byproducts are created and destroyed under longer durations of ozone contact and that no predetermined dose or contact time is optimal for all waters.
Most studies analyzing the effect of GAC adsorption on
mutagenic activity have demonstrated high to complete removals. Bourbigot et al. (1986) found that all raw water or ozone-induced activity was removed by GAC. Loper et al. (1985)
chlorination, sand filtration and GAC filtration of river water for 32 weeks. They found that during normal operation and even after the GAC contactor was exhausted, mutagenic activity produced from chlorination was completely removed by GAC. Residues extracted from the GAC contactor following the 32 weeks contained all TA98+/-S9 activity in the top (influent) section while TAIOO activity was evident in decreasing concentrations from top to bottom. They concluded that the GAC preferentially adsorbed direct and indirect mutagenic compounds over TOG with a higher preference for TA98 sensitive compounds than TAIOO from this water source. Additionally, GAC effectively removed compounds that form mutagenic activity when chlorinated. When the effluent water from the GAC contactor was disinfected with 2.6 mg/1 chlorine and stored for 3 days, the samples produced no mutagenic activity.
Finally, studies by Anderson et al. (1990) and Huck et al. (1990) evaluated pilot scale treatments of river water over a two-year period. Treatment included coagulation and
sedimentation followed by the addition of chlorine, chloramine, chlorine dioxide or ozone. All samples were then filtered through sand and GAC, and final disinfection was applied with one of the above oxidants. During 2 out of 49
sampling periods, raw water mutagenic activity was exhibited
in both TA98-S9 and TA100-S9 and was reduced in both strains
most of the post-filtration chlorinated samples, five
chloraminated samples, one chlorine-dioxide-treated sample and
one ozonated sample. GAC completely removed all mutagenic
activity. Furthermore, mutagenicity was not created by any of
the disinfectants added following GAC-treatment. The
adsorption of MX and THM by GAC was evaluated and resulted in
higher removals of MX than THM. However, the adsorption
capacity for MX was reduced an average of only 4 0% in the
presence of high levels of background organic material over
3.0 Experimental Methods
3.1 Site Selection and Sampling Procedures
Jordan Lake, located in Chatham County, N.C., was sampled
north of the U.S. Highway 64 bridge at the proposed Apex-Cary
water supply intake (see Figure 3.1). This location is in
Segment III of the lake which extends from the northern side
of the U.S. Highway 64 bridge to the Farrington Road bridge.
The water in this segment has been classified by the
Department of Natural Resources and Community Development as
A-II, suitable for drinking water supply.
To compare the finished water quality from Jordan Lake with
that of another lake that is already used as a drinking water
source, samples were also collected from Falls Lake in Wake
County, N.C (see Figure 3.2). Falls Lake raw water samples
were taken at the dam release and are representative of water
at a depth of 12 to 16 feet from the lake's surface. This is
a similar depth to the intake for the Raleigh water treatment
plant. However, the samples collected experienced some degree
of turbulence and aeration through the spillway prior to the
point of sample collection.
Jordan Lake and Falls Lake samples were collected four
times during the year with the intent of comparing seasonal
variability, especially during the conditions of summer peak
algal productivity, fall turnover (a thermal destratification
and mixing process due to the drop in surface water
temperature) , winter minimum light and temperature, a^^j
B. EVERETT JORDAN LAKE '
J CHAPEL \,'^'.^ rN
S HILL ";«'|. \
— — -. « '""« w CIITIIN CI
•gin«nt <:
S«gm«nt
Pitttbore
gment -^^^ ^^^^
Segment LittI*
= Sampling Site
Figure 3.1
Dry Cr
rhaPP'
= Sampling Site Figure 3.2
Tributaries to Jordan Lake were sampled in the summer of 1990 to simulate a "worst case" condition of lake water quality and to analyze the mutagenic effects of the inflows.
These samples were processed through the same conventional treatment scheme as the lake water samples (see below). Aliquots from Morgan Creek, New Hope Creek and Northeast
Creek, major tributaries flowing into Segment IV of the lake, were collected in July, 1990 at sites currently sampled by the U.S. Geologic Survey (see Figure 3.1).
The Haw River was sampled at two locations in September, 1990 to assess the water quality in the major tributary to the lake. Water was collected from the river near U.S. Highway 64, about one mile upstream from Jordan Lake. The Pittsboro water
treatment plant raw water intake is in the Haw River north of
U.S. Highway 15-501; a sample was collected at the treatment plant's raw water sample tap to represent Haw River water at
this location.
Plastic Nalgene 10- and 40-liter bottles were washed with detergent and thoroughly rinsed in the laboratory prior to sample collection. The bottles and a plastic sampling bucket were rinsed with sample water on-site at least five times before collecting the raw water sample. At Jordan Lake, a boat
was taken to a location north of the U.S. Highway 64 bridge
the dam release. Tributary samples were collected by immersing a clean plastic bucket beneath the stream surface. Pittsboro water treatment plant influent was collected at the raw water sampling port in the plant laboratory. Temperatures were recorded on-site. Upon return to the laboratory, pH and turbidity were measured immediately. Raw water samples were taken for analysis of TOC, TOX, THM and Ames mutagenicity.
Finished water samples were collected from two surface water treatment plants that have sources similar to Jordan and
Falls Lakes. The water quality of these effluent samples was
analyzed for comparison to the finished quality of the waters
treated in the laboratory. Samples were carefully poured from the finished water sampling tap in the treatment plant
laboratories into clean four-liter glass bottles for the
bioassay, and into clean 40-ml glass vials with required preservatives for chemical analysis.
3.2 General Treatment Scheme
CHLORINE ADDITION
I
J RAW WATERCOLLECTION
pH, turbidity, temperature
TOC, TOX. THHa
Ames bioaaaay
COAGULATION
SEDIMENTATION
FILTRATION
i
pE, turbidityTOC. TOX. THHs
Ames bioassay 6AC
ADSORPTION
pH, TOC TOX. IBMs C12 residual Ames bioassayOZONE
APPLICATION
PH. TOC Uj TOX. THUS
CHLORINE ADDITION
i
I pH, TOC
•^NTOX.TOMs
V^F) Aaes
j^ bioassay
CHLORAMINE ADDITION pH. TOC TOX. TOns C12 residual Ames bioassayI pH. TOC
•jKtox.thms
( G ) NH2C1
Xw-^resiaual
Figure 3.3
Reduction in TOG and turbidity and the quantity of TOX and THM produced during each process were also determined to assess water quality throughout treatment. Conventional coagulation, sedimentation and filtration were applied to all of the raw water samples (Sequence A-B in Figure 3.3). Then, the conventional practice of post-chlorine disinfection (Sequence A-B-C) was contrasted with the advanced treatment alternatives of GAG adsorption followed by chlorination (A-B-D-E) and ozonation followed by chloramination (A-B-F-G).
3.3 Preparation of Glassware
Deionized distilled water was used for all chemical
preparations and final glassware rinses. Glassware was soaked in detergent, rinsed with tap water, soaked overnight in 10% sulfuric acid, rinsed with deionized distilled water and baked overnight at 100 °C. Glassware used in chlorination experiments was made chlorine-demand-free by soaking overnight
in purified chlorinated water (30 mg/1) and rinsing with distilled water prior to use. Glassware used in ozonation experiments was made ozone-demand-free immediately prior to
sample ozonation by diffusing ozone gas into deionized
distilled water in the vessel for 30 minutes followed by