Table of Contents
1.0 INTRODUCTION... 1
1.1 Purpose of the Study... 1
1.2 Existing Facilities... 3
2 . 0 NEW EFFLUENT LIMITS AND THEIR IMPLICATIONS... 6
2.1 Changes to Effluent Limits... 6
2.2 Effect of New TP Limits on the Plant Operation... 7
3 . 0 WHY BIOLOGICAL NUTRIENT REMOVAL... 9
4 . 0 BACKGROUND AND LITERATURE REVIEW... 10
4.1 Phosphorus In The Aquatic Environment... 10
4.2 Biological Phosphorus Removal In Wastewater
Treatment... 11
4.3 Nitrogen in the Aquatic Environment... 14
4 .4 Nitrification... 16
4 .5 Denitrif ication... 17
4.6 Nitrification and Denitrification in Wastewater
Treatment... 17
5.0 BIOLOGICAL PHOSPHORUS AND NITROGEN REMOVAL
PROCESSES...--- 20
5.1 Single-stage and Separate-Stage Nitrification... 21
5.2 Single-Sludge Two Stage Nitrogen Removal... 23
5.3 Operationally Modified Activated Sludge... 23
5.4 Phoredox Process... 25
5.5 A/O and A^/O Processes... 26
5.6 OWASA Nutrified Sludge... 28
5.7 PhoStrip... 29
5.8 Four-Stage Bardenpho... 29
5.9 Five-Stage and Three-Stage Modified Bardenpho... 31
5.10 Biodenipho... 31
5.11 The University Of Cape Town Process ... 32
5.12 Extended Anaerobic Sludge Contact (EASC) for
Biological Phosphorus Removal... 32
5.13 Consideration of EBPR at the Durham County
Triangle Plant... 35
6.0 PROPOSED PHYSICAL AND PROCESS MODIFICATIONS... 37
7 . 0 EXPERIMENTAL SETUP... 44
7.1 Reactor Setup... 44
7.2 Reactor Operation... 46
8. 0 METHODS OF LABORATORY ANALYSIS... 49
8.1 Total Phosphorus and Total Soluble Phosphorus... 50
8.2 Chemical Oxygen Demand... 53
8.3 Total Suspended Solids... 55
8.4 Nitrate... 56
8.5 Ammonia Nitrogen... 58
8.6 Kjeldahl Nitrogen... 61
8.7 Dissolved Oxygen and pH Measurements... 64
9 . 0 RESULTS AND DISCUSSION... . 65
10. 0 CONCLUSION AND RECOMMENDATIONS... 88
11. 0 REFERENCES... 93
12 . 0 APPENDIX... 98
List of Tables
Table 1.1 Plant Performance July 1987 to June 1989... 4
Table 2.1 Old and New NPDES Effluent Limits for Selected Parameters... 7
Table 7.1 Bench Scale Model Operating Parameters... 47
Table 7.2 Laboratory Testing Schedule... 48
Table 8 .1 Laboratory Testing... 49
Table 9.1 SVI test, 8/29/91... 84
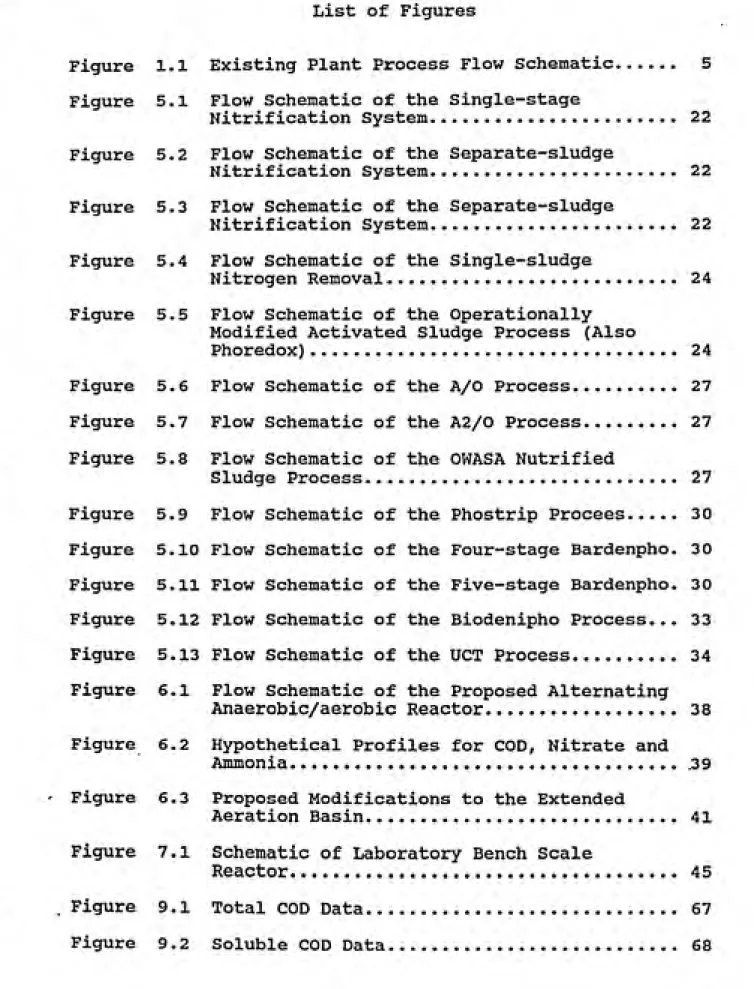
List of Figures
Figure 1.1 Existing Plant Process Flow Schematic... 5
Figure 5.1 Flow Schematic of the Single-stage
Nitrification System... 22
Figure 5.2 Flow Schematic of the Separate-sludge
Nitrification System... 22
Figure 5.3 Flow Schematic of the Separate-sludge
Nitrification System... 22
Figure 5.4 Flow Schematic of the Single-sludge
Nitrogen Removal... 24
Figure 5.5 Flow Schematic of the Operationally
Modified Activated Sludge Process (Also
Phoredox)... 24
Figure 5.6 Flow Schematic of the A/0 Process... 27
Figure 5.7 Flow Schematic of the A2/0 Process... 27
Figure 5.8 Flow Schematic of the OWASA Nutrified
Sludge Process... 27
Figure 5.9 Flow Schematic of the Phostrip Process... 30 Figure 5.10 Flow Schematic of the Four-stage Bardenpho. 3 0 Figure 5.11 Flow Schematic of the Five-stage Bardenpho. 3 0 Figure 5.12 Flow Schematic of the Biodenipho Process... 33
Figure 5.13 Flow Schematic of the UCT Process... 34
Figure 6.1 Flow Schematic of the Proposed Alternating
Anaerobic/aerobic Reactor... 38
Figure 6.2 Hypothetical Profiles for COD, Nitrate and
Ammonia... 39
Figure 6.3 Proposed Modifications to the Extended
Aeration Basin... 41
Figure 7.1 Schematic of Laboratory Bench Scale
Reactor... 45
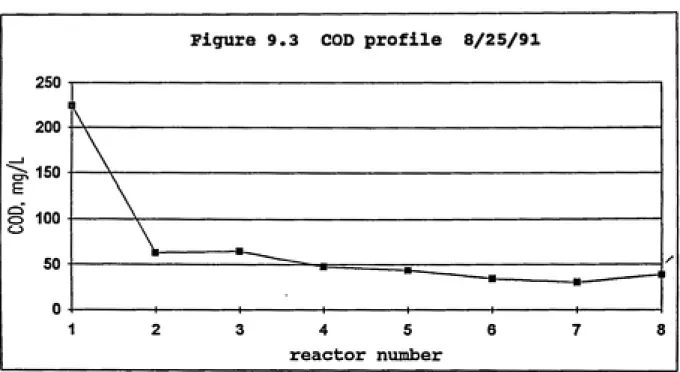
Figure 9.3 COD Profile 8/25/91... 70
Figure 9.4 COD Profile 8/29/91... 71
Figure 9.5 COD Profile 9/5/91... 72
Figure 9. 6 Phosphorus Data... 73
Figure 9.7 Total Phosphorus Profile 8/29/91... 74
Figure 9.8 Total NH3-N Data... 76
Figure 9.9 TKN Data... 77
Figure 9.10 NH3-N profile 8/29/91___... 78
Figure 9.11 TKN Profile 8/29/91... 79
Figure 9.12 TKN and Total Nitrogen Data... 80
Figure 9.13 Effluent N03-N and Total Nitrogen Data... 82
Figure 9.14 N03-N Profile 8/25/91... 85
Figure 9.15 N03-N Profile 9/5/91... 86
Figure 9.16 Total Suspended Solids Data... 87
1.0 INTRODUCTION
1.1 Purpose of the Study
The Durham County Triangle Wastewater Treatment Plant faces new
wastewater effluent restrictions with the renewal of the plant's
National Pollutant Discharge Elimination System (NPDES) permit.
The North Carolina Department of Environment, Health and Natural
Resources, Division of Environmental Management (NCDEM), that administers the enforcement of NPDES in North Carolina, imposed
more stringent effluent requirements on five-day biochemical oxygen demand (BOD5), ammonia nitrogen (NH3-N), total phosphorus
(TP), fecal coliform, residual chlorine and dissolved oxygen (DO).
The new effluent TP restrictions, along with recent prohibition of
wastewater sludge wasting into landfills in North Carolina and
potential agricultural application of waste sludge, motivated
Durham County to investigate additional nutrient removal
alternatives. The Biological Nutrient Removal (BNR) approach, in
contrast to chemical removal of phosphorus, demonstrates
potential for lowering operation and maintenance costs and
reducing sludge production. Also, BNR proves more suitable for land application of sludge because it does not employ potentially
harmful chemicals.
This report describes a laboratory investigation of the
feasibility of physical, operational and hydraulic modifications
to the extended aeration basins of the Triangle WastewaterTreatment Plant for enhanced biological phosphorus removal,
carbonaceous oxidation.
The Durham County Engineering Office funded this project to
investigate the feasibility of using BNR technology at the Durham
County Triangle WWTP. The focus of the study is the conversion of
the existing extended aeration tanks to alternating anaerobic and
1.2 Existing Facilities
Durham County Triangle Wastewater Treatment plant is located in
the southern part of Durham County just south of the point of
confluence of Northeast Creek and Burden's Creek. The plant has a
nominal flow capacity of 6 million gallons per day (mgd) and it
currently treats 2.5 mgd average daily flow.
The sources of wastewater are approximately 53 percent flow from
domestic/residential and 47 percent flow from research and
industrial facilities in the Research Triangle Park. At present,
twenty-one industries discharge their wastewater to the Durham
County Triangle WWTP. The type of industries vary, including
research and development, pharmaceutical, agricultural, electronic
and a metal plating plant (1).
Preliminary treatment includes two bar screens, followed by two
grit chambers. Four vertical centrifugal pumps transfer influent
wastewater from the headworks to the extended aeration basins. Two
parallel extended aeration basins - 392 feet long, 98 feet wide
and with 12 feet of water depth - each provide a hydraulic
detention time of 24 hours at the design flow of 6 mgd. Aeration
is achieved by eight surface aerators, which are platform-mounted
- four in each basin. Alum is added to the aeration basins for
phosphorus precipitation, and caustic soda for pH control. From
the aeration basins, the flow proceeds to the secondary
clarifiers. Two clarifiers - center pier with siphon feed and
peripheral overflow - provide a total hydraulic detention time of
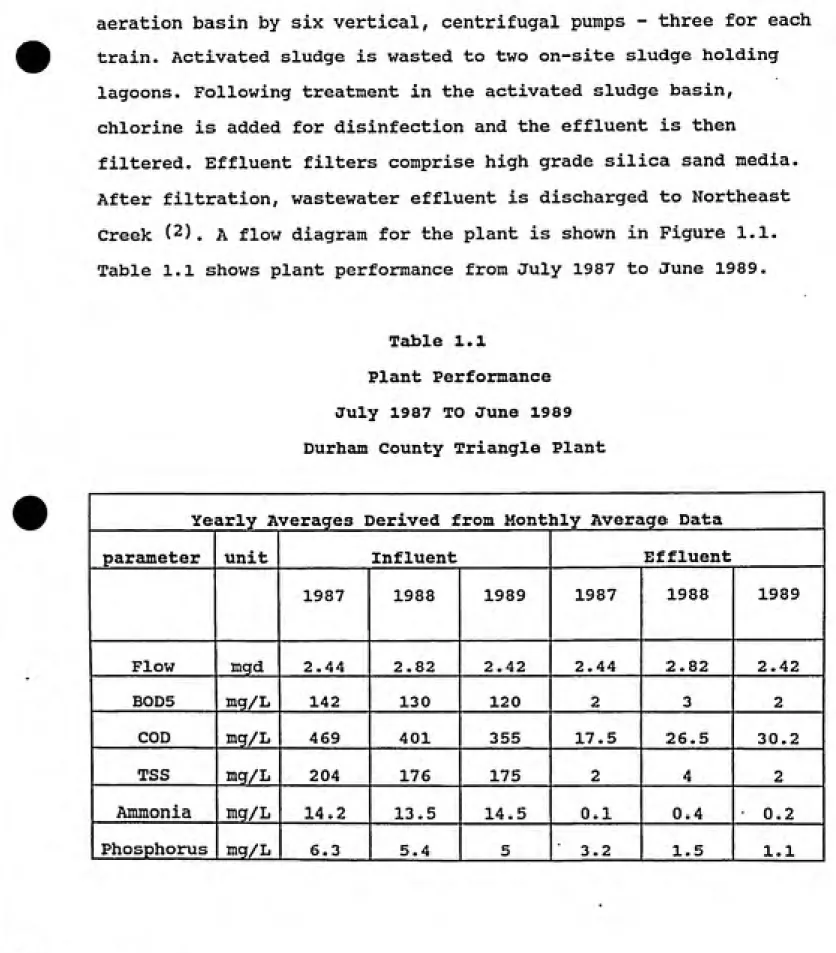
aeration basin by six vertical, centrifugal pumps - three for each
train. Activated sludge is wasted to two on-site sludge holding
lagoons. Following treatment in the activated sludge basin,
chlorine is added for disinfection and the effluent is then
filtered. Effluent filters comprise high grade silica sand media.
After filtration, wastewater effluent is discharged to Northeast
Creek (2). a flow diagram for the plant is shown in Figure 1.1.
Table 1.1 shows plant performance from July 1987 to June 1989.
Table 1.1
Plant Performance
July 1987 TO June 1989
Durham County Triangle Plant
Yearly Averages Derived from Mont]hly Average Data
pareuneter unit Influent Effluent
1987 1988 1989 1987 1988 1989
Flow mgd 2.44 2.82 2.42 2.44 2.82 2.42
BODS mg/L 142 130 120 2 3 2
COD mg/L 469 401 355 17.5 26.5 30.2
TSS mg/L 204 176 175 2 4 2
Ammonia mg/L 14.2 13.5 14.5 0.1 0.4 0.2
Plant -H Influent
-FBR
Alum & Caustic
Bar Saeens
and Grit
Removal
Influent
pump station
Screenings and Grtt
To Landffll
Aeration.
Basin 012 Final Clarifler RAS SOEffluent
Filters
scRAS Punnp
Station
WAS L-FB Effluent ^to Nortt^eost Creel( SLD LEGENDFB Filter Backwash FBR Filter Bacl<wasii Return
RAS Return Activated Siudge
SC Scum
SLD Sludge Lagoon Decant
WAS Waste Activated Sludge
Sludge
Lagoon
Jo Ultimate
Disposal
EXISTING PLANT PROCESS FLOW SCHEMATIC
Durham County Triangle Plant
2.0 NEW EFFLUENT LIMITS AND THEIR IMPLICATIONS
2.1 Changes to Effluent Limits
Durham County is permitted to discharge treated wastewater by
NCDEM. In mid-1990, stricter summer and winter discharge
requirements were stipulated in the plant's renewed NPDES permit.
The new discharge requirements for the Triangle Wastewater Plant include reduction in effluent nutrient levels. Specifically,
summer limits of ammonia nitrogen (NH3-N) and total phosphorus (TP) have been reduced from 2.0 milligrams per liter (mg/L) and
2.0 mg/L to 1.0 mg/L and 0.5 mg/L, respectively. NCDEM stated that the reduction in the discharge of phosphorus is required to
improve problems of localized eutrophic conditions measured by potential algal growth in the Northeast Creek arm of B. Everett
Jordan Reservoir, south of the treatment plant site (1). Table
2.1 shows changes to winter and summer discharge limits for the
Triangle Wastewater Treatment Plant.
Historical operating data that appear in Table 1.1 demonstrate that NH3-N has been removed effectively. The plant could meet the
new ammonia limits with little or no changes to the current
operating practices. However, phosphorus removal could be more
difficult to achieve. Considerable increase in the application of
chemical precipitant will be required to meet the new summer
Table 2.1
Old and New NPDES Effluent Limits
for Selected Pareuneters
Durham County Triangle Plant
OT.D MEVr
Effluent MONTHLY MONTHLY MONTHLY MONTHLY
Characteristics WINTER SUMMER WINTER SUMMER AVERAGE AVERAGE AVERAGE AVERAGE
Flow, MGD 6.0 6.0 6.0 6.0
BODS, mg/L 16.0 8.0 10.0 5.0
TSS, mg/L 30.0 30.0 30.0 30.0
NH3-N, mg/L 4.0 2.0 1.8 1.0
DO, mg/L 5.0 5.0 6.0 6.0
j TP, mg/L 2.0 2.0 2.0 0.5
Summer: April 1 to October 31
Winter: November 1 to March 31
2.2 Effect of New TP Limits on the Plant Operation
The removal of phosphorus is achieved at present by means of alum
addition. Alum has been used since mid-1987. The new summer TP
However, alum feed pumps are manually operated, and the plant is
staffed for only 8 hours each day. Constant rate for the chemical
feed pumps is not optimal because the influent flow and strength
change significantly through the day, evening and night hours
(diurnal variations). Periods of low flow and high alum
application could result in low pH levels, insufficient TP
removal, wasting of alum and potentially greater whole effluent
toxicity. The addition of higher amounts of alum, for increased
phosphorus removal, would require additional alkalinity, and
therefore would require application of greater amounts of sodium
hydroxide.
Sodium hydroxide feed is monitored manually, so application of
sodium hydroxide to match continuing variations in alkalinity
could pose an operational problem. Again it would carry additional
chemical cost. Automated chemical metering for alum and sodium
hydroxide would require an expensive upgrade to existing chemical
handling facilities.
In the future, the Triangle Plant will likely pursue sludge land
application as space in the existing sludge holding lagoons is
limited. The anticipated increase in alum feed would generate more
sludge and increase the aluminum content in the sludge, making it
less suitable for safe land application. For these reasons,
biological nutrient removal technology may have greater long term
advantages than chemical phosphorus removal.
3.0 WHY BIOLOGICAL NUTRIENT REMOVAL
The objective of biological phosphorus removal is to promote a net
accumulation of phosphorus in sludge without the intervention of
chemicals. The key to successful phosphorus removal is providing
both anaerobic and aerobic conditions for selection of phosphorus removing organisms. Removal of phosphorus from the main stream system is accomplished by wasting phosphorus rich sludge from the secondary clarifiers. Up to 7% accumulation of phosphorus on a
dry weight basis has been recorded for municipal systems utilizing
biological phosphorus removal. Activated sludge that is a product
of conventional activated sludge process typically contains 3%
phosphorus by weight (
ͣ
^) .
Many wastewater plants that utilize biological nutrient removal consistently meet removal requirements and save in operation and maintenance costs (5). Full scale conversion of an extended
aeration plant to a BNR configuration was shown to have phosphorus
removal potential to sub-mg/L. Modifications to the plant were
done at a minimal capital cost (^). Savings in annual operation
and maintenance cost of US$5-6 million have been estimated for a
total of thirty-two nutrient removal plants operating in South
Africa (6). ,
Specifically for the Triangle Plant, operation and maintenance
costs associated with power requirements for aeration could be
4.0 BACKGROUND 2^D LITERATURE REVIEW
In this study phosphorus and nitrogen removal were addressed. The
wastewater industry refers to these two constituents as the main
nutrients of concern or as the "prime nutrients". In the following
sections, phosphorus and nitrogen removal are discussed in greater
detail.
4.1 Phosphorus In The Aquatic Environment
All living cells require phosphorus, nitrogen, sulfur and carbon. Phosphorus constitutes approximately 3% of the cell mass on a dry
basis. Phosphates play a physiological role in the cell by being
the constituents of nucleic acids, phospholipids and coenzymes. In most aquatic environments the most commonly found forms of
phosphorus are orthophosphate, polyphosphate and organically bound
phosphorus. The orthophosphates, such as, P04~-^, HP04~2, H2P04~
and H3PO4 are available for microbial metabolism. Polyphosphates
include molecules with more than one phosphorus atom. In many
cases, polyphosphates are hydrolyzed and converted to
orthophosphates before their metabolism can proceed. In the
aquatic environment, activity of microorganisms affects solubility
and mobilization of phosphorus as inorganic phosphates are
assimilated into or released out of microbial cells. The
phosphorus cycle represents phosphorus movement with no change to
the oxidation state (6) (7) . ^n phosphorus forms remain in the +5
oxidation state.The main sources of phosphates in wastewater include 1)laundering
and other cleaning constituents, 2)fertilizers that include
orthophosphates and are carried into the wastewater systems via
surface runoff and snow melt and 3)biologically mediated release
of organic phosphates.
When excess phosphorus enters a phosphate-limited aquatic habitat,
a sudden increase in the bacterial and algal productivity - termed
eutrophication - can be experienced, leading to substantial
increase in organic matter in the body of water. The depletion of
oxygen associated with such excessive growth becomes deadly to
fish and other oxygen dependent biota. Concerns about
eutrophication led to the tightening of national effluent limits
on phosphorus (^)(1^) and are the reason for the newer total
phosphorus limits for the Durham County Triangle Plant (^).
4.2 Biological Phosphorus Removal In Wastewater Treatment
Polyphosphate is a form of inorganic phosphate that can be used in
the generation and accumulation of adenosine triphosphate (ATP), a
major carrier of energy in biological systems. Internal buildup of
polyphosphate reserves allows ATP production during periods of
limited external food and energy sources. The buildup of
polyphosphate characteristic of the polyphosphate bacteria is used
in biological phosphorus removal systems.
A recent study confirmed that polyphosphate is the major form of
bioaccumulated phosphorus in activated sludge. It was shown that
the storage of increased levels of polyphosphate can be stimulated
by providing fatty acids as carbonaceous oxygen demand (COD)
ͣ
source in conjunction with elevated magnesium and potassium (9)
Polyphosphate is stored in internal cytoplasmic granules that can be detected in a laboratory by staining techniques, such as the
Niesser staining, and using light microscopy. These granules are
often referred to as volutin . Following the fate of phosphorus in
BNR plants, polyphosphate and polyhydroxybutyrate (PHB) have been
shown to exist in volutin granules from activated sludge samples.
PHB molecules are common carbon reserve materials in bacterial
cells (6)(7)(10).
In wastewater treatment plants utilizing Enhanced Biological
Phosphorus Removal Systems (EBPR), the lack of terminal electron
acceptors - such as oxygen or oxidized nitrogen at the head of the
treatment train - provides advantages for sustaining
microorganisms that can accumulate internal carbon reserves over
other bacteria. Some of these bacteria, specifically heterotrophic
polyphosphate bacteria, are also capable of storing polyphosphate
reserves under aerobic conditions and subsequently utilizing it
for ATP production. Under anaerobic conditions heterotrophic
polyphosphate consuming organisms will hydrolyze internal
polyphosphate for energy needed to take up and store organic
carbon i^)i^^). it has been suggested that during the initial
anaerobic stage, fermentation of complex influent organic matter
to low molecular weight compounds such as acetic acid is required
for anaerobic organic carbon uptake to be achieved (10).
An anaerobic condition can cause internal hydrolysis of
polyphosphates and their release from the cell into solution
often referred to as "phosphorus release". Energy from breaking
high energy polyphosphate bonds enables target organisms to
extract soluble organic material from the wastewater. The result
of the hydrolysis of polyphosphate is a release of orthophosphate
from the cell. Organic carbon uptake in the anaerobic zone provides a mechanism for phosphorus accumulating organisms to successfully compete with microbes that are otherwise selected in
a aerobic or anoxic environments (10).
When biomass is introduced into an aerobic environment following
the anaerobic environment, phosphorus can be assimilated back into
the cell in the form of polyphosphate by the microorganisms. Some
phosphorus consuming organisms will hydrolyze organic compounds to
produce new cell mass and in turn will store polyphosphate with
the available energy. This stored phosphorus is in excess of usual
cell concentrations. The assimilation of phosphorus under aerobic
conditions is often referred to as "phosphorus uptake". As a
result, a net accumulation of phosphorus is taking place and a
portion of the biomass rich in phosphorus is wasted as waste
activated sludge.
Data collected in field investigations of four full scale plants
that use biological phosphorus removal technology revealed a clear
correlation between effluent phosphorus and effluent NO3-N (H).
This correlation demonstrated that the presence of NO3-N in the
return sludge stream inhibits EBPR. These findings suggest that
organic substrate which enters the anaerobic stage is used in the
presence of NO3-N for denitrification, therefore rendering it
the inhibiting effect of nitrate is that nitrate inhibits
fermentation reactions responsible for forming acetic acid and
other simple carbon sources, which are required by phosphorus
removing organisms (^).
Limits in influent organic carbon can lower the extent of
phosphorus release and uptake. Therefore, high influent BOD/P
ratios are desirable to achieve biological phosphorus removal.
Significant improvements in phosphorus removal efficiency have
been experienced when easily biodegradable organic material was
provided (12), Temperature and mean cell residence time (MCRT) are
two other important parameters that influence EBPR. McClintock
et al. (13) reported that EBPR was not possible at MCRT values
lower than 5 days and 10 degrees C, even with additional COD (as
acetate) added. Higher MCRT values were considered optimal because
of the associated reduced sludge production. In another
laboratory bench scale experiment, EBPR functioned efficiently at
MCRT higher than 2.9 days. At lower MCRT values, EBPR capabilities
begun deteriorating and showed dependency on temperature (14)^
4.3 Nitrogen in tjie Aquatic Environment
Like phosphorus, nitrogen is an essential element for growth of
organisms in the environment. It constitutes 12%-13% of cell mass
on a dry basis. Unlike the phosphorus cycle, the nitrogen cycle
represents movement of nitrogen with a corresponding changes in
its oxidation state. The forms in which nitrogen most commonly
exists in the aquatic environment are organic nitrogen and ammonia
nitrogen (-3 oxidation state), nitrite nitrogen (+3 oxidation
state) and nitrate nitrogen (+5 oxidation state). Organic nitrogen
and ammonia nitrogen are the principal forms in untreatedwastewater. The transformation of organic nitrogen to ammonia
nitrogen, referred to as ammonification, takes place by bacterial
decomposition of proteinaceous substrate and hydrolysis of
urea (15),
Two species of ammonia nitrogen are commonly found in the aquatic
environment - the protonated ammonia species, ammoniun ion (NH4''')
and its conjugate base, ammonia (NH3). The relative concentration of the two species depends on pH; the pK^ is 9.3. Organic
materials such as protein, peptides, nucleic acids, urea
and synthetic organic material are the source of organic nitrogen. The incorporation of NH4+ into nitrogen-containing material is
termed amination (1^)(17),
The combination of nitrite (N02~) and nitrate (N03~) is commonly
described as total oxidized nitrogen. The pE region over which nitrite dominates is very narrow, supporting the observation that nitrite is found normally in extremely low concentrations in theaquatic environment and is readily inter-convertible to N03~ and NH4+ (17).
Nitrogen enters aquatic environments from natural and manmade
sources. Several factors contribute to increased amounts of
nitrogen in natural waters: Increase in human activity, commercial
and industrial growth, elevated levels contained in precipitation,
dustfall and non-urban runoff, as well as the increase associated
with discharge of human waste. The main problems with nitrogen
build-up in natural waters are: 1)oxygen demand exerted when
nitrogen is discharged into the aquatic environment and 2)toxicity
of ammonia nitrogen to aquatic organisms. If nitrogen is a
limiting nutrient in the receiving waters, any form of nitrogen
entering the system can contribute to eutrophication (15).
Nitrification and denitrification are two processes by which NH3-N
and NO3-N ,respectively, are removed from wastewater. These two
processes are discussed in the next two sections .
4.4 Nitrification
The oxidation of ammonia nitrogen to nitrate, with nitrite
formation as an intermediate, is a process mediated by autotrophic
bacteria and is known as nitrification. Autotrophic bacteria
derive energy for growth from an inorganic source such as ammonia
and use carbon dioxide (CO2) as a carbon source for cell
synthesis. Two groups of autotrophic microorganisms, Nitrosomonas
sp. and Nitrobacter sp., carry out nitrification in the presence
of oxygen. Nitrosomonas sp. and Nitrobacter sp. are obligate
aerobes. They do not nitrify in the absence of oxygen. The
reaction is acid producing as demonstrated by the following
overall equation:
NH4+ + 2O2 ----•> NO3- + 2H+ + H2O
Approximately 7.14 mg/L of alkalinity, expressed as CaC03, is
consumed when 1 mg/L nitrogen goes through conversion from ammonia
nitrogen to nitrate.
4.5 Denitrification
Denitrification is a process by which nitrate is utilized as an
electron acceptor by heterotrophic bacteria to break down and
utilize organic substrates in an anoxic environment. Denitrifying
bacteria are facultative anaerobes that can grow under bothaerobic and anaerobic conditions. In this process nitrate is
reduced to nitrogen gas (N2(g)), which is released to the
atmosphere. About 3.57 mg/L of alkalinity can be recovered from
conversion of 1 mg/L of nitrate as nitrogen to nitrogen gas. The
availability of an organic carbon source is necessary for
denitrification to proceed (15)(19)_
4.6 Nitrification and Denitrification in Wastewater Treatment
Nitrogen in municipal wastewater is composed of about 60% organic
nitrogen and 40% ammonia nitrogen. Typical concentrations of ammonia nitrogen in municipal wastewater influents are around 25 mg/L and can be as high at times as 50 mg/L. Because
ammonification of organic nitrogen occurs during aerobic
wastewater treatment, complete nitrification normally requires
conversion of the total influent nitrogen to nitrate. Both aerobic
suspended growth and aerobic attached growth systems have been
identified as successful in carrying out nitrification (S).
Combined carbon oxidation and nitrification approaches ("single
sludge") or separate stage nitrification approaches have been used
successfully in activated sludge systems. The two main advantages
of a separate reactor for nitrification include good protection
against roost toxicants and stable operation with enhanced
selection of the targeted nitrifying bacteria. However, the
separate tank typically carries higher capital cost.
Systems for nitrogen removal are discussed in more detail in the
next chapter. The nitrification process is carried out by obligate
aerobes; therefore, dissolved oxygen levels in the system must beclosely monitored. The dissolved oxygen level should not fall
below 1-2 mg/L for successful carbonaceous oxidation and ammonia
nitrogen nitrification. Filamentous bulking can also become an
operational problem with low DO levels (S).
The following conditions have been identified to encourage high
rates of nitrification: low BOD5/TKN ratios, operation in high
temperatures and at pH levels in the range of 7 to 9 (^).
Some facilities combine denitrification with nitrification.
Nitrate respiration in anoxic zones reduces the amount of oxygen
needed for aerobic biodegradation. Nitrate as terminal electron
acceptor in total nitrogen removing systems was shown to have
potential for both reduction in energy for aeration and partial
recovery of alkalinity lost during nitrification (^8)(19).
A comparison of aerobic and anoxic conditions in activated sludge
applications was made by McClintock et al. (18). The effects of
nitrate respiration on microbial growth and biokinetic parameters
as well as removal efficiency in the activated sludge system were
explored. An anoxic system, utilizing nitrate as the terminal
electron acceptor, showed lower yield and higher substrate
utilization rate. The results pointed to the potential advantages
in reduction of sludge and savings in aeration energy. The
reduction in required oxygen can translate to lower power cost
associated with oxygen transfer.
5.0 BIOLOGICAL PHOSPHORUS AND NITROGEN REMOVAL PROCESSES
A number of processes have been proposed for biological nitrogen
and phosphorus removal. Some of the nitrogen removal processes are
designed for nitrification only, while others nitrify and
denitrify ; i.e., remove both ammonia nitrogen and oxidized
nitrogen. Biological phosphorus removal can be accomplished alone
or in combination with nitrogen removal. Biological phosphorus and
nitrogen removal often are combined in the same systems because
the removal of oxidized nitrogen often improves enhanced
biological phosphorus removal, as discussed in chapter 4.
Various commercial nutrient removal processes have been developed,
and most have been given trade names. The differences among
nutrient removal processes are mainly in the location of the
anaerobic, anoxic and aerobic stages in the treatment train and
the point of wastewater application. In addition, the origin and
flow of internal recirculation and the feed mode of the return
activated sludge (RAS) vary for some processes.
The use of chemicals is eliminated or reduced with the use of
biological nutrient removal approaches. An exception is the
"Phostrip Process" which is described below. When phosphorus
removal to sub mg/L is desired, filtration of the secondary
effluent can be used. Filtration can remove phosphorus associated
with suspended solids following secondary clarification, but will not be effective in removing dissolved phosphorus.
A description of some of the nutrient removal processes available
is summarized below. The processes mentioned are all
suspended-growth type.
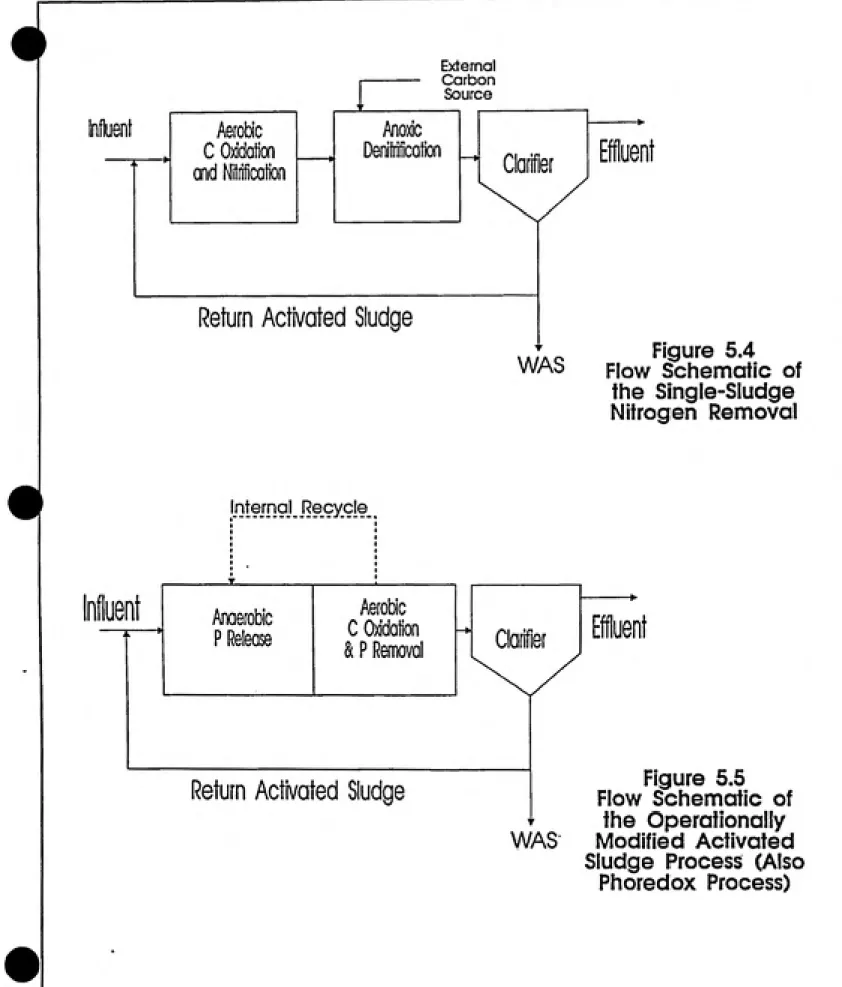
5.1 Single-stage and Separate-Stage Nitrification
In Single-stage nitrification, both carbon oxidation and
nitrification occur in the same tank. The extent of nitrification
in Single-stage systems depends on the operating mean cell
residence time. In Separate-Stage nitrification, carbon oxidation
and ammonia nitrification are thought to occur in separate
reactors.
The Separate-Stage nitrification configuration provides the
ability to optimize independently the two processes. Also, the
nitrifying bacteria could be protected from shock-loading of
biodegradable toxins, which are consumed prior to reaching the
nitrification reactor. Adequately long sludge retention time (SRT)
and dissolved oxygen (DO) above 2 mg/L are necessary to allow the
slow-growing autotrophs to nitrify successfully. Figures 5.1 and
5.2 show the Single-stage and Separate-Stage nitrification
systems, respectively. Both single and separate stage processes
shown in Figures 5.1 and 5.2 are referred to as Single-Sludge
systems, because the same biomass is used for both carbonaceous
BOD removal and nitrification. When separate clarifiers are used
between processes, the system is called Separate-Sludge system.
Figure 5.3 shows a Separate-Sludge Nitrification system. The Two-sludge system is likely more effective at separating carbon
oxidation from nitrification because of the ability to vary sludge
nfluent Aerobic C oxidation
and Nitrification
Effluent
k *
Cat tier
'
Return Activated Sudge
1
F
WAS
Figure 5.1
Flow Schematic of the Single-Stage
Nitrification System
Influent
Nitnfication
Return Activated Sludge
Figure 5.2
Flow Schematic of
the Separate-Stage Nitrification System
WAS
Claier earner Effluent
Return Activated Sludge
Return Activated Sludge
WAS
Figure 5.3 Flow Schematic of
the Separate-Sludge
retention times (SRT) independently in each stage. Nitrification
can be precluded in the first stage by operating it at low SRT. In
the Single-Sludge, Separate-Stage system, nitrification is likely
to overlap with carbon oxidation in the first reactor (^).
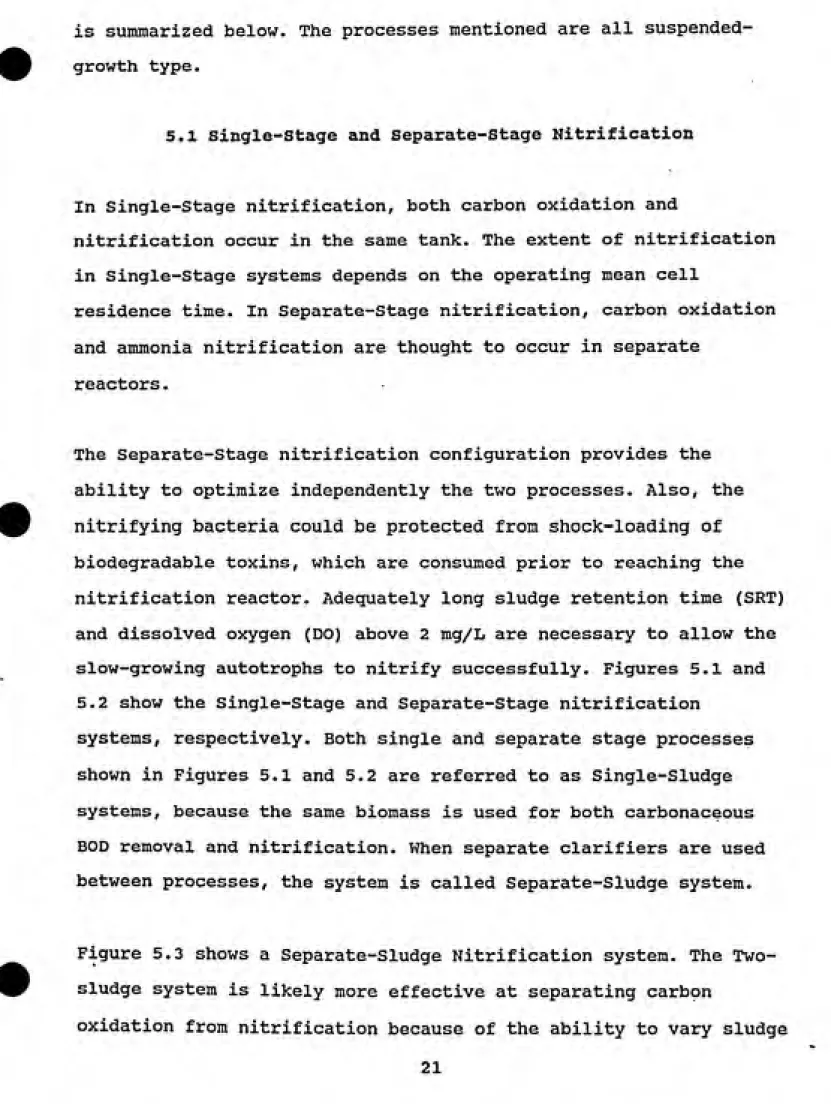
5.2 Single-Sludge, Two-stage Nitrogen Removal
The Single-Sludge, Two-stage Nitrogen Removal (nitrification plus denitrification) process features a modification to conventional activated sludge. An example is shown in Figure 5.4 for a system
with an external carbon source for denitrification. An aeration
stage remains at the head of the activated sludge system where most carbonaceous compounds are oxidized and nitrification takes place. Nitrified mixed liquor is then transferred to an anoxic zone with no measurable dissolved oxygen where denitrification occurs. In past applications, denitrification was slow in the
anoxic stage unless the volume of the tank was increased
significantly. Better total nitrogen removal results can be maintained with a continuous introduction of nitrogen-free, readily biodegradable organic carbon source ( for example methanol) to the second anoxic zone. This addition provides
substrate for the denitrifiers (^) .
5.3 Operationally Modified Activated Sludge Process
The Operationally Modified Activated Sludge process is a process
that converts part of the operating activated sludge facility to
an initial anaerobic stage (^5). This process is applicable for
conservatively-sized activated sludge plants.
4
External Carbon Sourceffluent
Denitnfication
Oxidation
Return Activated Sludge
Figure 5.4
WAS Flow Schematic of
the Single-Sludge
Nitrogen Removal
'.r)t®jn9j .R®9Y.?1®.
Influent
AnaerobicP Release
Aerobic
C Oxidation
& P Removal Ciarifier
Effluent
Return Activated Sludge
WAS
Figure 5.5
Flow Schematic of
the Operationally
Modified Activated
Sludge Process (Also
Influent and recycled sludge are mixed in the anaerobic zone,
where denitrification of nitrate in the return sludge takes place.
The extent of denitrification in the overall process depends on
the recycle ratios. High extents of nitrogen removal require very
high recycle ratios, e.g., 3:1 or higher. Some plants use an
"internal recycle" of mixed liquor from the aerobic section to the
anaerobic section, instead of using high recycle ratios (see
description of the A2/0 process below). Figure 5.5 shows a flow
schematic of this process.
5.4 Phoredox Process
Like the Operationally Modified Activated Sludge Process, the
Phoredox Process is designed for carbon and phosphorus removal and
is based on simple alteration of the activated sludge system as
shown in Figure 5.5. Anaerobic stage for phosphorus release is
followed by aerobic stage for phosphorus uptake.
A true anaerobic section i.e., no nitrate, at the head of the
train is needed for efficient phosphorus removal . Therefore, the
possible recirculation of nitrate-rich RAS to the anaerobic zone
could reduce phosphorus removal in this system. Consequently, this
system is applicable for plants that do not nitrify because
nitrate and nitrite production in the aerobic compartment will
otherwise be circulated to the anaerobic compartment with the RAS
and constitute an undesired external electron acceptor (^).
5.5 A/0 and A^/o Processes
The A/0 process represents a patented configuration for combined
carbon and phosphorus removal, utilizing an anaerobic zone
followed by an aerobic (oxic) zone. It was trademarked by Air
Products and Chemicals, Inc., Allentown, PA. The wastewatertechnology and patents were transferred recently from Air Products
to the Danish firm, I Kruger. The patents on the A/0 process will
expire in 1993. A schematic of the process is shown in Figure 5.6.
The A/0 system is similar to the Phoredox Process and the
Operationally Modified Activated Sludge Process. However, both aerobic and anaerobic sections are staged to provide a
configuration closer to an ideal plug flow. When nitrification is needed, longer hydraulic detention time in the oxic compartment is
required.
The a2/o process includes denitrification in addition to
nitrification and carbon and phosphorus removal as shown in Figure 5.7. An anoxic zone between the anaerobic and oxic section can be
maintained by "internal recycle" of nitrified mixed liquor from
the last oxic stage (20). The process is useful at plants that
must nitrify because nitrates are essentially eliminated from the
return sludge due to "internal recycling". This minimizes thepotential reduction in phosphorus removal associated with the
presence of nitrates in the anaerobic stage.
nluent
' Aerobic C Oxidation & P Removal
Return Activated Sludge
Internal Recycle
Influent
Anoxic
Stages
Aerobic
C Oxidatton
& P Removal
Return Activated Sludge
Ciarlfier
Effluent
Figure 5.6
Flow Schematic of the A/O Process
WAS
Clarifier
Effluent
Figure 5.7
Flow Schematic of
the A2/0 Process
WAS
nfluent
AerationPrimary
Clarifier J TricklingFilter
Effluen
Sludge t-T*
Fermenter
Acetic
Supernatant from Fermenter'
Figure 5.8
Flow Schematic of the OWASA Nutrified
5.6 OWASA Nutrified Sludge Process
The Orange Water and Sewer Authority (OWASA), Carrboro, North
Carolina, developed a biological process identified as "Nutrified Sludge" process to reduce phosphorus discharge from trickling
filter plants. Plants incorporating trickling filters experience
difficulty with biological phosphorus removal in the subsequent
activated sludge unit because trickling filter effluent has a very
low BOD/P ratio. Therefore a supplemental carbon source must be
supplied in the activated sludge system to promote biological
phosphorus removal. Figure 5.8 shows a schematic of this process.
Acetic acid is fed from a side-stream sludge fermentation tank to
phosphorus-consuming microorganisms in a separate environment from
the mainstream treatment. The RAS is exposed to the acetic acid
and then it is returned to the head of the aeration basin, where
it is mixed with trickling filter effluent. Production of acetic
acid is achieved in a two-stage fermentation tank - a high rate
anaerobic digester - to which raw sludge is diverted from the
primary clarifier. This process makes full use of existing
trickling filters ahead of the aeration basin and is applicable for plants that formerly utilized trickling filters as the main secondary treatment approach. Dependable results of effluent total phosphorus below 1 mg/L without tertiary filters are reported for the full scale operation at the OWASA wastewater treatment plant
in Chapel Hill, North Carolina (21).
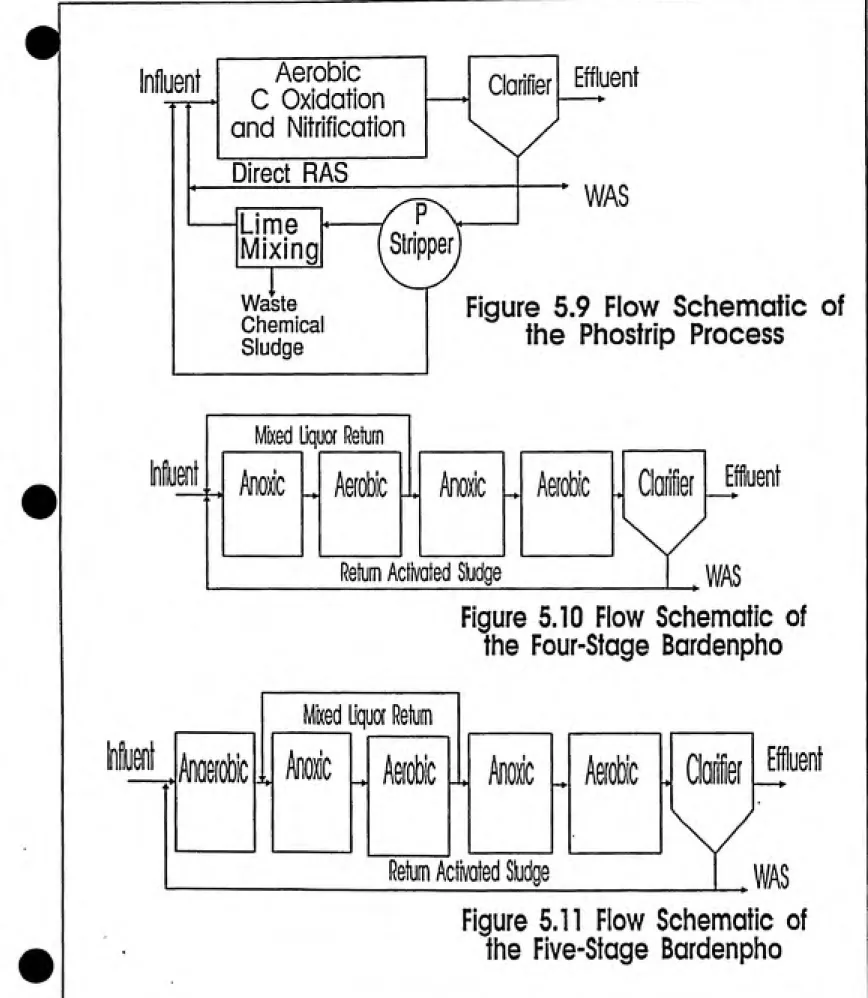
5.7 PhoStrip
The PhoStrip process is designed to provide combined
nitrification, denitrification and phosphorus removal and is
demonstrated schematically in Figure 5.9. The process includes an
activated sludge reactor that is fed by a combination of influent
wastewater and return sludge that has been stripped of phosphorus.
Return sludge is routed to an anaerobic clarifier where, in the
absence of oxygen, intracellular polyphosphate is "stripped"
(hydrolyzed) and separated from the sludge. The phosphorus
stripped sludge is returned to the main activated sludge reactor, while the phosphate rich supernatant is precipitated with a
coagulant in a separate tank.
The phosphorus stripper is normally designed for a solid detention
time of 5 to 20 hours. Solid detention time is determined by the mass of solids in the stripper divided by the mass of solids
leaving the reactor per day. This process has provided
satisfactory phosphorus removal results in full scale applications
but has rendered inadequate nitrate removal except in cases when
external carbon source was provided to the anoxic zone (^)(8),
5.8 Pour-Stage Bardenpho
The Bardenpho process involves alternating anoxic and aerobic stages. Originally four stages were included for carbon and
nitrogen removal as shown in Figure 5.10. A modification to the
Bardenpho process added a fifth stage for combined nitrogen and
phosphorus removal, as discussed in Section 5.9.Influent
Aerobic
C Oxidation
and Nitrification
Direct RAS
Lime
Mixing
Waste Chemical
Sludge
Stripper
Effluent
ͣ
* WAS
Figure 5.9 Flow Schematic of
the Phostrip Process
Mixed Liquor Retufn
ͣ
r*
kiot
Aerobic
Anoxic
Effluent
Return Activated Sludge
WAS
Figure 5.10 Flow Schematic of
the Four-Stage Bardenpho
Mked Uquof Return
Aeiobic
Effluent
Return Activated Sludge
^WAS
Denitrification takes place in the primary anoxic zone in which
raw wastewater or primary effluent is mixed with MLSS rich in
oxidized nitrogen from the primary aerobic zone. Nitrification and
carbonaceous oxidation occur simultaneously in the primary aerobic
stage. Further reduction of nitrate takes place in the secondary
anoxic stage as a result of endogenous metabolism of stored
reserves within the bacterial cells. A secondary aerobic zone is
the fourth stage in the Bardenpho treatment train. The secondary
aerobic stage is designed to stop denitrification just before
secondary clarification to combat rising sludge associated with
N2(g) production and to prevent phosphorus release associated with
anaerobic conditions (^).
5.9 Five-Stage and Three-Stage Modified Bardenpho
The five-stage Bardenpho system is similar to the four-stage
process as shown in Figure 5.11. The difference between the two is
that an additional anaerobic tank is placed at the head of the
treatment train in the five-stage process to promote selection of
phosphorus-accumulating microorganisms. In some cases, the last
two tanks of the five stage system - secondary anoxic and
secondary aerobic - have been deleted because they have been
observed to have little impact on total N removal. In this case
the process has been referred to as the three-stage modified
Bardenpho process.
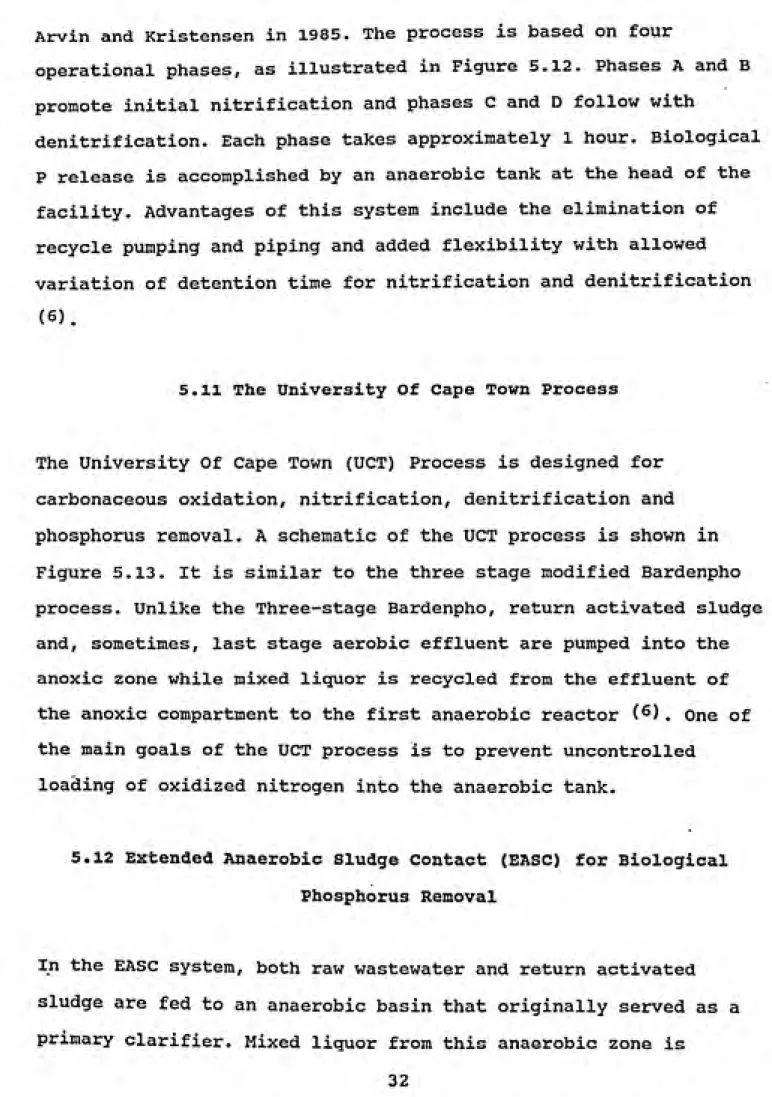
5.10 Biodenipho
The Biodenipho process is a sequencing batch system proposed by
Arvin and Kristensen in 1985. The process is based on four
operational phases, as illustrated in Figure 5.12. Phases A and B
promote initial nitrification and phases C and D follow with
denitrification. Each phase takes approximately 1 hour. Biological
P release is accomplished by an anaerobic tank at the head of the
facility. Advantages of this system include the elimination of
recycle pumping and piping and added flexibility with allowed
variation of detention time for nitrification and denitrification
(6).
5.11 The University Of Cape Town Process
The University Of Cape Town (UCT) Process is designed for
carbonaceous oxidation, nitrification, denitrification and
phosphorus removal. A schematic of the UCT process is shown in
Figure 5.13. It is similar to the three stage modified Bardenpho
process. Unlike the Three-stage Bardenpho, return activated sludge
and, sometimes, last stage aerobic effluent are pumped into the
anoxic zone while mixed liguor is recycled from the effluent of
the anoxic compartment to the first anaerobic reactor (^). One of
the main goals of the UCT process is to prevent uncontrolled
loading of oxidized nitrogen into the anaerobic tank.
5.12 Extended Anaerobic Sludge Contact (EASC) for Biological
Phosphorus Removal
In the EASC system, both raw wastewater and return activated
sludge are fed to an anaerobic basin that originally served as a
primary clarifier. Mixed liquor from this anaerobic zone is
Phase A
anoxic/
anaerobic
anaerobic clarlfler
aerobic
Phase B
anoxic/ anaerobic
anaerobic
aerobic
clarlfler
Phase C
aerobic
anaerobic
anoxic/
anaerobic
clarlfler
Phase D
aerobic
anaerobic clarlfler
anoxic/
anaerobic
Figure 5.12
Flow Schematic of
the Biodenipho
N03- Free
Mixed Liquor
Influent Anaerobic
N03 - Rich Mixed Liquor
Anoxic Aerobic
RAS
WAS
Rich in P
Clarifier Effluent
—ͨ
WAS
Figure 5.13
Flow Schematic of the
UCT Process
transferred to an aerobic activated sludge section and a final clarifier. The elimination or reduction of primary clarification
allows for greater feed of particulate substrate ,which can
enhance fermentation reactions that lead to production of acetic
acid and other organic acids. As discussed above, these acids are
vital in the selection of microorganisms responsible forphosphorus removal. The anaerobic stage at the head of the process
train adds to the anaerobic sludge detention time essential for
the relatively slow fermentation reaction. The EASC arrangement
promotes stratification within the basin contents, creating
anaerobic sludge blanket with anoxic supernatant (22)_
5.13 Consideration of EBFR at the Durheim County Trangle Plant
The Triangle Wastewater Treatment Plant is in the process of investigating additional chemical doses and chemical storage
facilities needed to achieve the new NPDES nutrient limits. Hazen
and Sawyer, P.C. performed a preliminary cost and technical
evaluation that outlined in a report alternatives for phosphorus
reduction (2). The alternatives compared were chemical phosphorus
removal, the A/0 Process, the Bardenpho Process, UCT (University of Capetown) Process and the Operationally Modified Activated
Sludge Process. Based on a life-cycle cost comparison for a
20-year planning period, the present worth cost for the Operationally
Modified Activated Sludge Process was found to be similar to the
cost for chemical phosphorous removal technology. Pilot or
plant-scale studies for the Triangle Plant were recommended to determine
if the existing extended aeration basins were capable of
accommodating phosphorus removal to the required levels and to
assess the need of additional tankage volume (2)
6.0 PROPOSED PHYSICAL AND PROCESS MODIFICATIONS
A schematic of the eight-stage alternating anaerobic and aerobic
system proposed in this report is shown in Figure 6.1. This system
is different from other available biological nutrient removal
systems. There is no "internal recirculation" of mixed liquor from
aerobic stages to anoxic stages to accomplish denitrification.
Instead, nitrification and denitrification occur in incremental
steps as flow proceeds downstream. The first anaerobic stage is
for EBPR. The following seven aerobic and anoxic stages are for
nitrification and denitrification, respectively. In addition, the
proposed system does not use an external source of carbon to
enhance the rate of denitrification in the anoxic stages.
The rational for eight alternating anaerobic and aerobic stages in
series is that carbon oxidation and nitrification can occur in
steps as wastewater makes its way through the reactor stages. In
the intermediate anoxic stages 3, 5 and 7 denitrification can be
made to occur.
The approach for total nitrogen removal, presented here, is
similar in principal to the way in which nitrification and
denitrification are carried out in sequencing batch reactors; the
air is turned on and off in alternating cycles until total
nitrogen is removed to a desired level (23).
Figure 6.2 shows hypothetical profiles for ammonia, nitrate and COD for an ideal eight stage alternating anaerobic and aerobic
nfluent
Anaerobic Aerobic Anoxic Aerobic Anoxic AerobicReturn Activated Sludge
WASFigure 6.1
Flow Schematic of the
Proposed Alternating
Anaerobic/Aerobic
NH4+
0
N03-0
COD
0
3 4 5 6
Stage Number
7 8
Figure 6.2
Hypothetical Profiles for
the size each reactor in the series.
It is important that not all of the biodegradable COD be consumed
in the up-stream aerobic stages. The extent of denitrification is contingent upon the availability of some soluble biodegradable COD
as a food source for denitrifiers at the latter anoxic stages.
Without biodegradable COD, denitrification in reactors 5 and 7
likely to be insignificant and only due to endogenous decay.
Since there is no need for "internal recirculation" pumping, the
system is a more passive nutrient removal system than the
Bardenpho, UCT, A2/0 or the Modified Activated Sludge Process. The
proposed alternating anaerobic/aerobic system closely resembles a
design for plug flow condition with eight independent compartments
in series. Of the processes described, the proposed configuration
is most similar to the Five-stage Bardenpho system.
The configuration of the existing extended aeration tanks at the
Durham County Triangle Plant is ideal for a conversion to BNR
technology. The two rectangular tanks could be retrofitted with a
relatively minor capital investment to a BNR configuration by
compartmentalizing the basins as shown in Figure 6.3. Baffles or
concrete walls with minimum size openings for flow could be added
to divide anaerobic zones from aerobic zones within the basins.
The size of the interstage openings should be minimized to reduce
undesired oxygen transfer from the aerobic zones to the anaerobic
zones.
Currently, screened and degritted wastewater is split equally
PROPOSED
TO BE ABANDONED EXISTING
PROPOSED FLOW PATTERN NEW BAFFLES (SIX) STAGE 5 Anoxic EXISTING STAGE 6 Aerobic STAGE 7 Anoxic STAGE 4 Aerobic STAGE 3 Anoxic STAGE 2 Aerobic STAGE Aerobic STAGE 1
Anaerobic
-RAS PUMPS
TO SECOJDARY FILTERS
JrjfTZ
TO SECONDARY FILTERS
AERATION BASINS
INFLUENT FORCE MAINS
FINAL CLARIRERS
PROPOSED INFLUENT FORCE MAINS
Figure 6.3
Proposed Modifications
between the two parallel extended aeration basins. The hydraulic configuration in the aeration tanks could be modified
by-relocating the aeration influent force main and reversing the flow
in one of the two basins. As a result, the aeration tanks could
operate in series with one flow pattern through eight stages,
instead of the existing two independent flow patterns in parallel.
The existing mounted surface aerator could provide mixing and
dissolution of air in the aerobic stages, while lower mixing
impellers could be utilized to provide mixing only at the
anaerobic sections.
The goal behind the proposed modification is an accomplishment of
selection of microorganisms that consume and store high levels of
phosphorus in a slow rate activated sludge treatment arrangement.
As discussed in chapter 4, an anaerobic zone at the beginning of
the activated sludge process would select for phosphorus removing
bacteria.
By definition, total nitrogen includes all ammonia forms and
nitrate species. The Triangle Wastewater Plant's NPDES permit does
not include total nitrogen - only NH3-N is included in the permit.
Therefore, the plant is not required to remove nitrate and
nitrite. However, the proposed modifications would facilitate
removal of nitrate and nitrite (denitrification) in addition to
ammonia removal (nitrification), which is necessary for successful
phosphorus removal. A sequential reduction in total nitrogen would
result in return activated sludge (RAS) low in nitrate. With RAS
low in oxidized nitrogen, anaerobic conditions in the first stage could be accomplished, benefiting biological phosphorus removal,
as discussed in Chapter 4
7.0 EXPERIMENTAL SETUP
7.1 Reactor Setup
A bench scale reactor was set up and operated continuously in a
laboratory within the Department of Environmental Sciences and
Engineering. A schematic of the reactor is shown in Figure 7.1.
The bench scale model consisted of 8 square, transparent acrylic
compartments, 6.5 cm X 6.5 cm X 24 cm - and a circular secondary
clarifier that measured 15 cm in diameter and was made from a
plastic funnel. The reactor was operated in an alternating
aerobic/anoxic configuration, as described in the previous
chapter. Compartment number 1 was mixed at the bottom, in the
absence of diffused air, and was followed by compartment number 2
that utilized both bottom mixing and aeration, and the alternation
continued for compartments 3-8. All 8 stages were bottom mixed by
magnetic stirrers. Air was supplied continuously to the oxic zones
at stages number 2,4,6 and 8 after passing through a humidifying
flask filled with distilled water.
The total volume of the eight compartments was 5.4 L with an
operating side water depth of 16 cm. The compartments were
connected in series by 1.2 cm diameter, 5 cm long transparent
polyethylene tubes. An identical polyethylene tube created a
gravity flow connection from stage number 8 to the secondary clarifier. Flexible Tygon tubing (R-3603) was utilized to feed
raw wastewater from a refrigerated influent container to stage No.
1, and to return activated sludge from the secondary clarifier to
stage No. l. Tygon tubing also was used to convey secondary
AIR
SUPPLY
HUMIDIFYING
FLASK
Scraper
rpm motor
CLARIFER No. 6
No. 1 No. 2 No. 3 No. 4 No. 5 No. 7 NO. 8 INFLUENT
PUMP
RAS PUMP
liiiililiiiisgt^iM^
TIMER
CONTROLLER
INFLUENT
4 deg C
Rve gallon Container
Stirred
EFFLUENT
4 deg C Five gallon
Container
REFRIGERATOR
T'
SampI* Un«SCHEMATIC OF
LABORATORY
BENCH SCALE
REACTOR
clarifier effluent to a refrigerated effluent container.
Return activated sludge and raw wastewater were pumped to stage i
by two Cole-Parmer peristalic pumps (model 7520-35).
Masterflex tubing was used within the head of each pump, and was
connected at each end by the Tygon tubing. The peristalic pumps
were turned on and off by a programmable timer/controller.
Discontinuous operation of the pumps was necessary because
continuous pump flow was too high to maintain a hydraulic
residence time of 24 hours in the 8 compartments. The on/off cycle
for the influent flow was five minutes on and five minutes off.
Consequently, the influent pump was turned on six times every
hour. RAS pumps were turned on three times an hour for 5 minutes,
followed by 15 minute off interval.
Raw wastewater from the Durham County Triangle plant was used as
feed to the reactors. Fresh sample was collected every three to
four days in a 15 L plastic container and placed in a
refrigerator. The container was placed on a stirrer to maintain
solids in suspension.
7.2 Reactor operation
Mean cell residence time (MCRT) was controlled by equal wasting of
activated sludge from all eight stages. Maintaining a nominal MCRT
of 10 days was attempted during this study. Table 7.1 summarizes
the operating parameters of the reactor.
A mechanical scraper was operated continuously in the clarifier to
reduce build-up of sludge on the clarifier walls and to ensure
efficient settling and collection of RAS. The scraper was made of
three teflon bands attached to an aluminum wire and was
continuously rotated by a one RPM motor. In addition, the side
walls of the eight compartments were manually scraped daily to
diminish attachment of solids to the walls. Further, daily
maintenance of the bench scale model included cleaning of the
interstage tubing and manual wasting of activated sludge in the form of mixed liquor.
Table 7.1
Bench Scale Model Operating Parameters
No. of Stages, total 8
No. of Anoxic Stages 4
No. of Oxic Stages 4
Stage Volume, cm^ each 676
Influent Feed, L/day 5.4
Recycle Rate, L/day 2.7
HRT, hrs 24
MCRT, days 10
Clarifier Overflow Rate, L/(cm2*day) 0.03(a)
Steady Operation Period, days ,40
Nominal Temperature, °c 24
(a) L/(cm2*day) * 245.5 = gal/(ft2*day)
During start-up on June 1,1991 the reactor was seeded with
activated sludge from the Durham County Triangle Wastewater
time with diluted return activated sludge from the OWASA plant in
Chapel Hill, NC. The second seeding was required because operational problems in the first month created unstable
conditions in the reactor that led to washout of the biomass.
The reactor was operated from June 1, 1991 to September 6, 1991
-a period of 96 d-ays. The schedule for the l-abor-atory study is
shown in Table 7.2. The initial setup period was used to fine-tune
reactor operation - correcting mixing problems in the different
stages and installing a 1 RPM mechanical scraper for the
clarifier. Then, continuous steady operation was achieved. Results
of this study are reported for the continuous steady operation
time that extended 4 0 days after successful setup.
Table 7.2
Laboratory Testing Schedule
Durheun County Triangle Plant
June 1 - July 22, 1991 Setup
July 23 - August 30, 1991 Continuous steady Operation
August 31 - September 6, 1991 Final Lab Testing, Dismantle
8.0 METHODS OF LABORATORY ANALYSIS
Various tests were performed to determine the characteristics of
the influent and effluent wastewater. Table 7.2 summarizes the
laboratory tests. All tests were conducted at the UNC-CH
laboratory except the phosphorus and TKN tests, which were
conducted at the City of Durham Farrington Road Treatment Plant
laboratory.
Table 8.1 Laboratory Testing
Durheun County Triangle Plant
Test Frequency Process Streeim(^)
Total Phosphorus twice a week PI, RE
Soluble Phosphorus twice a week PI, RE
Chemical Oxygen Demand (COD) twice a week PI, RE
Soluble COD twice a week PI, RE
Mixed Liguor Suspended Solids twice a week PI,RE
Nitrate twice a week PI,RE
Ammonia Nitrogen twice a week PI, RE
Kjeldahl Nitrogen twice a week PI,RE
Dissolved Oxygen occasionally stages 1-8
pH occasionally PI, RE & stages
(1) Plant influent (PI), grab sample prior to screening and grit
removal. Reactor effluent (RE) from refrigerated effluent
container.
Samples were analyzed at least once for every new five gallon
grab sample of plant influent wastewater. Tests on duplicate
influent and effluent samples were performed for quality
assurance. Tables Al, A2 and A3 in the Appendix summarize
laboratory testing reliability.
In addition, concentration profiles of various constituents in
stages 1 through 8 were performed to follow the change in
concentration through the reactor. The results of profiles are
discussed in Chapter 9 and are summarized in Table A4 in the
Appendix.
The different laboratory tests are described in further detail in
the following sections.
8.1 Total Phosphorus and Total Soluble Phosphorus
General Discussion: Wastewater contains phosphorus primarily in the form of phosphates - mainly orthophosphates; condensed
phosphates, such as polyphosphate; and organically bound
phosphates. Each of the phosphate forms can be further categorized
into soluble or particulate fractions.
The determination of total phosphorus is a two-step process aimed
at conversion of various forms of phosphate into dissolved
orthophosphate. This is done by digestion. Then, the resulting
orthophosphate ion concentration is measured. Filtration prior to
digestion and orthophosphate measurement can distinguish between soluble (dissolved) and insoluble forms of phosphorus (i6),
Test Procedure; The phosphorus tests were performed using an
autoanalyzer at the City of Durham Farrington Road Treatment Plant
laboratory. EPA method 365.1 (Colorimetric, Automated, Ascorbic
Acid) was used (^4). ivo phosphorus species were analyzed: total
phosphorus and total soluble phosphorus.In the first step of the total phosphorus test a predetermined
sample volume was acid hydrolyzed with sulfuric acid and digested
with ammonium persulfate. This digestion step was carried out for
30-40 minutes in a boiling environment. As a result, the condensed
and organically bound phosphates were converted to an
orthophosphate form, which is detectable by a colorometric
reading.
The second step was carried out by City of Durham Farrington Road
Plant laboratory personnel. In this step, concentration of
orthophosphate was determined by a colorometric approach:
1)Ammonium molybdate and antimony potassium tartrate reacted in an
acid medium with soluble orthophosphate to form an
antimony-phospho-molybdate complex.
2)This complex was reduced to a blue-colored complex by ascorbic
acid.
3)The intensity of the blue color, which is proportional to the
concentration of orthophosphate, was measured with a
spectrophotometer by absorbance measurement at 650 nm.
4)Phosphorus concentration was then determined from a standard
curve.
Standard phosphate solutions were prepared with anhydrous
potassium dihydrogen phosphate (KH2P04) in accordance with
Standard Methods(16).
Similar procedures were followed to measure dissolved phosphorus,
except samples were filtered through a 0.45 micron pore diameter filter before digestion.
Scunple Handling & Preservation: Samples for total phosphorus and total dissolved phosphorus were differentiated by filtration
shortly after collection. Samples were preserved by adding
Sulfuric acid (H2SO4) and cooling to 4 degrees C. The phosphorus
testing took place within 14 days of collecting the samples. Glassware and plastic containers used in handling samples wereacid washed (H2SO4). Phosphorus-free detergent was used for
cleaning of glassware and containers prior to acid washing.
Total phosphorus tests were run on duplicate samples to determine
the repeatability and reliability of the testing method. Results
of the reliability tests are presented in Table A3 in the
Appendix.
8.2 Chemical Oxygen Demand
General Discussion: The chemical oxygen demand (COD) test was used to measure the amount of organic material in the wastewater
samples. The COD test is widely used in the wastewater field and
is approved by the Environmental Protection Agency (EPA) as an acceptable test procedure for analysis of pollutants under the Clean Water Act (25).With the COD test, an oxygen equivalent of oxidizable organic
matter is measured. Potassium dichromate serves as an oxidizing chemical for converting organic contents in the wastewater to carbon dioxide and water. The test must be performed at elevated temperatures. The results are expressed in units of equivalent oxygen mass per unit volume required for the oxidation.
Test Procedure: Dried potassium hydrogen phthalate (KHP) was used for preparing the COD standards in conformance with Standard
Methods (16)^ Standard solutions were prepared and digested
periodically to construct a standard curve relating COD standard
concentration to absorbance (26),The following steps were taken in the COD test:
1) Two mL samples were added to vials containing pre-measured
reagents.
2) The vials were mixed thoroughly and incubated for two hours at
150 degrees Celsius in a COD digester until digestion was
completed.
3) The digester was then turned off and the vials were given time
to cool.
4) The COD concentration was then determined by a colorometric
method using a spectrophotometer. Oxidizable organic compounds
react and reduce the dichromate ion present in the vials to green chromic ion. The colorimetric method detects the amount
of chromic ion produced.
Hach COD digester reactor (model # 45600) and Hach vials
containing reagents for determination of 0-1500 mg/L COD were
used. The reagents in the vials included:
*potassium dichromate as the oxidizing agent
*silver sulfate as catalyst
*concentrated sulfuric acid
mercuric sulfate that acted as suppressant of chloride ion
interference.
Sample handling & preservation: Both soluble COD and total COD
tests were performed. Samples were filtered through a 0.45 micro¬
meter pore diameter glass fiber filter immediately after