NATHAN C. COBB. Microbial Activity on Granular Activated
Carbon Filter-Adsorbers. (Under the Direction of Dr.
FRANCIS A. DIGIANO)Granular activated carbon (GAC) used in the water
industry as a filter material for the adsorption of organic
compounds supports extensive colonization by
microorganisms. The GAC filter-adsorber provides the
environmental conditions that encourage microbial growth.
Having a biological treatment process in drinking water
production carries an implied health threat from
opportunistic pathogens that may survive the disinfection
barrier. There is some concern that microbially populated
carbon particles are released in the product water of GAC
filter-adsorbers.
A pilot plant consisting of three GAC filter beds
operated in parallel was assembled to explore the
biological activity associated with GAC filter-adsorbers
and evaluate the release of carbon fines in the product
water. A polycarbonate filter apparatus was used to
capture particulate matter in the product water for
evaluation.
term (beyond 30 days)• Colonization reached a steady-state
level of 10^ to 10^ CFU/g (dry weight) on the carbon and
10* CFU/mL in the product water. Coliform organisms were
not found to propagate in the filter-adsorber. The average concentration of fines was estimated as 1.0 ug/L and
scanning electron microscopy revealed that the particulate
supported extracellular growth that could enhance
survivability of microbes, but made the constitution of the
The research described in this paper and the resulting
technical report are a product of the continued support and
guidance of my advisor, Dr. Francis DiGiano. Thank you for
your patience and direction. Thanks also to Dr. Mark
Sobsey and Dr. Fred Pfaender for the valuable advice and
suggestions that furthered this research. I am indebted
to the Staff of the Franklin Water Treatment Plant for
their lab work and operation of the pilot plant.
I acknowledge with grateful appreciation all my family
and friends who provided the emotional support for this
work. To my wife, Viviane Cobb, who inspired me to
achieve, my heartfelt thanks for your encouragement,
support, and understanding.
This investigation was conducted as part of a research
program supported by the American Water Works Association
Research Foundation under Contract No. 408-88.
Acknowledgements iii
Table of Contents iv List of Tables vi List of Figures vii
1. Introduction 1 1.1 Defining the Problem 1 1.2 Approaching the Problem 2 1.3 Objectives of the Study 2
2. GAC and Microbial Activity 3
2.1 GAC Filter-Adsorbers 3 2.2 Microbial Growth on GAC in Filter-Adsorbers 5
2.3 Effects of Pretreatment on GAC
Filter-Adsorbers 7
2.4 Biological Activated Carbon and
Bio-regeneration in GAC Filter-Adsorbers 9 2.5 Implications of Microbial Growth on GAC 12
Microbes Identified on GAC 13
Effects of GAC Filtration on Microbes 15
Health Considerations 19
2•6 Effects of Operational Variables on
Microbes in GAC Filter-Adsorbers 20
2.7 Disinfection Considerations 21 2.8 Escape of Carbon Fines into GAC
Filter-Adsorber Product Water 24
2.9 Summary of Microbial Activity on GAC
Filter-Adsorbers 25
3. Materials and Methods 27
3.1 Description of the Pilot Plant 27 3.2 Total Organic Carbon Measurements 31
3.3 Microbial Enumeration 31
R2A Plate Count 31
Acridine Orange Direct Count 33
Total Coliform 33
3.4 Extraction of Microbes from the GAC 33
Evaluation of Fines 41
3.6 Scanning Electron Microscopy 43
4. Results and Discussion 45
4.1 Evidence of Microbial Growth 45
4.2 Effect of Application Rate on Microbial
Activity - Run 1 49 4.3 Effect of Backwash Strategy on Microbial
Activity - Run 2 55 4.4 Microbial Density and Growth Pattern 65
4.5 Coliform Bacteria in GAC Filter-Adsorbers 71
4.6 Estimation of Carbon Fines in the Product
Water of GAC Filter-Adsorbers 72 4.7 Scanning Electron Micrographs of GAC and
Fines 76
Micrographs of GAC 76
Micrographs of Fines 79
5. Conclusions 84
References 86 Appendix A: Statistical Analysis of Plate Count
2.1 Removal Efficiencies of Microbially Active GAC
Filter-Adsorbers 8
2.2 Classification of Microbes Colonizing GAC 13
2.3 Microbial Concentrations in the Product Water
of GAC Filter-Adsorbers 17 2.4 Microbial Concentrations on GAC 18
2.5 Factors Affecting Microbial Activity in GAC
Filter-Adsorbers 20
3.1 Franklin Water Treatment Plant Characteristics 28
4.1 Statistical Analysis of Run 1 Product Water
Data 52
4.2 Microbial Density in Backwash Water 57 4.3 Statistical Analysis of Run 2 Product Water
Data 62
4.4 Chlorine Dosage in Backwash Water 62
4.5 Growth Curves on GAC Filter-Adsorbers 68
4.6 Estimated Fine Concentration in the Product
Water of GAC Filter-Adsorbers 73
A.l Paired Samples T-Test on Run 1 Product Water
Data 94
A.2 Wilcoxon Signed Ranks Test on Run 1 Product
Water Data 95
A.3 Paired Samples T-Test on Run 2 Product Water
Data 96 A.4 Wilcoxon Signed Ranks Test on Run 2 Product
Water Data 97
3.1 Schematic of Pilot Plant Operation 29
3.2 Photo of GAG Filter-Adsorbers 30
3.3 Apparatus for the Gapture of Garbon Fines 39
3.4 Photo of a Polycarbonate Membrane Filter 41
3.5 Diagram of the Garbon Fine Evaluation
Procedure 42
4.1 TOG Removal in Run 1 46 4.2 TOG Removal in Run 2 47 4.3a Plate Gounts in Product Water - Run 1 50 4.3b Plate Gounts in Product Water - Run 1 51 4.4 Microbial Attachment to GAG - Run 1 54
4.5 Profile of TOG in a GAG Filter-Adsorber 56 4.6 Product Water Plate Gount During a 48-Hour
Filter Run 59
4.7a Plate Gounts in Product Water - Run 2 60 4.7b Plate Gounts in Product Water - Run 2 61
4.8 Microbial Attachment to GAG - Run 2 64
4.9 Microbial Attachment to GAG by AODC 66
4.10 Plate Gount Associated With Fines 75
4.11 Gorrelation Between Mass of Fines and Plate
Count 77
4.12 Micrograph of Unpopulated GAG 78 4.13 Micrograph of Populated GAG 78
4.14 Micrograph of Populated GAG at Higher
Magnification 80 4.15 Micrograph of Unpopulated PAG 80 4.16 Micrograph of Unpopulated PAG Fragments 81 4.17 Micrograph of Populated Fines on a Membrane
Filter 81
4.18 Micrograph of Populated Fines at Higher
Magnification 83 98 99 100 101 102 103 A. la Plate Gounts in Product Water
Bars
- Run 1 Error
for 2 GPM/SQ FT
A. lb Plate Gounts m Product Water Bars
- Run 1 Error
for 4 GPM/SQ FT
A. Ic Plate Gounts m Product Water Bars
- Run 1 Error
for 6 GPM/SQ FT
A. 2a Plate Gounts m Product Water - Run 2 Error
Bars for GI2
A. 2b Plate Gounts m Product Water - Run 2 Error Bars for BW-24 hr. A 2c Plate Gounts m Product Water - Run 2 Error
by
Nathan C. Cobb
1. INTRODUCTION
1.1 Defining the Problem
Granular Activated Carbon (GAC) as a filter material used in water treatment is a promising technology that is being utilized increasingly in the water industry. GAC functions as an adsorbent that is effective in reducing or removing many taste and odor causing compounds. Precursors of halogenated organic chemicals, usually measured by total
organic carbon, may also be removed. The physical
characteristics that make GAC ideal for adsorption, such as its rough surface and functional groups, also encourage attachment and colonization of microorganisms. The
potential of carbon particles to be released from these filters and carry pathogens or opportunistic pathogens through the disinfection barrier has been identified as a
adsorbers and the possible release of carbon fines, a pilot
plant was assembled at the Franklin Water Treatment Plant
in Charlotte, North Carolina. This facility is operated by
the Charlotte Mecklinburg Utility District (CMUD) to
provide drinking water for the City of Charlotte. The
pilot plant was operated in parallel with the Franklin
Water Treatment Plant filters to allow investigation of
several process design parameters, including pretreatment
method, application rate, and backwashing strategy.1.3 Objectives of the Study
The research carried out in the course of this study
had the following objectives:
* To assemble and put in operation the pilot plant
* To characterize the product water of the GAC filters
in regard to microbial content
* To characterize the microbial activity on the GAC
* To determine the effects of application rate and
backwashing strategy on the bacterial population
of the GAC filter-adsorber
2.1 GAC Filter-Adsorbers
GAC has been used in water treatment applications for
decades as an adsorbent material for certain undesirable
compounds. The unique structure of activated carbon, with its pores and surface groups, makes it an especially
effective adsorbent for many compounds in drinking water. In 1938 there were already over 1000 U.S. water treatment plants using carbon [13]. The primary use of GAC in the treatment train is for removal of taste and odor compounds
[31]. However, filter-adsorbers are being examined for the
removal of synthetic organic chemicals (SOC's) and
pesticides from contaminated waters, and for reducing the concentration of trihalomethane (THM) precursors in waters
with high background levels of naturally occurring organic
substances [23].
GAC adsorbers can be used as sand replacement filters,
or as post-filter adsorbers, as the particle size and
characteristics allow the GAC to be effective as a filter
The use of GAC for removing THM's from drinking water
is discussed in the literature. THM precursors are more
easily removed by GAC filter-adsorbers than are THM's
[17,23]. Clark, Lykins, and Adams [17] studied the GAC
removal efficiencies for THM's, total organic carbon (TOC),
and total organic halide (TOX). They found that GAC was
somewhat effective at removing all three parameters, but
that the useful bed-life for GAC filter-adsorbers for THM
removal was too short for most locations tested. Thissuggests that GAC filter-adsorbers are more effectively
used for taste and odor control or for the removal of
specific SOC's. This is in agreement with the findings of
Graese, et al. [31], who said GAC filters do not work well
for the removal of THM's, volatile organics, or fractions
of TOC. The literature discusses competitive adsorption
and the affinity of GAC for different compounds [7,23,31],
but such information is beyond the scope of this paper.
More to the point, however, is the fact that GAC
filter-adsorbers have been shown to be effective in
reaching complete nitrification in the beds [46], and
removing TOC from the water [5,19,22,31,40,46,48]. This is
effective adsorbent also make GAC a very favorable medium
for microbial colonization. The surface characteristics,
such as macropores, crevices, and crags allow for easy
attachment and provide shielding from the shear forces of
the water [50]. The functional groups on the GAC that
adsorb biodegradable organics provide a means of supporting
a biofilm that is thereby not totally dependent on the flow
of water for its nutrient supply [7,10,13,18,22,26,50].
The functional groups can even provide attachment sites for
the bacteria [38]. The surface ionic charges can also
enrich the oxygen concentration available for microbial
growth [18,50]. Some researchers have suggested that the
substrate available is enhanced by less biodegradable
materials that adsorb, thus making them available for an
extended period for bacterial action [7,18,22,40,51], but
Van Der Kooij [47,48] debates this point. Biodegradation
of all compounds that are biodegradable is certain to occur
to some extent in biologically active GAC filters.
Together, there are enough factors to make colonization of
GAC filter-adsorbers inevitable and to consider a GAC
filter-adsorber as anything other than a biological
process, even in the laboratory, would be an inadequate
being scattered and clumped [11,19,20,51], but others have
reported the growth as uniform [16,44]. This debate will
be further considered in a later section on microscopy.
The attachment of microbes to the GAC can be either
"reversible", in which the organisms can be washed off or
motile, or "irreversible" through adhesive extracellular
polymers [18,22,38]. Den Blanken [19] used scanning
electron microscopy (SEM) to determine that attachment was
by a stalk, flagellae, polysaccharides, or threads of
polysaccharides.
The affinity of GAC filter-adsorbers for establishing
microbial populations in a drinking water treatment process
is considered to have both advantages and disadvantages.
The disadvantages are, firstly, that maintaining a
bacterial population in a drinking water treatment process
is not desirable. Potentially pathogenic organisms could
propagate in the GAC and "seed" the distribution system.
Microbial by-products could release compounds in the water
that were not present in the source water [10]. The
metabolic activity of the organisms exerts an oxygen demand
on the water [18,48]. Den Blanken [20] reported that
to taste and odor in waters low in oxygen prior to
filtration. Another disadvantage of excessive growth on
GAC as a filter media is the resulting hydro-dynamic
headless shortening the time in service of the filter
between backwashes.
The advantage of having a biological treatment process
in conventional water treatment plants is that
biodegradable organic chemicals and nitrogenous compounds
can be converted or removed from the water [7,46,48].
Having a process to reduce the biodegradable compounds at
the water treatment plant diminishes the likelihood of
regrowth of microbes in the distribution system [7,31,48].
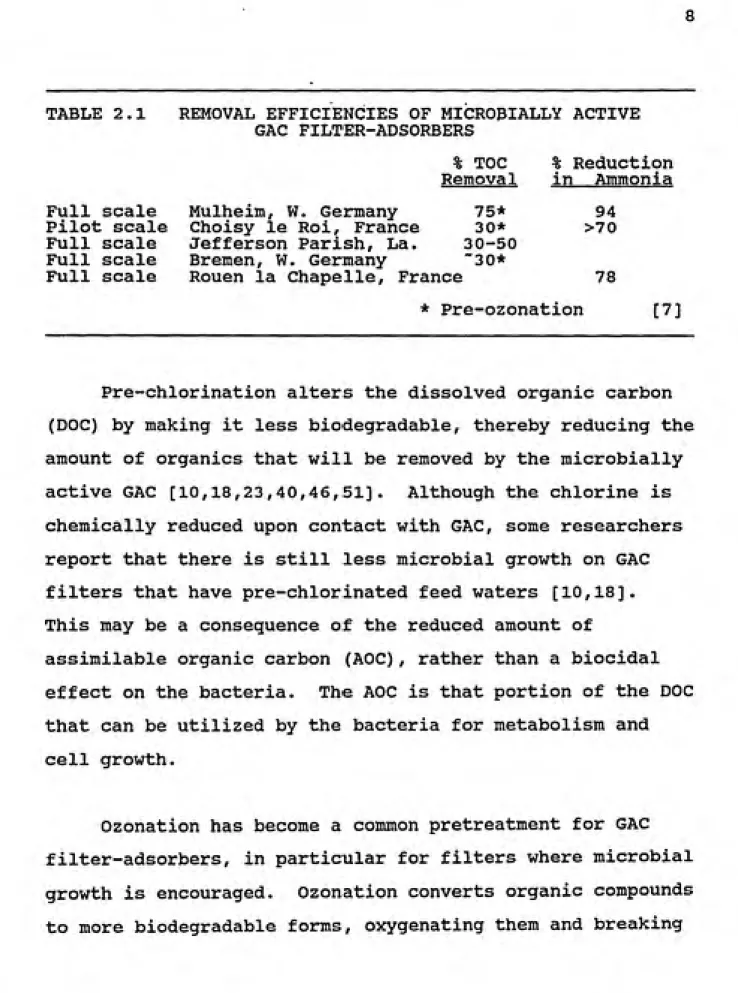
Bouwer and Crowe [7] assembled the information in
Table 2.1 regarding the efficiency of microbially populated
GAC filters in removing TOC and ammonia.
2.3 Effects of Pretreatment on GAC Filter-Adsorbers
Removal efficiencies and microbial activity in GAC
filter-adsorbers are affected by the pretreatment steps.
This is due to the fact that pretreatment alters the
TABLE 2.1 REMOVAL EFFICIENCIES OF MICROBIALLY ACTIVE
GAC FILTER-ADSORBERS
% TOC % Reduction Removal in Ammonia
Full scale Mulheim, W. Germany 75* 94
Pilot scale Choisy le Roi, France 30* >70
Full scale Jefferson Parish, La. 30-50Full scale Bremen, W. Germany '30*
Full scale Rouen la Chapelle, France 78
* Pre-ozonation [7]
Pre-chlorination alters the dissolved organic carbon
(DOC) by making it less biodegradable, thereby reducing the
amount of organics that will be removed by the microbially
active GAC [10,18,23,40,46,51]. Although the chlorine is
chemically reduced upon contact with GAC, some researchers
report that there is still less microbial growth on GAC
filters that have pre-chlorinated feed waters [10,18].
This may be a consequence of the reduced amount of
assimilable organic carbon (AOC), rather than a biocidal
effect on the bacteria. The AOC is that portion of the DOC
that can be utilized by the bacteria for metabolism and
cell growth.
Ozonation has become a common pretreatment for GAC
filter-adsorbers, in particular for filters where microbial
[21,32], and thereby increases the colony counts in the GAC
[48].
It has been found, concerning pretreatment, that the
effects of pretreatment on the microbial population do not
extend to altering the predominant genera found, favoring
one type of microbe over another [9]. This finding has
important implications regarding the potential health
threat of microbes on GAC filter-adsorbers in water
treatment.
2.4 Biological Activated Carbon and Bioregeneration in GAC
Filter-Adsorbers
The literature suggests that microbes proliferate on
GAC filter-adsorbers, contribute to the removal processes,
and growth can be enhanced with pre-ozonation.
Collectively, these effects can make GAC effective as a
biological process. In fact, this is a scheme practiced in
Europe and being explored in the U.S.A.. The process is
referred to as "Biological Activated Carbon" (BAG).
Proponents have also claimed that the process of microbes
process is called "bioregeneration" [7,22,23,40].
The concept of BAG developed as GAC beds were observed
surpassing expected levels of AOC removal and the point at
which breakthrough occurred and the bed was exhausted was
not being reached [7,18,22,23,40]. Biodegradation of TOC
is reported to happen in slow sand filters, but at a slower
rate and less effectively than on GAC beds [18,22,40]. In
GAC beds, the combination of adsorption with microbial
scouring is credited for the additional organics removal.
The combination is theorized to adsorb less biodegradable
substrates, allowing the microbes a longer contact time to
metabolize these substrates [7,18,19,51]. DiGiano [22,23]
points out that the more biodegradable materials are
removed by the biofilm, the more sites will be free for
adsorption of non-biodegradable materials. He quotes
removal rates for microbially active GAC of 3 0% of the TOC
[23], and 2 to 4 grams of TOC/cu m GAC/hour [22].
Bancroft, et al. [5] state that 24% of the TOC removed in a
biologically active GAC filter-adsorber is due to microbial
uptake.
Some of the benefits of BAC as a process, other than
increased removal of TOC, are:
* toxic contaminants would be adsorbed before
significantly reducing the beneficial microbial
population, and any peaks in pollutant concentration
would be lessened [20,46]
* as a process BAC is easy to maintain, (it occurs
naturally, even unavoidably), and cost effective
[7,40]
* as a biological process, BAC reduces or removes that
portion of the TOC that is biodegradable in the
water plant, which;
1) decreases the THM formation potential
2) decreases the chlorine demand of the finished
water3) lessens the taste and odor associated with
chlorination
4) provides a more stable residual in the
distribution system [32,49]
* BAC regenerates the GAC to some extent and increases
the life of the GAC [7,22,23,40]
The concept of BAC and particularly bioregeneration,
defined earlier, has its detractors [18,43,48]. Some of
the reasons given for skepticism are:
* biodegradation occurs much more slowly than does
adsorption [18,22]
* increased population on the carbon must reduce the
adsorptive capacity of the GAC [22]
* adsorbed compounds may not be available to attached
microbes [47]
* exhausted GAC showed no increase in capacity when
populated with microbes [47]
* GAC does not show an increase in microbial growth
over sand or non-activated carbon that is not
Even with these considerations, however, none of the
authors disputes that biodegradation is occurring in
populated filters. The question is more a matter of the
extent to which this contributes to overall removal of the
TOC and whether bed life is really extended.
The centrist's position is the most tenable.
Biodegradation would take place and contribute to TOC
removal. This is supported in the results of this specific
study, which are presented later in this paper. Populated
GAC filter-adsorbers would be expected to last longer
before regeneration would be required, however not enough
to leave a bed in place indefinitely. The amount of
removal of compounds or parameters and the time required
before regeneration must be evaluated on a case by case
basis dependent on the objectives which first required GAC
treatment and the specific characteristics of the water to
be treated.
2.5 Implications of Microbial Growth on GAC
The implications of having a microbial process
existing and even encouraged in the treatment of drinking
are immediately obvious. A great deal of trouble and
expense are taken to remove viable organisms from drinking
benefits from having a biological process such as
microbially active GAC do not change the concerns of
ingestion of microbes. Therefore, it is natural in a study
of microbial activity on GAC to consider which organisms
grow, the effects of the GAC filter-adsorber on the growth
of the organisms and the product water, and the resulting
health considerations.
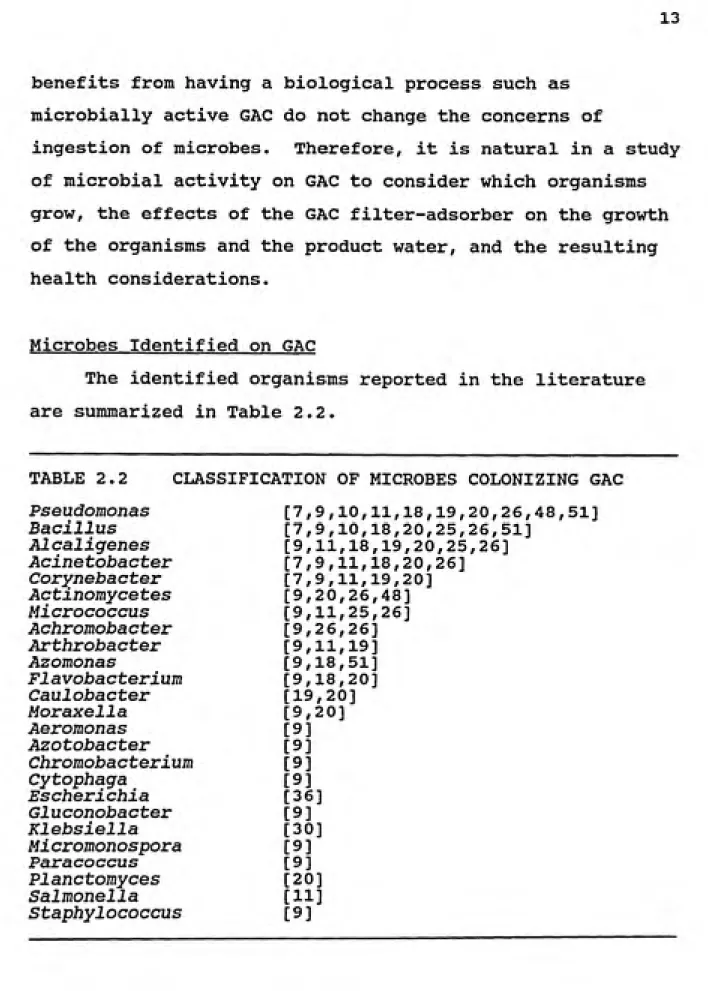
Microbes Identified on GAC
The identified organisms reported in the literature
are summarized in Table 2.2.
TABLE 2.2 CLASSIFICATION OF MICROBES COLONIZING GAC
Burlingame, et al. [9] reported that the predominant
bacteria, which are among the first listed in Table 2.2,
account for 86% of the bacteria isolated; this is said
to fluctuate seasonally, with the greatest variety in the
summer and in the winter some 90% of the genera identified
belonging to the Pseudomonas and Flavobacterium. Several
different genera were reported as the most predominant on
GAC, but Pseudomonas was clearly the most often cited.
The microbes identified were mostly indigenous water
and soil saprophytic chemo-organotrophs [7,10,25,26,30],
and mostly gram negative [10,26,48]. Some fungi and
filamentous organisms were found [9,20,22,48], as well as a
few higher organisms such as protozoans [48].
In the literature there is much discussion about the
prevalence in the GAC and in GAC filter-adsorber effluents
of members of the family Enterobacteriaceae, especially
of the Coliform Group of bacteria. The importance of this
group in the water industry as an indicator of fecal
contamination prompts this attention. Research has shown
in study after study that coliform organisms do not
proliferate in GAC columns and in fact may die off when
introduced to the columns [8,9,10,19,20,25,26,46,48,51].
This is suggested to be a result of the comparatively harsh
the intestinal tract of a warm-blooded animal, particularly
in regard to temperature. Geldreich [29] found that the
number of coliform organisms breaking through were related
to the location of the GAC filter-adsorber in the treatment
scheme and not to the propagation in the filter bed.
Camper, LeChevallier, Broadaway and McFeters [11,13,36,39]
have in fact found coliform organisms in GAC filter
applications and on GAC particles in the distribution
system, but not in a high growth phase.
There appeared to be some connection, both in the
literature and in this study, between coliform organisms
and source water. Qualitatively, it seems the occurrence
of species in GAC filter columns and product waters is
related to their existence in the feed water for the units.
In situations where the water is conventionally treated and
disinfected prior to the filter-adsorber units, the variety
of species would tend to be limited compared to GAC units
treating urban river water with little pretreatment.
Effects of GAC Filtration on Microbes
Contradictory evidence is reported on the effect of
GAC filtration on microbial constitution of the water.
Authors report removal of organisms by filters
reductions as a consequence of GAC filtration:
Pseudomonas 75%Actinomycetes 55%
Total coliform 80%-90% [48]
and Brewer and Carmichael [8] report reductions of:
Enteric bacteria 75% Fungi 20%
Colony Forming Units (CFU) 90% [8].
It should be noted that these reductions were achieved for
river water that had not been pre-oxidized, and therefore
the numbers in the source water were probably high to begin
with. This should not be interpreted to mean that GAC
filters reduce the concentration of organisms in GAC filter
product waters in typical applications where the content in
the source water is not greatly elevated. In fact, the
growth activity of these microbes, together with the
shearing force of the water passing through the filter,
result in a significant occurrence of microorganisms in the
filtrate, or product water of the filter [7,18,22,27,31].
There is a wide range of reported values in the literature,
but some of this variation is due to the different
techniques and conditions used by the researchers. Table
2.3 summarizes the concentrations of colony forming units
(CFU's) in GAC filtrates. The number of microbes in the
product waters are clearly a result of the colonization of
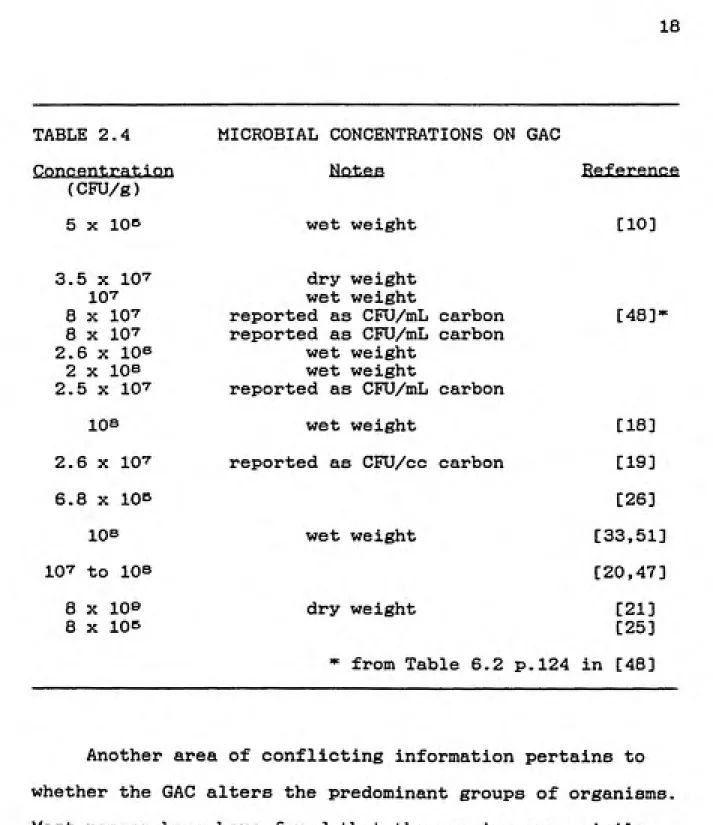
the GAC filter-adsorbers. Similar studies report values
for CFU/gram GAC and some of these values are presented in
TABLE 2.3 MI
Concentration (CFU/mL)
3.'7 X 10^
103 to 10^ 3 5 3 6 6 X 10^ X 10^ X 104 105 X 10^ X 10^ 103 to 10^
10^ to 10^
10^
to 10^
to 10^103 to 10^ 5 X 10⁴
4 X 10^
1.1 X 10^
MICROBIAL CONCENTRATIONS IN THE PRODUCT WATER OF GAC FILTER-ADSORBERS
Notes Reference
Pre-ozonation [46]
After 5 weeks level dropped [10]
Max. # reported by Schultink Max. # reported by Klotz et al
Max. # reported by Van Der Kooij [48]
Max. # reported by Van Der KooijMax. # reported by McElhaney et al
Max. # reported by Den Blanken
10-^ levels were low outliers [19]
Pre-ozonated # higher than non-ozone [9]
Fluctuated seasonally [33]Related study [33]
Bench-scale [20]
Full-scale [51]
[47] Pilot-plant [25]
TABLE 2.4
Concentration
(CFU/g) 5 X lOe
3.5 X lO'^ 10'7 8 X 10'7 8 X lO^^ 2.6 X 10⁶
2 X IQB 2.5 X 10"^
108
2.6 X 10"^
6.8 X lOe
lOe
107 to 108
8 X lOe 8 X lOB
MICROBIAL CONCENTRATIONS ON GAC
H^2t££ Reference
wet weight
dry weight wet weight
reported as CFU/mL carbon
reported as CFU/mL carbon
wet weight
wet weight
reported as CFU/mL carbon
wet weight
reported as CFU/cc carbon
wet weight [10] [48] = [18] [19] [26] [33,51] [20,47] [21] [25] dry weight
* from Table 6.2 p.124 in [48]
Another area of conflicting information pertains to
whether the GAC alters the predominant groups of organisms.
Most researchers have found that the species were similar
in the filter bed and product water to species found in the
source water [9,25,27]. Werner, et al. [51], however,
presented data that showed the concentration of Pseudomonas
increased from 55% to 80% through the filter, concluding
Health Considerations
The primary organisms identified in Table 2 are generally not considered threats to human health or pathogens. Therefore, many authors do not consider GAC
filter-adsorbers to be a health concern in properly operated water treatment plants with adequate
post-disinfection [19,27,51]. Some of the organisms identified
are considered "opportunistic pathogens", or organisms that could pose a threat to hosts rendered susceptible. This is
considered a health concern [10,18,25,30,31]. Such
opportunistic bacteria include species of Klebsiella,
Flavobacterium, Pseudomonas, and Moraxella [10,30,52].
McFeters, et al. [39] did demonstrate that pathogens were capable of colonizing GAC filters. Studies suggest that pathogenic bacteria have trouble competing with the better
adapted general soil and water bacteria, due to
environmental factors such as substrate limitation and
temperature [7,34,48]. High plate counts inhibit pathogen colonization, competing for nutrients and space and
producing inhibitory metabolites [13,34].
Endotoxins and other soluble microbial products
2.6 Effects of Operational Variables on Microbes in GAC
Filter-Adsorbers
Factors affecting the attachment and growth of
microorganisms on the GAC filter-adsorbers are presented in
Table 2.3.TABLE 2.5 FACTORS AFFECTING MICROBIAL ACTIVITY IN GAC
FILTER-ADSORBERS
- temperature of the water [18,19,20,23,3 3,48,51]
- dissolved oxygen concentration [7]
(note:pre-ozonation has a significant effect on this
parameter)
- TOC & AOC [7,18,20,51]
- micropollutant concentration [7]
- pH [7]
- presence of toxins and inhibiting substances [7,51]
- application rate [10,12,18,19,20,33,47,48,51]
- frequency of backwashing the filter [18,19,20,31,33,48]
- pretreatment of the source water [31,48]
- bed depth [25,26,31,32,48,51]
- time in service [19,48]
- type and concentration of bacteria
in the source water [18]
The type of activated carbon used did not make a
difference in the microbial population [20,33].
The application rate is an important factor according
to most authors, as Table 2.5 demonstrates. The shear
forces of the water as well as the time of exposure to the
substrate are the main reasons cited. Increased empty bed
contact time (EBCT) is reported to result in higher rates
breakthrough of microorganisms in the filtrate, as the
hydrodynamic shear is less [18,33,47,48], but others say
the higher growth will release more microorganisms
[10,12,48,51]. Backwashing of the GAC filter beds has a
more unanimously agreed on effect. Backwashing reduces the
number of microbes both on the GAC and in the product
water, but only for a short period of time
[18,19,20,31,33,48].
2.7 Disinfection Considerations
The persistence of microbes in GAC filter-adsorber
filtrates has made post-disinfection a matter of greater
importance. GAC filter-adsorbers is usually the last
treatment step before disinfection. Thus, the release of
microbes and opportunistic pathogens that are sloughed off
the GAC or colonized on particles is a matter of concern
[39,40,48].
Chlorination of finished water at typical doses with
sufficient contact time is effective in disinfection[31,33,52]. Wolfe, et al. [52] reported 99% of
heterotrophic plate count bacteria were killed in the first
minute of exposure to < 1.3 mg/L free chlorine. The
problem is that not all of the bacteria and microbes are
such as pipe walls, particulate matter, sediment in the
lines, or biological debris have a much greater ability to
resist disinfection [30,31,35,36,37,39,45]. LeChevallier
[37,45] reported that Klebsiella pneumoniae attached to a
glass surface had survival rates 150 fold over unattached
organisms. He also reported that iron pipes provide a more
resistant environment for microbes than other types of
pipes [35].
GAC, with its rough, porous surface and chlorine
reducing properties, make attached microorganisms very
resistant to disinfection [12,31,36]. LeChevallier, et al.
[36] said, "...bacteria attached to activated carbon
particles were able to completely survive conditions
normally encountered in chlorine disinfection during the
treatment of drinking water." LeChevallier, Camper,
Broadaway, and McFeters did several studies regarding
microbial survival on GAC particles. Some of their
findings and a related finding include:
* Bacteria attached to GAC particles were very resistant to 2.0 mg/L chlorine even after 1 hour
[39]
* biofilms grown on GAC particles were 3000-fold
more resistant to disinfection by chlorination [37]
* when pathogens were colonized on GAC and exposed to
chlorination, all survived to differing degrees,
* Flavobacterium were found to be highly chlorine
tolerant [52]
* over time the surface organisms on GAC particles
received sublethal injuries when disinfected [36] * Klebsiella survived well even at chlorine dosages of 2 mg/L [30]* resistance increases with the age of the biofilm, the poorer the nutrient concentration when the microbes are cultured, and with microbes forming extracellular "capsules" [37]
A problem discussed previously is the possibility that microorganisms surviving the disinfection barrier will
populate the distribution system with "regrowth". Although
Miller and Rice [40] stated that small quantities of chlorine, 0.5 mg/L and less, can adequately protect GAC
filtered finish water, most evidence points to regrowth as
a serious threat [48]. Klebsiella can survive in the distribution system and even propagate if the chlorine
levels are not high [15]. Microbes can reportedly reach
levels of 10^ to 10° in the distribution system in the
absence of chlorine [36]. Injured cells were found not only to recover, but, after a lag phase, to grow at the same exponential rate as uninjured cells [15]. This
concern is especially related to the possibility that
populated GAC particles, or "fines", break free of the
2.8 Escape of Carbon Fines Into GAC Filter-Adsorber
Product Water
Through shear forces in the GAC filter-adsorber bed and attrition of the carbon, particles are released
[12,31]. In colonized filter beds, these particles would
be expected to be supporting microorganisms [11,36,37,39].
Montana State University at Bozeman, Montana has done a great deal of research investigating this phenomenon. Those most closely associated with that research are
Camper, LeChevallier, and McFeters. These are the major
findings of that research:
* Populated carbon fines are not realized as a threat by standard plate count analysis, as a colonized
particle would only be counted as one CFU. [11]
* 40% Of the samples from in-line GAC filters had particles that were colonized, and 17% had coliform
colonies, of which 28% exhibited a fecal biotype.
[11]
* Fines were released at all intervals through the filter run and not concentrated at the end of a run
or just after filter backwash. [11] * GAC has a greater release rate of populated fines
than sand and non-activated carbon; GAC age was not a factor in release of fines, but increased bed
depth, increased application rate, and increased applied turbidity were factors contributing to the
release of fines. [12]
* Chlorinated heterotrophic plate count organisms,
coliform organisms, and pathogens grown on GAC
particles were able to withstand 2.0 mg/L chlorine
for 1 hour with no decrease in viable cell count.
This evidence makes it clear that carbon fines warrant more
study. In these studies the carbon fines were captured by
using a modified Swinnex ® filter cartridge filled with
multi-layer gauze as a trap. Captured particles were
removed for further study by hand shaking the filter in a
solution [11,12]. This method could prove inadequate in
capture and recovery efficiency due to fines passing
through the gauze, fines lost in the transfer of the gauze
to the fleaker, fines still in the gauze trapped by the
tortuous nature of the gauze, or fines recaptured by the
gauze as it is removed for disposal. The number of
rinsings of the gauze were not specified as being greater
than a single rinsing in the published work [11].
2.9 Summary of Microbial Activity on GAC Filter-Adsorbers
This chapter has reviewed the occurrence and
implications of microbial activity on GAC. GAC is coming
into wider use in the water treatment industry as an
adsorbent and as a filter material, fulfilling a dual role.
Applications have found that another role is performed as a
natural consequence - that of a biological reactor. GAC as
a water filter provides an optimum growth environment for
microorganisms, with moisture, nutrients, amenable
filter-adsorber. The population of GAC filters may assist
in the biodegradation of organic compounds, but some of the
microbes that grow are opportunistic pathogens and a reason
3.1 Description of the Pilot Plant
The pilot plant units were constructed and furnished
by Camp, Dresser, and McKee, Inc. consulting engineers.
The major components were shipped unassembled to the
Franklin Water Treatment Plant in Charlotte, North
Carolina.
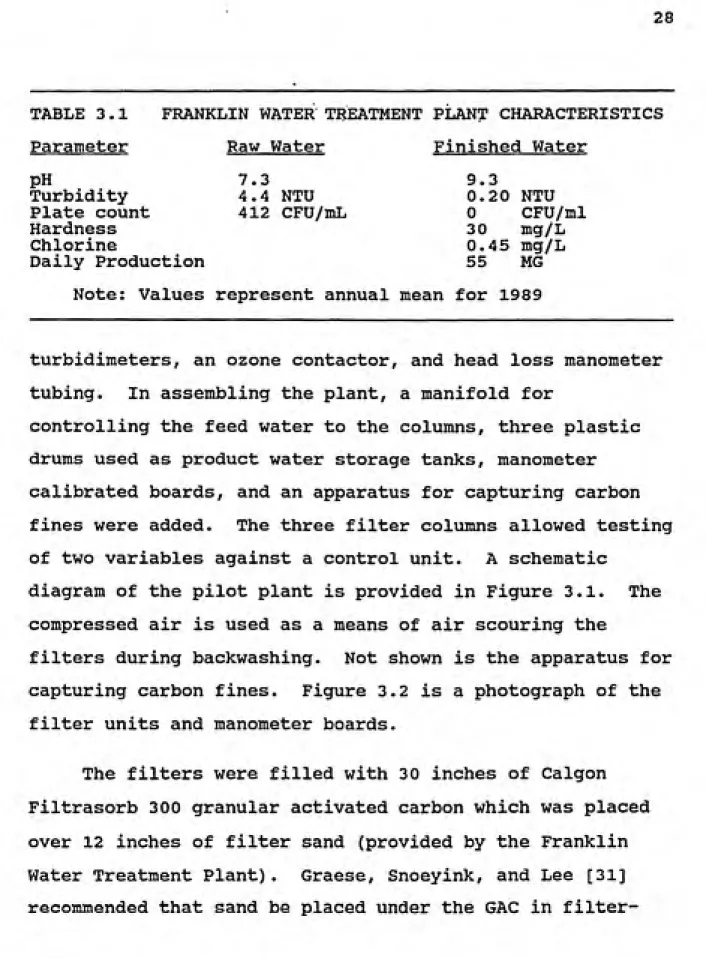
The Franklin Water Treatment Plant is one of Charlotte
Mecklenburg Utility District's (CMUD's) water production
facilities. Lake Norman provides a stable, high quality
surface water source for the City of Charlotte, North Carolina. Specific information about the Franklin
Water Treatment Plant is presented in Table 3.1. The inlet
water receives pre-chlorination to provide a residual of
0.8 to 1.2 mg/L, and is treated by alum coagulation,
flocculation, and sedimentation prior to the pilot plant
intake.
The main components of the pilot plant include three
filter columns, (each being 11 feet in height and 4 inches
TABLE 3.1 FRANKLIN WATER TREATMENT PLANT CHARACTERISTICS Parameter Raw Water Finished Water
pH 7.3 9.3
Turbidity 4.4 NTU 0.20 NTU
Plate count 412 CFU/mL 0 CFU/ml Hardness 3 0 mg/L Chlorine 0.45 mg/L Daily Production 55 MG
Note: Values represent annual mean for 1989
turbidimeters, an ozone contactor, and head loss manometer
tubing. In assembling the plant, a manifold forcontrolling the feed water to the columns, three plastic
drums used as product water storage tanks, manometer
calibrated boards, and an apparatus for capturing carbon
fines were added. The three filter columns allowed testing
of two variables against a control unit. A schematic
diagram of the pilot plant is provided in Figure 3.1. The
compressed air is used as a means of air scouring thefilters during backwashing. Not shown is the apparatus for
capturing carbon fines. Figure 3.2 is a photograph of the
filter units and manometer boards.filter-FIGURE 3.1 SCHEMATIC OF PILOT PLANT OPERATION
Overflow
to Waste
Manifold
Compressed
/ Clear \
Well )
Backwash Line
To Waste
I Well ]
Backwash Line
To Waste
Clear
Well
//I
Backwash Line
Layout of Pilot Filters at CMUD.
adsorbers as added protection against breakthrough of floe particles. The head on the filters was constant and the
application rate was determined by the pump setting. The
filter columns are constructed of ExcellonvS 4000 polyvinyl
chloride.
3.2 Total Organic Carbon Measurements
The analytical work for the parameter "total organic
carbon" (TOC) was done by James Moore, graduate research
assistant in the Department of Environmental Sciences and Engineering at the University of North Carolina, Chapel Hill, and will be discussed in detail in a separate report.
TOC was measured with an O.I. Model 700 Total Organic
Carbon Analyzer (O.I. Corp., College Station, Texas).
3.3 Microbial Enumeration
RoA Plate Count
The standard plate count method has been an accepted method for determining bacterial density in liquid samples
for some time. Cairo, et al. [10] noted that, "The
standard plate count test, which measures the total
bacterial population, may be the best indicator available
today for measuring the GAC effluent for microbial
nutrient agar and the assumption is made that each viable organism will yield one countable colony.. However, the trypticase soy agar and the standard incubation temperature
of 35°C and time of 48 hours has been found to exclude the
growth of many soil and water bacteria [10,25,48].
Research has shown the optimum agar, incubation temperature
and time of incubation to be R2A agar at 27 or 28°C for 7
days [9,10,14,33,39,51,52]. Werner, et al. [51] found a99.8% increase in CFU/mL with this modification.
R2A agar (BBL Media, Baxter Scientific, McGaw Park,
II.), was selected for this research. One particular
advantage of this media and method is that injured and slow growing bacteria are allowed a longer period of time in a
less nutrient-rich growth medium. Incubation was for 7 days in the dark at room temperature, which stayed between
26 and 27'-'c. Serial dilutions were carried out in sterile
buffered dilution water vials, and plating was by the pour plate method. All plating done at the University of North Carolina was in triplicate with full quality control.
Plating of the product water of the filters conducted by
the staff at the Franklin Water Treatment Plant was in
Acridine Orange Direct Count
Acridine Orange Direct Count (AODC) was used as a
means of confirming the magnitude of bacterial density recorded with the plate counts. The procedure involved
collecting samples in sterile 20 mL pierce vials and
preserving them with filtered formalin at a concentration of 2%. Aliquots were stained with 0.01% Acridine Orange and filtered through Irgalin Black soaked 0.22 um Nuclepore
filters. The filters were then examined at 1250x
magnification with a Leitz Ortholux II epifluorescent microscope equipped with a mercury source. The stained cells fluoresced and were counted in at least 10 fields per
sample [24].
Total Coliform
Total coliform testing was conducted using the
membrane filter technique (Standard Method 909A [2]) with
M-Endo medium (BEL Media, Baxter Scientific, McGaw Park,
II). Samples were plated in duplicate with positive and
negative controls. Incubation was at 35°C for 24 hours.
One hundred mL of each sample was used and dilutions werenot required.
3.4 Extraction of Microbes from the GAC
granules, a procedure was needed to detach those microbes
for enumeration without injuring them. A number of
approaches have been employed, with many relevant studies having addressed this issue for soil microbes. The methods typically consist of suspending the sample in a buffered
surfactant, sonicating or blending to homogenize,
deaggregate, and release the microbes, followed by
centrifuging to separate the cells from the support
material [3,4,6,9,11,14,20,21,25,33,36] One study utilized
a tissue grinder for homogenizing the sample, but the
results were low compared to other similar studies [4].
The basis for the procedure used in this study was
developed by Dobbins and Pfaender [24] as a modification of
Balkwill's [6] work with soil. The procedure uses an 0.1%
(w/v) polyvinyl pyrrolidone (PVP)/ 1.0% (w/v) sodium
pyrophosphate (PPi) buffered solution in combination with sample agitation to detach the microorganisms. PVP-360
(average molecular weight of 360,000, Sigma Chemical, St.
Louis, Mo.) and sodium pyrophosphate (Na2P2O7-10H2O,
Aldrich Chemical, Milwaukee, Wi.) solution acts as a
buffered surfactant/deflocculating agent that facilitates
the release of microbes by:
1) removing the binding materials, 2) negating surface charges,
3) protecting the cells, and
4) allowing the shear forces to be more effective.
DeWaters [21] did extensive methods development research
for applying this process to removal of microorganisms from
GAC and recommended a PVP/PPi concentration of 0.1%/1.0%,
a 30 minute shaking time, and 121 x g for centrifuging.
A number of previous studies used zwittergent as a
primary desorbing chemical for GAC [11,14,36,39], but
DeWaters [21] found zwittergent to have a greater toxic
effect on the recovered microbes than PVP/PPi. Sonication
was found by some authors to disrupt the cells, and
blending was recommended [9,14], but their samples were sonicated for 30 minutes and 9 minutes, as opposed to one minute. DeWaters [21] found that sonicating for one minute
released more cells than blending. Sonication also allowed
the extraction of the carbon without having to change
containers, which would require rinses and would subject
the samples to loss and contamination factors.
Using this method, GAC samples were removed from the
filter-adsorbers through sample ports and collected in
sterile LPE bottles. The samples were kept at 4°C for less
than 24 hours, at which point the samples were hand shaken20 times to remove loose cells and decanted. The GAC was
then aseptically drained on sterile paper and 1 gram of GAC
was weighed directly into sterile 250 mL polycarbonate
drained, weighed, dried,- and weighed again for "dry weight"
determination. A sterile, chilled, 80 mL. aliquot of
particle free PVP/PPi solution (0.1%/1.0%) was added to
suspend the GAC for extraction.
For extraction, the suspended GAC was subjected to two
30 second bursts of sonication at 35 watts, separated by a
30 second rest period, and followed by 30 minutes of
shaking at 180 RPM. Both of these steps were carried out
with the samples in an ice bath. The sonicator used was an
Ultra-tip Labsonic System No.9100 equipped with a microtip,
and the shaker was a Lab-Line Instruments Jr. Orbital
Shaker. The samples were centrifuged at 121 x g in a
Sorvall RC-2 refrigerated centrifuge for 15 minutes at 4°C
to separate the desorbed cells from the carbon particles,
and the supernatant was decanted into a graduated sterile
LPE bottle for later analysis.
The GAC pellet was then re-suspended in another 80 mL
volume of the PVP/PPi solution and taken through the entire
removal procedure three more times for a total of four
washings. The combined, decanted, extracted solution was
then brought to a final volume of 400 mL with the PVP/PPi
solution. This suspension of recovered cells was analyzed
as representative of the microbial density on the GAC in
the filter-adsorbers.
No removal procedure is expected to recover 100% of the cells attached to GAC. In fact, recovering a large
percentage of microbes from GAC and soil has proved
challenging.
* Balkwill found that, using PPi, sonicating,
blending, and centrifuging with 14 rinses recovered
only 27% of the platable cells from soil. [4]
* Den Blanken found only 10% to 30% of attached
bacteria could be desorbed by washing. [20]
* DeWaters oftained recoveries from GAC of only 44% by
metabolic activity and 29% by AODC, estimating that
the combined extraction procedure recovered 50% of
the total cells. [21]
* Camper et al, however, reported recoveries of 80% to 90% for GAC particles using zwittergent with
blending and centrifugation. [11,14]
In summary, the extraction procedure is satisfactory for
estimating the relative microbial density of GAC particles,
but that care should be taken in interpreting the results.
3.5 Evaluation of the Carbon Fines
Collection of Fines
GAC filters have been documented to release small
carbon particles, or "fines", into the filtrate [11,12].
In an effort to obtain the maximum capture efficiency of
these particles, polycarbonate membrane filters (Nuclepore
Corporation, Pleasanton, Ca.) were tested. Preliminary
laboratory trials found that powdered activated carbon
by 12 um filters. The 5 um filter following a 12 um filter
was not noticeably shaded, implying the 12 um filter
captured essentially all of the PAC.
The success of the preliminary trials and the
feasibility of using filters to capture all particles led
to the use of the apparatus illustrated in Figure 3.3.
This unit takes water from the bottom of the "clear well"
or finished water reservoir and pumps it through two 293 mm
polycarbonate membrane filters in sequence at timed
intervals of 6 minutes every hour, returning the filtrate
to the top of the clear well. The clear well has a volume
of 55 gallons and the pump rate is approximately 10 gpm.
This procedure allows the water from the clear well to be
filtered for the removal of particles two to three times
during one hydraulic detention time, (138 min.), for that
reservoir. The pump is centrifugal with a bronze impeller.
The filter housings are stainless steel (Millipore
Corporation, Bedford, Ma.). The return filtrate is
introduced below the water surface in the clear well, which
keeps the filters immersed continually and provides some
mixing action in the clear well.
Removal Procedure
The 293 mm polycarbonate membrane filters were left in
FIGURE 3.3 APPARATUS FOR THE CAPTURE OF CARBON FINES
-ͣ ." -ͣ .»-;
ͣͣ
''ͣͣ
4^> Y
'y.
Z \ ^^\
Pu i"--|p
We 1 1
T i mer
Nuc I epore
5 m i cron Fi I ten
Nuc Iepor e
12 i\ i cron
__E_LI ten__
d i -Eipie t e r
were aseptically transferred to a sterile stainless steel
sheet 40 X 40 cm. The wet filters adhered to the sheet with no additional mounting procedure required. The sheet
was inclined into a sterile stainless steel pan 45 x 15 cm.
The edge of a sterile plastic disposable weigh dish was
used to scrape the filter as the filter was rinsed
repeatedly with sterile, chilled, particle free PVP/PPi
solution. Three rinses were conducted, with the combined
suspension of carbon fines in PVP/PPi brought to a final
volume of 200 mL. This sample was kept at 4°C until
analysis.This procedure is similar to that used by Ongerth, et
al. [42] to collect Giardia cysts. The polycarbonate
membrane filters lend themselves well to this procedure as
they are smooth surfaced and do not tend to trap particles
within them. The nature of the filter surface is
illustrated in Figure 3.4. The pore sizes of the filters
are uniform, and thus are recommended specifically for
particle or cell capture and for electron microscopy by
Nuclepore, the manufacturer. Tearing of the filters during
scraping was not a problem as the filters are flexible and
have a tensile strength of over 3000 psi. The filter
material is biocompatible and, coincidentally, coated with
FIGURE 3.4 PHOTO OF A POLYCARBONATE MEMBRANE FILTER 41 i « • • * « • « * • * • • « « • • • • t
i .
•
» *
•
Nuclepore Membrane
Evaluation of Fines
The carbon fine suspensions collected by the procedure
outlined in the last sections were evaluated in four ways
as illustrated in Figure 3.5 and described below:
SUSPENSION - The suspension of fines with attached bacteria was plated directly to evaluate gross bacterial density and to provide a point of comparison.
SUSP WITH CL2 - To test inactivation of attached
bacteria, the suspension was dosed
with 1.8 mg/L HOCl for 20 minutes with
gentle agitation, then dechlorinated with NapS^Oo and plated. This
provided data on survivability of the
attached microbes.
DETACHED - The suspended sample was sonicated, shaken, and centrifuged as in Section 3.4. The
plated results considered to represent the total microbial density of the suspension.
SOLIDS - A portion of the suspension was filtered
FIGURE 3.5 DIAGRAM OF THE CARBON FINE EVALUATION PROCEDURE
F i I ier- w i i h f' i ne
Fines reMoua.
procedur e
.-- -^ 1
<' \
... ;
''"—^'^'^ \
Fines in suspension
SUSPENSION
DIRECTLV
PLATED
/
SUSP.
+
1 .8 M9/L C I 2 FOR 20 run.
Na2B203 PLATED
1
ITElViCILEU
SOMlChTED
SHOOK
lENTRIFUC-ED PLATEL3
SOLID f:
3 SUSPENSIONFI LTERED
FT LTER DRIED AT
The total solids determined by this method could
be related to the volume of water passed through the filter. In order to separate the portion of the sample
that was GAC from the portion that was biological material
and other debris, an attempt was made at charring the
samples at 550°C and 800°C to volatize all biomass and
other volatile material. This proved to be an insensitive gravimetric method as the total mass of carbon weighed solittle that any contamination rendered the results
meaningless.
3.6 Scanning Electron Microscopy
A sample of the GAC from the filter bed, a sample of a carbon fine membrane filter, and two control samples were examined by scanning electron microscopy (SEM). The
samples were prepared by the Pathology Department at North
Carolina Memorial Hospital, Chapel Hill, NC., which has experience in preparing biofilms on GAC for SEM. The samples were fixed in a buffer solution, dehydrated in
graded ethanol, mounted on aluminum stubs, taken to
critical point with CO2 and gold coated. Analysis was by
a Cambridge Stereoscan ® 200 SEM with an acceleration
Weber and Pirbazari [50] have suggested SEM as a
useful technique for observing biofilms on GAC because
of the magnification, resolution, and three dimensional
imaging. The best method of fixation has been debated by
many authors, [1,16,44] but there is agreement that themethod employed in this study, when properly interpreted,
is helpful in assessing the nature and extent of
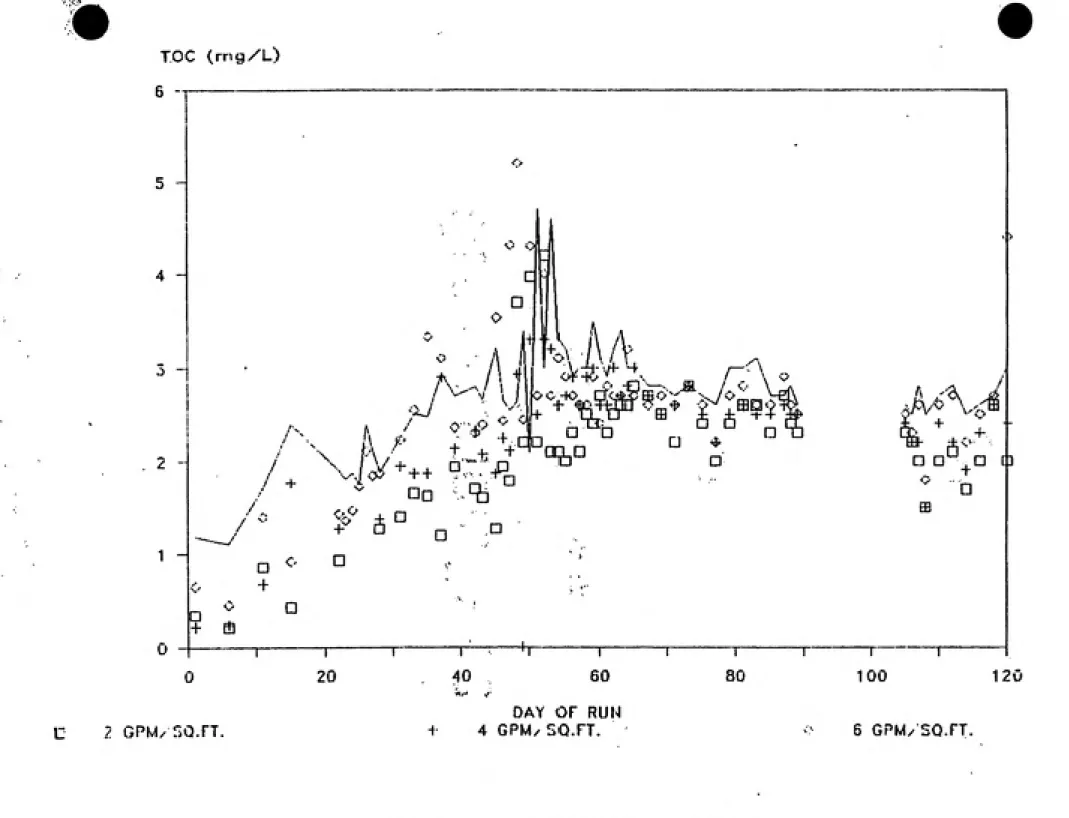
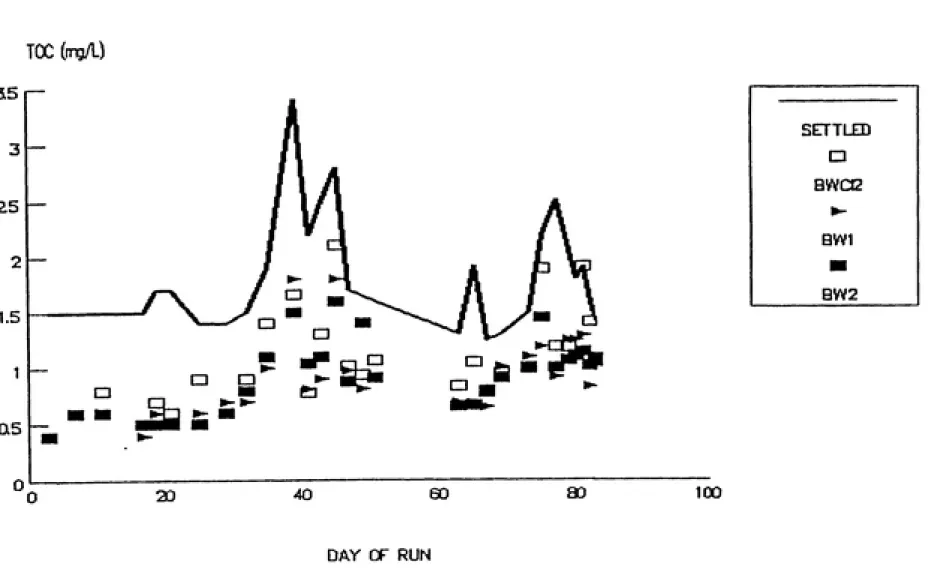
4.1 Evidence of Microbial Growth
This project was divided into several experimental "runs", each testing a set of parameters or operational variables. Total organic carbon (TOC) was measured in the source water for the pilot plant and in the product water from each unit. The results are depicted graphically in
Figures 4.1 and 4.2. The figure legends will be explained
in the discussion of Run 1 and Run 2 that follows. The
solid line in these figures represents the TOC level in the source water to the pilot plant (Franklin Water Treatment
Plant settled water). The plotted points on both figures
represent the TOC levels in the product water from the GAC filter-adsorbers. The influent levels vary through each run, ranging from 1 to 5 mg/L and affecting concentrations in the product water. It is still clear that consistent TOC removal is taking place. In both runs, after bed
5
1
-U
-+-ͤ
+
'U i\
' %kA r
C -hi' O'^ii:^ ffl <>^' -X / O
° ° n *
no 4j
D
n
a n
n
20 40 60 80
sA/-...•ͣ<x
,fi
D D a io
n
ffi
1 00 120
2 GPM/ fiOTT.
DAY OF RUN
4 GPM/ SQ.FT. 5 GPM/ SQ.FT.
3
25
2
1.5
a5
--
^&-s" ?^
ͤSETTLED
ͤ
BWCC
^-BW1
BW2
0
0 20 40 60
ao 100
DAY OF RUN
to be due to biodegradation taking place in the GAC filter
beds, as the microbes utilize those organic carbon
substances that can be metabolized for cell growth. TOC is
reportedly a good parameter for measuring biodegradation [23]. This data confirms previous BAG studies regarding
the contribution of biological activity to the removal of
organic substrates and to the extension of bed life, but does not address the ability of the carbon to
bio-regenerate.
For a gross estimation of the biomass that could be
produced from the TOC degraded, a calculation can be made.
Assume that the continued removal of 0.5 mg/L TOC in the
GAC filter-adsorbers after breakthrough occurrs is due to
utilization by microorganisms for cell growth. DeWaters
[21] obtained microbial yield coefficients for phenol and
reported literature values for phenol and other organic
substrates in the range of 0.5 (mass of cells produced/mass of substrate consumed). Gaudy and Gaudy [28] give a
conversion factor of average cell dry weight of
-16 . . .
2 X 10 mg/cell. Using these estimations:
(^TOC)(Y)= X and X/Wc = cells/L
where Y = microbial yield coefficient (mg cells/mg TOC)
X = concentration of cells (mg/L)or
0.25mg/L cell mass
(0.5mg/L TOC) (0.5)= ---zTo--- = 1-25 X 10^ cells/L
2 X 10 mg/cell
This estimation suggests that at steady-state, 0.5 mg/L TOC removal by bio-utilization would result in a production of
about 10^ CFU/mL. It is clear from this estimate that GAC
filter-adsorbers have the potential to support extensive
microbial populations.
4.2 Effect of Application Rate on Microbial Activity
-Run 1
In the first experimental run in this study, the
effect of application rate on microbial activity was
tested. The three filters were run at rates of 2, 4, and 6
gpm/sq ft, which gave EBCT's of 11, 5.6, and 3.7 minutes,
respectively. The product water was sampled just after the
underdrain and plated immediately by the Charlotte
Mecklinburg Utility District (CMUD) staff in the Franklin
Water Treatment Plant Laboratory. Run number 1 lasted 122days. The results are presented in Figures 4.3a and 4.3b.
The effect of application rate on the plate counts
160
120
80
-40 r
0
7 22 27 29 38 43 45 49
DAY OF RUN
52 57 78 80
2 GPM/SQ FT ^^ 4 GPM/SQ FT
6 GPM/SQ FT- denotes "greater than" value shown
160
120
[-80
0
83 85 87 90 92 94 97 99 101 M3 115 118 120 122
DAY OF RUN
2 GPM/SQ ~T ^ 4 GPM/SQ FT 6 GPM/SQ FT
FIGURE 4.3b PLATE COUNTS IN PRODUCT WATER - RUN 1
analysis documented in Appendix A is summarized in Table
4.1. Both a paired T-Test and a Wilcoxon signed ranks test
were applied to the data to determine whether a cause and
effect relationship existed.
TABLE 4.1 STATISTICAL ANALYSIS OF RUN 1 PRODUCT WATER DATA Paired T-Test Wilcoxon Test Significant at Test p value p value alpha = 0.05
2 vs. 4 0.611 0.142 No (GPM/sq ft)
2 vs. 6 0.005 0.004 Yes (GPM/sq ft)
4 vs. 6 0.004 0.001 Yes (GPM/sq ft)
The results of the statistical analysis indicate that the highest sloughing rate occured in the 2 gpm/sq ft
filter, and the 6 gpm/sq ft filter showed the least
sloughing (P = <0.01). This is likely considering that the
most growth would be expected on the filter with a slow
rate, reducing the shear forces on the cells [10,12,48,51].
However, this argument is countered by the possibility that
higher rate filter would likely wash more cells into the
product water and supply more substrate to the microbes
From the TOC data in Figure 4.1, it can be seen that the filter-adsorber operated at the slower rate, 2 gpm/sq ft, has the greatest TOC removal rate. This is
attributable to the longer EBCT, which allows a better
opportunity for contact with adsorption sites and
biodegradation.
Figure 4.4 shows graphically the results from the GAC
extraction in PVP/PPi. The units are CFU/g GAC dry weight.
As stated in Section 3.3, no removal procedure will recover
all the cells from GAC, and references to GAC microbial
density from this extraction procedure are made in deference to that fact. The designations as "Top",
"Middle", and "Bottom" refer to depth of sample in the
filter-adsorber, with the respective sample ports being 3
inches below the GAC, in the center of the GAC, and 2 inches above the sand.
The effects of application rate again indicate the
lowest rate filter-adsorber, (2 gpm/sq ft) , had the highest
microbial population, when compared to the high rate
filter-adsorber (6 gpm/sq ft). For Run l, the results show
no appreciable differences as a function of bed depth.
2 GPM/SQ FT 4 GPM/SQ FT 6 GPM/SQ FT
TOP KWWWN MIDDLE iill BOnOM
DAY 7 6
Millions of CFU/grom GAC
ͣ
H
54
2 GPM/SQ FT 4 GPM/SQ FT 6 GPM/SQ FT
TOP KWWW^ MIDDLE f^^fm BOHOM Oma SAND
densities were at the top of the filter where the
biodegradable materials are first available to the biofilm
[25,26,32, 48,51]. This phenomenon may not have occurred
at this pilot plant due to the application of
pre-chlorinated source water [48]. Figure 4.5 provides a
confirmation of this lack of stratification by showing that
the TOC is not removed in the top portion of the
filter-adsorber to a higher extent than in lower sections.
4.3 Effect of Backwash Strategy on Microbial Activity
-Run 2
In Section 2.6 the effect of backwashing GAC
filter-adsorbers on the microorganism population was reported to
be a reduction in density on the GAC and, consequently, in
the filtrate [18,19,20,31,33,48]. This decrease was noted
only for short periods of time. Bouwer and Crowe [7]
stated that this phenomenon is as yet poorly understood,
but it seems likely that the increased shear forces during
backwashing cause the release of surface bacteria and
poorly attached bacteria. These bacteria and other
Middle Bottom Finished
2 GPM/SQ FT ^H 4 GPM/SQ FT WwM 6 GPM/SQ FT
growth is re-established again and the biofilm begins to
shed cells. The process of backwashing at a higher
frequency would scour the excess cells on the surface of
the GAC, resulting in a "leaner", more firmly attached
population.Table 4.2 shows the results of testing the total
viable plate count of microbes in the backwash water at the
beginning and end of the backwash cycle. These results
illustrate the sloughing effect of backwashing on the
TABLE 4.2 MICROBIAL DENSITY IN BACKWASH WATER
BEGINNING (0 MINUTES) 2.75 X lof CFU/mL
END (5 MINUTES) 4.5 X 10-^ CFU/mL
Note: Results are for the control unit backwashed once
every 48 hours.
GAC microbes. Initially a large number of microbes are
washed into the filter-to-waste water, but by the end of
the wash cycle the number has declined as the cells
remaining are more firmly attached. The quantity of cells
released initially is 10 times higher than that found in
the product water at steady-state, which makes it clear why
a lag period following backwashing is noted for cells in
the filtrate. Figure 4.6 confirms this interpretation. In
product water from backwash to backwash, a series of
samples was taken every four hours and plated. The
results, presented in Figure 4.6, show the level of viable
microbes was less than 30 CFU/mL 6 minutes after the filter
had been put in service following backwashing. It should be noted, however, that the counts rise within minutes.
After only 30 minutes the number of CFU/mL of filtrate had
risen to the same order of magnitude as that prior to
backwashing.
In Run 2, the rate of filtration was 4 gpm/sq ft for
all three filter-adsorber units, but the backwash protocol
was varied. Unit 3 was backwashed at a typical rate of every 48 hours. Unit 2 was backwashed with a higher
frequency of every 24 hours. Unit 1 was backwashed on the standard 48 hour cycle, but the clear well water was dosed
with 2 mg/L HOCl just prior to backwashing. This second
run lasted 83 days. The plate counts found in the product
water are presented in Figures 4.7a and 4.7b. The legend
denotes backwashing with "BW".
Inspection of the data in Figures 4.7a and 4.7b shows
qualitatively that the GAC filter-adsorber unit that
received chlorinated backwash water at a level of 2 mg/L
20
15
10
0 J______L
J______L J______I______L
0.1 0.5 2 6 10 14 18 22 26 30 34 38 42 46 48
HOURS IN RUN
RESULTS
FROM UNIT 3 - CONTROL
100
-1 2 3 6 7 8 9 -10 -13 -15 -17 20 22 24 27 29 34
DAY OF RUN
RW-24 hr. 3W-48 hr.
100
80
60
40
20
0
36 38 41 43 51 52 57 62 64 66 69 71 73 76 78 80 83
DAY or RUN