Quantifying and Monitoring Overdiagnosis in Cancer Screening:
A Systematic Review of Methods
By
Jamie Carter
A Master’s Paper submitted to the faculty of
the University of North Carolina at Chapel Hill
in partial fulfillment of the requirements for
the degree of Master of Public Health in
the Public Health Leadership Program
Chapel Hill
2013
Advisor
Date
Second Reader
Abstract
Introduction: To reduce overdiagnosis, we need accurate methods to quantify and monitor this
phenomenon over time.
Aims: To systematically review the methods that have been used for measuring overdiagnosis from
cancer screening; to evaluate the strengths and weaknesses of each method.
Methods: We searched PUBMED, EMBASE, and the Cochrane Library for primary research studies of
any design that quantified overdiagnosis from cancer screening. We abstracted relevant data and
appraised study design and methods using established criteria.
Results: 49 studies met inclusion criteria. We grouped studies into four methodologic categories and
found strengths and weaknesses with all designs. (1) Follow-up of a well-designed RCT (n=1) is
theoretically an ideal method but requires substantial time, may not be generalizable, and is not suitable
for monitoring. (2) Pathologic/imaging studies (n=8) that draw conclusions about overdiagnosis by
examining the range of biological or behavioral characteristics among cancers are simpler in design but
assume that these characteristics are highly correlated with progression. (3) Modeling studies (n=19) can
be done in a shorter time frame but require complex mathematical equations simulating the natural history
of screen-detected cancer, which is the fundamental unknown question. (4) Ecologic studies (n=21) are
limited by a lack of agreed-upon standards, by variable data quality, by inadequate follow-up time, and by
the potential for population-level confounders. Some ecologic studies, however, have used excellent
methods; several of these studies from different geographic areas may together provide the best overall
estimate of overdiagnosis and are ideal for monitoring it over time.
Conclusions: Well-conducted ecologic studies in multiple settings should be used for quantifying and
monitoring overdiagnosis in cancer screening programs. To support this work, we need internationally
agreed-upon standards for ecologic studies and a multi-national team of unbiased researchers to perform
Introduction
A critical part of medical decision-making regarding whether or not to be screened for cancer is
determining the balance of benefits and harms of screening programs. An appropriate cancer screening
program is one for which the potential benefits outweigh the potential harms. While the exact point for
which benefits outweigh harms or vice-versa is based on a complex judgment and may differ among
individual patients, health care providers and policy-makers, this determination requires an accurate
assessment of the magnitude of such benefits and harms.1
A harm of cancer screening that is increasingly being recognized and reported is overdiagnosis.
Overdiagnosis refers to the diagnosis of a condition that would have otherwise not resulted in any
symptoms or death duringthe patient’s lifetime. Incancer, there are different scenarios that can lead to
overdiagnosis. First, overdiagnosis can occur because of characteristics of the tumor and its potential for
growth and regression. A tumor can either grow so slowly that the patient never would have developed
symptoms or in some cases it can actually regress. Alternatively, overdiagnosis can result from the
diagnosis of a cancer that progresses at a rate such that the patient ends up dying from another cause
before the cancer becomes symptomatic. Consideration of competing mortality is important in cases of
this second type of overdiagnosis, as the degree of medical comorbidity may contribute to the likelihood
of death from another cause.2
Many consider overdiagnosis to be the most serious side effect of cancer screening, as
overdiagnosis results in erroneous labeling of the patient with an incorrect life-long diagnosis. The
resulting treatments and surveillance as well as the label of cancer itself cause physical and psychosocial
harm to patients.3 Physicians cannot distinguish between a patient with a cancer destined to cause harm
and an overdiagnosed cancer at the time of diagnosis, so essentially all cancers are treated. A patient who
is overdiagnosed with cancer cannot benefit from this diagnosis or treatment but instead can only be
Potential for Overdiagnosis: Early Stage Disease Reservoir
The existence of overdiagnosis requires that there be a reservoir of non-progressive or slowly
progressive disease in the population that can be detected with diagnostic tests, or a subset of cancers that
are currently present that will later regress, or likely both. There are biologic mechanisms that enable
cancers to be non-progressive, such as a cancer that outgrows its blood supply, that is recognized and
successfully contained by the host immune system, or that simply lacks typical aggressive
characteristics.4 Autopsy studies have been used to investigate whether a reservoir of undetected cancer
exists in patients who died from other causes.
A review of autopsy studies of women not known to have breast cancer during their lives found
the median prevalence of breast cancer in seven studies among women of all ages was 1.3%, and the
median prevalence of ductal carcinoma in situ (DCIS) was 8.9%. The prevalence of breast cancer or
DCIS among women of screening age ranged from 7% to 39%. The authors observed that prevalence
was correlated with the degree of rigor of the observation, as studies that used more slides to examine the
tissues found a higher prevalence, which may explain the large variation in estimates.5Studies that follow
patients who were initially misdiagnosed with benign lesions who were actually confirmed later to have
DCIS also provide the some direct evidence about the progression of DCIS to invasive cancer. These
studies report a range of 14-53% progression of DCIS to invasive cancer over a period of ten years or
more.6 These studies provide evidence that a reservoir of undetected non-progressive breast cancer and
DCIS is likely present in some women, though the exact prevalence is uncertain.
Other autopsy studies provide further evidence of a disease reservoir in other cancer types as
well. A retrospective study in Australia of over 13,000 autopsy reports of people who died from natural
causes found 47 cases of incidental lung cancer, 86% of which were stage one.7 Another study that
compared autopsy evaluation for pulmonary nodules with detection of the same nodules on CT scan in the
of low levels of overdiagnosis could be accurately made from autopsy studies, noting that prior studies
had found very low rates of malignant lung cancers in autopsy subjects. Researchers found that 32% of
patients with pulmonary nodules identified on a thoracic CT within 2 months of deaths did not have these
same pulmonary nodules detected on autopsy, thus concluding that autopsy likely underestimates the
prevalence of clinically insignificant lung cancer.8 The age-independent frequency of histological
prostate cancer in an autopsy study of 212 patients without a history of prostate cancer was 18.8% and
ranged from 0% to 56% among different age groups.9 In another study, the overall prevalence of prostate
cancer was 37.3% in Russian men and 34.6% in Japanese men who died from causes other than prostate
cancer. Prevalence was greater than 40% in men over 60 and greater than 60% in men over 80,
demonstrating a large early-stage disease reservoir that increase with age.10 Finally, a study of incidental
thyroid cancer in Finland found a papillary thyroid carcinoma prevalence of 35.6% among autopsy
patients. Many of the carcinoma specimens were smaller than the width of each slide (2.5mm) leading to
the conclusion that the investigators had likely missed cases.11
Potential for Overdiagnosis: Cancer Regression
The ability of tumors to regress has been documented in cases reports throughout the medical
literature for a variety of cancer types. In breast cancer, a 1999 review identified 32 cases of reported
spontaneous remission of breast cancer12, and another case report of has been published since the
review.13 A 2009 review found 76 reported cases of spontaneous regression of metastatic melanoma
since 1866.14 During a randomized controlled trial of interferon-beta for metastatic renal cell carcinoma,
six patients of 99 in the control group achieved remission, including three whose cancer had completely
regressed.15 Spontaneous regression of hepatocellular carcinoma has been documented 75 times in the
medical literature.16 In a Japanese screening program, patients with localized, low-risk neuroblastoma
were offered the option of observation instead of treatment. Eleven patients were identified for
in 17 patients by 20 months following diagnosis.18 Other studies indicate the potential for lesions
typically considered as “pre-cancerous” to regress, including polyps19 and cervical low-grade squamous
intraepithelial lesions.20
Another study demonstrated the potential for regression of breast cancer using different methods.
This study compared breast cancer incidence in four counties of Norway in a group of women invited for
three rounds of screening from 1996-2001 to an age-matched control group that was monitored from
1992-1997 and then offered one-time screening at the end of the observation period. Potential
confounders including educational attainment, family income, reproductive history and screening
attendance were all closely matched between the two groups. Before the control group was invited for
screening, the cumulative incidence of breast cancer was significantly higher in the screened group (RR
1.57, 95% CI 1.44-1.70). However, contrary to what would be expected, the cumulative incidence of
breast cancer remained elevated by 22% in the screened group compared to the control group after the
control group underwent prevalence screening after the observation period (RR 1.22, 95% CI 1.16-1.30).
This finding suggests that the natural history of some screen-detected breast cancers is to regress, as some
of the cancers detected on repeated mammography would not have been detectable at the end of the
6-year screening period. The authors of this study also noted that the Canadian randomized controlled trial
of breast cancer screening in women aged 40 to 4921also reported a 22% excess of incidence in the
screened group that was not detected in the control group despite four years of screening at the end of the
trial.22
Increasing Incidence of Early Stage Cancers
A pattern of increasing incidence of early stage cancer, especially that corresponds temporally
with screening, is indicative of possible overdiagnosis. In the United States, several types of cancer have
had dramatic increases in incidence over the past decades. Melanoma incidence increased 2.5-fold in
patients over 65 between 1986 and 2001. After accounting for a possible increase in the true incidence of
increase in biopsy rate over the same time frame and that the majority of new cases were confined to early
stage disease.23 Other studies found similar growth, but some also found an increase in the incidence in
late-stage, thicker melanomas and thus concluded that the increase in incidence cannot be entirely
attributed to increased detection of early-stage lesions.24 Similarly, thyroid cancer incidence increased
2.6-fold from 1973 to 2006. The greatest growth, of 441%, was seen in the smallest subset of papillary
thyroid cancer tumors less than 1centimeter. However, larger tumors also increased leading some
researchers to argue that the increasing incidence of thyroid cancer is not entirely due to an increase in
early lesions.25 Some types of overdiagnosis may not be due to screening, but actually to the increased
use of imaging tests such as abdominal CT scans. Incidence rates of localized renal cell carcinoma more
than doubled from 1988 to 2006, from 3.8 per 100,000 person-years to 8.2 per 100,000 person-years.26
Some types of cancer are currently decreasing in incidence despite having increased greatly over
the past few decades. Prostate cancer incidence has dropped slightly in recent years after increasing
dramatically from 1986 to 1992 with the introduction of PSA screening. However, the relative incidence
rates of prostate cancer in 2005 relative to 1986 varied widely by age group, with relative rates of 3.64 in
men ages 50 to 59 and 7.23 in men younger than 50, so in some demographics incidence is still on the
rise.27 Breast cancer incidence but sustained a sharp increase between 1980 and 1987 corresponding with
increasing use of screening mammography. During this period, incidence of breast cancers smaller than
one centimeter quadrupled, from 9 per 100,000 to 36 per 100,000, and incidence of DCIS more than
tripled from 4 per 100,000 to 15 per 100,000.28 Breast cancer incidence then decreased in the 1990’s and
early 2000’s but since 2006 has been again increasing.29 Another recent study spanning a longer time
frame found that the incidence of early stage breast cancer more than doubled from 112 cases per 100,000
to 234 per 100,000 from 1976 to 2008.30
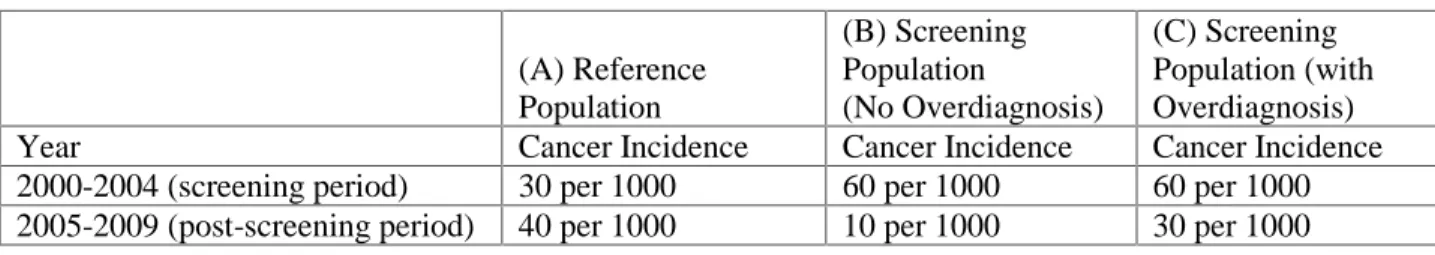
Patterns of cancer incidence and mortality in the United States demonstrate that overdiagnosis is
occurring. A cancer with both increasing incidence and increasing mortality represents a true increase in
past 30 years in the United States with melanoma, breast cancer, prostate cancer, kidney cancer, and
thyroid cancer. An alternative explanation for this pattern is that improvements in diagnosis and
treatment of the cancer are causing an improvement in mortality that exactly counteracts the increase in
incidence. However, this explanation involves more assumptions than are required for the explanation
involving overdiagnosis and as such is less likely.4
Addressing Overdiagnosis
Experts have suggested a variety of strategies for addressing the problem of overdiagnosis in
cancer. Several have proposed raising the threshold for labeling a test result or image abnormal and
consider monitoring lesions over time to assess growth instead of jumping straight to a bipsy.4,31,32 Others
advise replacing the term cancer with another term that suggests the more benign nature of much of the
spectrum of cancer to represent early-stage lesions.32Eventually, we may have biomarkers that can
distinguish between indolent and more aggressive cancers such that therapies can be targeted towards
those cancers most likely to be fatal.
Education about overdiagnosis will also be crucial for minimizing its harms4,31, and this includes
education for medical students, residents, current physicians, and the public. Medical practitioners
currently receive mixed messages regarding overdiagnosis, however, as its coverage and emphasis in the
medical literature, as well as estimates of its magnitude, have varied widely. A 2007 study found unequal
attention given to benefits and harms in articles on screening mammography, which was related to the
professional affiliation of the author. Benefits were mentioned more often than harms (96% versus 62%),
with 38% of articles mentioning only benefits. Overdiagnosis was mentioned in only 40% of articles on
screening mammography and was more likely to be downplayed or rejected by authors that worked
specifically in screening (40%) than by authors in screening-affiliated specialties (like breast cancer
surgery or radiology) who were not working directly with screening (17%) or by authors in an unrelated
specialty (7%).33 Within the medical community, overdiagnosis is a polarizing issue, and the lack of
clarity in communication about overdiagnosis or understanding of its magnitude is a barrier to effectively
Most importantly, we need to develop an understanding of patient and societal values regarding
overdiagnosis, which likely will follow an effort to educate patients so they are able to make informed
decisions. Currently, knowledge of overdiagnosis among the public appears to be minimal. In a cross
sectional study (Schwartz et al)of US women’s attitudes regarding potential consequences of breast
cancer screening, no women identified the detection or treatment of a non-progressive breast cancer as a
potential harm of screening, and only 7% were aware of the existence of non-progressive breast cancer.34
A recent qualitative study35of women’s values regarding overdiagnosis reported that women had minimal
awareness of overdiagnosis prior to participation in the study, and some expressed surprise at being
informed of it. Despite low awareness, women from various socioeconomic and educational backgrounds
could understand information presented on overdiagnosis and valued this information in making their
screening decisions.35 Other studies confirm that the public values information on overdiagnosis as a
harm of screening. In the Schwartz et al study, 60% of women wanted to factor information on
non-progressive cancers into their decisions for pursuing mammography.34 A 2013 study of men’s
preferences for prostate cancer screening found that men considered risk of unnecessary treatment and
biopsy as a factor in decision-making.36
In the preliminary Hersch et al study, the magnitude of overdiagnosis also appeared to be
valuable to women making decisions about screening mammography. When the estimate of
overdiagnosis was 50%, some women expressed that they would much more carefully consider the
decision to be screened, with some women expressing that they would likely forego screening altogether,
be less concerned about achieving a rigid screening interval, or consider delaying screening until a later
age. At lower estimates, women were less concerned about overdiagnosis. With overdiagnosis of 1 to
10%, some women expressed that this was minimal and would not at all affect their intentions for
screening. With overdiagnosis of 30%, women acknowledged concern with this large number and effect
Both the existence and magnitude of overdiagnosis are important to patients, and its magnitude
can be critical for decision-making on a population level as well. In evaluating screening programs,
experts argue that benefits and harms should be weighed using an outcomes table which depicts all the
possible outcomes of a screening test and their relative likelihoods among an eligible cohort1. Critical
policy decisions regarding provision of screening are made based on an often delicate balance of benefits
and harms, and a change in the magnitude of overdiagnosis can shift this balance one way or another.
Thus, accurate measurement of overdiagnosis is important for both individual and population-level
decision-making.
Unfortunately, because it is impossible to distinguish at the time of diagnosis between an
overdiagnosed cancer and one that would have become clinically meaningful, the measurement of
overdiagnosis is not straight-forward. Researchers have used various methods to indirectly quantify
overdiagnosis resulting from cancer screening, but the magnitudes of such estimates have varied widely.
This systematic review attempts to identify and evaluate the methods that have been used for measuring
overdiagnosis resulting from cancer screening and analyze the advantages and disadvantages of each
method. We will also determine which methods for measuring overdiagnosis are most suitable for
monitoring it over time, as monitoring will be key to preventing overdiagnosis and tracking our progress
with this endeavor. A better understanding of methods for measuring overdiagnosis will aid future
researchers in designing studies to accurately measure this phenomenon. In turn, more reliable and
accurate measurements of overdiagnosis resulting from cancer screening will enable better representation
of the benefits and harms of such tests, ultimately providing the tools for patient-centered medical
decision-making. Finally, as we develop interventions to try to decrease overdiagnosis, we need to be
able to perform surveillance and monitor overdiagnosis over time, which requires accurate and reliable
Methods
Key Questions
This review aims to answer the following key questions:
Key Question 1: What research methods have been used to measure overdiagnosis resulting from cancer
screening tests?
Key Question 2: What are the advantages and disadvantages of each method of measuring
overdiagnosis?
Key Question 3: What methods would be most suitable for monitoring overdiagnosis over time?
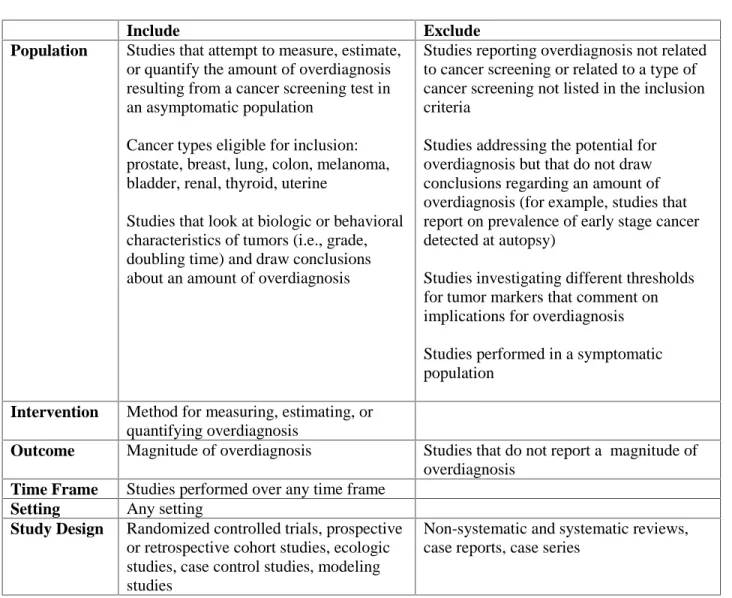
Eligibility Criteria
We designed inclusion and exclusion criteria for the review to include all studies that have
attempted to measure, quantify, or estimate the amount of overdiagnosis resulting from a cancer screening
test in an asymptomatic adult population. We used modified PICOTS criteria (see Table 1) whereby the
population of interest was studies that measure overdiagnosis. We limited the scope of the review to
studies of overdiagnosis in the nine types of solid tumors with the highest incidence in the United States
in 2012, as these cancer types likely have the highest potential for overdiagnosis due to a high rate of
cases diagnosed. These cancer types are prostate, breast, lung, colorectal, melanoma, bladder, renal,
thyroid, and uterine cancer.37Studies reporting overdiagnosis not relating to cancer were excluded, as
were studies that addressed the potential for overdiagnosis but did not report a quantity. For example,
autopsy studies reporting on the prevalence of low grade or early stage cancer in patients who died of
other causes are important for demonstrating the principles of overdiagnosis but were ineligible for this
review. Studies that examined biologic or behavioral characteristics of detected tumors and then drew
Studies not providing a numerical estimate for the magnitude of overdiagnosis were excluded. Studies
from any setting and time frame were included. Because measuring overdiagnosis is possible through a
variety of study designs, and because the comparison of methods was the key intention of this review, a
wide range of study designs were eligible including randomized controlled trials, prospective or
retrospective cohort studies, ecologic studies, and case control studies. When multiple publications that
measured overdiagnosis with modeling used the same model and populations to determine the
overdiagnosis estimate, only the most recent publication was included. Non-systematic and systematic
reviews, case reports and case series were excluded. Only studies in English were included.
Search Strategy
We conducted a systematic search of PUBMED, EMBASE, and the Cochrane library on
February 22, 2013. A research librarian helped with the development of the search terms and the
adaptation of the terms to the different databases. The search terms used to search PubMed were as
follows: “(cancer*[tw] OR neoplasms[MeSH]) AND (Screening*[tw] OR early diagnos*[tw] OR early
detect*[tw]) AND (overdiagnos*[tw] OR over diagnos*[tw] OR overdetect*[tw] OR over detect*[tw])”.
We placed no date or language limitations on studies to avoid missing studies that had not yet been
indexed. We also hand-searched reference lists of included systematic reviews and other narrative
Table 1: Modified PICOTS Criteria for Study Eligibility
Include Exclude
Population Studies that attempt to measure, estimate, or quantify the amount of overdiagnosis resulting from a cancer screening test in an asymptomatic population
Cancer types eligible for inclusion: prostate, breast, lung, colon, melanoma, bladder, renal, thyroid, uterine
Studies that look at biologic or behavioral characteristics of tumors (i.e., grade, doubling time) and draw conclusions about an amount of overdiagnosis
Studies reporting overdiagnosis not related to cancer screening or related to a type of cancer screening not listed in the inclusion criteria
Studies addressing the potential for overdiagnosis but that do not draw conclusions regarding an amount of overdiagnosis (for example, studies that report on prevalence of early stage cancer detected at autopsy)
Studies investigating different thresholds for tumor markers that comment on implications for overdiagnosis
Studies performed in a symptomatic population
Intervention Method for measuring, estimating, or quantifying overdiagnosis
Outcome Magnitude of overdiagnosis Studies that do not report a magnitude of overdiagnosis
Time Frame Studies performed over any time frame Setting Any setting
Study Design Randomized controlled trials, prospective or retrospective cohort studies, ecologic studies, case control studies, modeling studies
Non-systematic and systematic reviews, case reports, case series
Study Selection
Titles and abstracts of all studies identified by the search were reviewed independently by two
reviewers for inclusion based on the criteria discussed and listed in Table 1. Any article that was
identified for inclusion by either reviewer or for which there was not enough information available in the
abstract had its full text reviewed for the same eligibility criteria. Two reviewers independently
disagreements about inclusion or exclusion of these studies were resolved by consensus, and a third senior
reviewer was consulted to resolve any remaining disagreements.
Data Extraction
One reviewer extracted relevant data on a spreadsheet that was standardized for each type of
study. These data were then verified by a second reviewer, and discrepancies were resolved by
consensus. For all study types, information on study design, study population, time period, screening test,
screening schedule, threshold for labeling a result abnormal, length of follow-up, magnitude of
overdiagnosis, and conclusions were extracted. If studies used modeling to measure overdiagnosis,
information on the name and type of model, data sources, and sensitivity analyses were extracted. For
cohort and ecologic studies, information on the reference population and statistical adjustment for
confounders and lead time were noted. When randomized trials were followed-up to measure
overdiagnosis, the type of statistical analysis performed and the baseline characteristics of the two groups
were extracted. Some studies used information on pathologic or imaging characteristics of cancers to
draw conclusions about overdiagnosis, and the details of these characteristics were documented for these
studies.
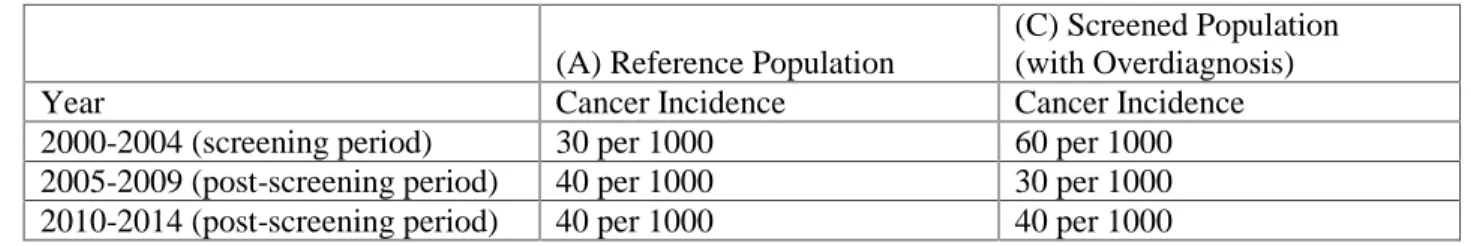
All studies were assessed for reporting of the preferred outcome, which was overdiagnosis
defined as excess of cancer cases diagnosed during the screening period divided by total number of cases
detected by screening. This method is the most appropriate way to calculate overdiagnosis, as
overdiagnosis is an outcome of screening and can only occur in asymptomatic patients diagnosed by
screening. Using a different denominator, such as the total number of cancer cases detected including
interval cancers diagnosed by the presence of symptoms, dilutes the overdiagnosis measurement and
makes its implications less clear. The timeframe over which overdiagnosis is measured can also affect its
magnitude, and we made note of this timeframe in our data extraction. We extracted the preferred
was available. Otherwise, we extracted the overdiagnosis measurement that was reported but made note
of the way the calculation was performed.
Risk of Bias Assessment
We created standard criteria to evaluate risk of bias for each of the four main types of studies
found in this review, which were cohort and ecologic studies, pathologic and imaging studies, follow-up
of randomized controlled trials, and modeling studies. We rated each individual study for risk of bias
using ratings of high, moderate or low. Two reviewers independently rated the risk of bias for each study,
and we resolved discrepancies by consensus. The four sets of complete criteria used for risk of bias
assessment can be found in Appendix A.
We adapted the criteria for cohort and ecologic studies from quality criteria used in a recent
systematic review of observational studies of breast cancer screening.38 These adapted criteria include the
potential for selection bias, measurement bias, and confounding with a focus on the use of comparable
groups with regards to potential confounders. Risk of bias criteria for randomized controlled trial
follow-up studies were adapted from standard criteria used by the USPSTF.39 Pathologic and imaging studies
typically did not have a control group, so the risk of bias assessment focused on the validity and reliability
of the measurements performed. The appropriateness of the time frame was evaluated for all study types,
as the measurement of overdiagnosis requires consideration of the lead time of the cancers studied, and
measuring overdiagnosis without adequate time for follow-up can affect its magnitude.
We developed a new set of criteria for evaluating modeling studies for the purpose of this review.
Authors of modeling studies were expected to discuss the probability for biases in the data used in the
model and to choose data that had low probability for biases. Assumptions were to be clearly stated,
ideally in a table of assumptions, and all assumptions made in the model needed to be backed with
evidence that was ideally identified and assessed for quality in a systematic review. Sensitivity analyses
analyses rather than single-variable analyses. Finally, models should also have been validated using
population data different from the data used to calibrate the model.
Strength of Evidence Assessment
To evaluate the strength of evidence, we developed a set of criteria from other criteria used by the
USPSTF39and by the GRADE working group.40 Each individual study was evaluated for risk of bias,
directness, external validity, and precision. We rated each study as high, moderate or low for risk of bias
and good, fair, poor, or “cannot determine” for the other criteria. Among ecologic and cohort studies,
each study was also reviewed for the appropriateness of the analysis and its ability to provide an unbiased
overdiagnosis estimate, which will be discussed further in the results section. Two reviewers individually
determined ratings for each of these criteria, and we resolved discrepancies by consensus.
The GRADE working group defined directness as the extent to which the intervention relates the
evidence to health outcomes.40 In this review, we evaluated the extent to which the evidence links the
screening test directly to health outcomes without making certain assumptions, including assumptions
regarding the progression of a screen-detected cancer to cancer-related morbidity and mortality, and
assumptions regarding the association of pathologic or behavioral characteristics of a cancer with cancer
progression, morbidity and mortality. A study with good directness requires minimal assumptions to
draw conclusions about the magnitude of overdiagnosis and directly measures excess cases of cancer.
We adapted criteria for evaluating external validity of individual studies from the USPSTF
procedure manual.39 Studies were assessed for their relevance to a general US adult population. We
considered the extent to which the study population was similar to the general US population in factors
associated with cancer incidence and in the quality of medical care and risks for competing mortality. We
also assessed the similarity of the screening situation in each study to the way screening is performed in
threshold used to label a result abnormal. All of these factors affect the way cancer is diagnosed and thus
can affect the degree of overdiagnosis present.
We combined the ratings for risk of bias, analysis, directness, external validity, and precision with
an evaluation of the consistency of the study results to determine of the strength of evidence for the
overall body of evidence. We evaluated strength of evidence for each study design and cancer type. The
risk of bias, directness, external validity, and precision of each of the individual studies was used to assess
the aggregate risk of bias, directness, external validity, and precision for the body of evidence. We used
the GRADE working group’s definition to evaluate consistency by looking at the degree towhich the
overdiagnosis measurement from all the included studies of that cancer type and study design had the
same magnitude. The complete list of criteria used to evaluate strength of evidence can be found in
Appendix B.
Data Synthesis and Analysis
We performed qualitative data synthesis, organizing the results by study design and cancer type.
We did not attempt to perform quantitative analysis because of the heterogeneity of the study designs,
populations, and results. We identified strengths and weaknesses of each study design used to measure
overdiagnosis, based on the criteria used to evaluate the strength of the body of evidence. We did not
attempt to assess publication bias.
Results
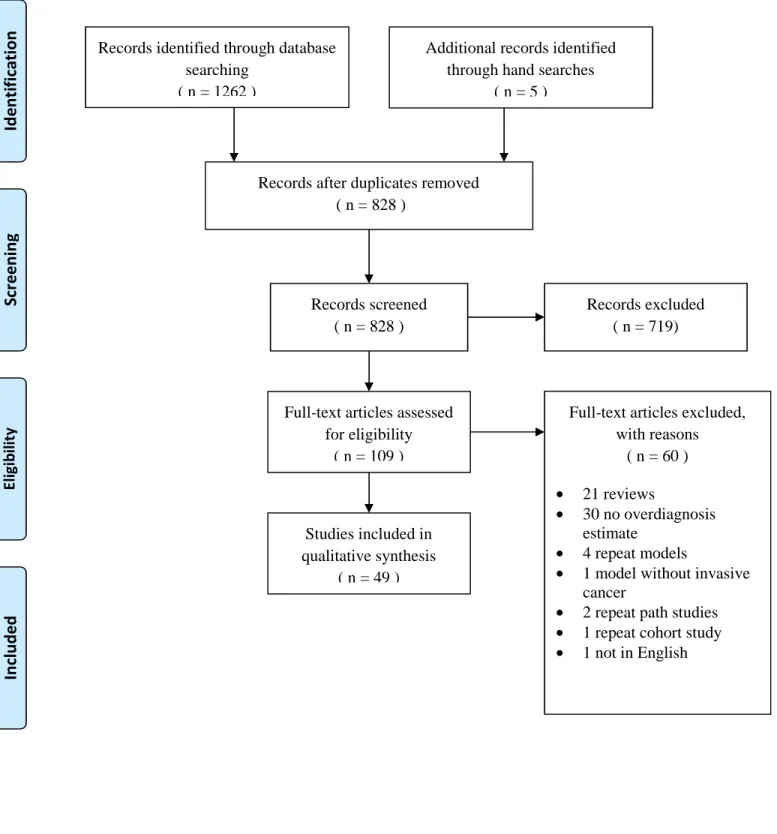
Our search, performed on February 22, 2013, yielded a total of 1262 studies from PubMed,
EMBASE, and the Cochrane library. After duplicates were removed, 823 studies remained, and five
additional studies were later identified by hand searching reference lists of relevant reviews. We
reviewed 828 abstracts and identified 109 studies that were eligible for text review. During the
Figure 1: PRISMA Flow Diagram of Study Selection Process
Records identified through database searching
( n = 1262 )
Sc
re
en
in
g
In
cl
ud
ed
El
ig
ib
ili
ty
Id
en
tif
ic
at
io
n
Additional records identified through hand searches
( n = 5 )
Records after duplicates removed ( n = 828 )
Records screened ( n = 828 )
Records excluded ( n = 719)
Full-text articles assessed for eligibility
( n = 109 )
Full-text articles excluded, with reasons
( n = 60 )
21 reviews
30 no overdiagnosis estimate
4 repeat models
1 model without invasive cancer
2 repeat path studies 1 repeat cohort study 1 not in English Studies included in
and one was excluded for not being in English. All studies that used modeling to measure overdiagnosis
were again reviewed to see if there were any studies that used the same model and population as another
study. We combined four of these modeling studies because they met these criteria, and in each case the
most recent publication was included. We excluded one additional modeling study for not including
invasive cancer. These modeling studies that provided an estimate of overdiagnosis magnitude but were
excluded for the reasons discussed are listed in Appendix C. Three studies of prostate cancer
overdiagnosis by the same group of authors41-43used essentially identical methods and the same
population to study overdiagnosis defined based on pathologic criteria. Of these three studies, only the
most recent publication41was included. Finally, a cohort study of breast cancer overdiagnosis in
Florence44was excluded because two other more recent studies by overlapping authors45,46were available.
A total of 49 studies were included for qualitative synthesis. Figure 1 shows the flow diagram of the
study selection process based on PRISMA recommendations.47
The included studies fell into four categories. Some studies used mathematical and statistical
models to measure overdiagnosis. Other studies examined pathologic or imaging characteristics of
tumors and used information about these characteristics to draw conclusions about overdiagnosis. A large
group of studies analyzed cancer incidence in either two populations or two cohorts to measure
overdiagnosis. Finally, one study followed participants of a randomized-controlled trial for fifteen years
after the trial ended. We categorized studies as modeling studies, pathologic/imaging studies, ecologic or
cohort studies, and follow-up of randomized controlled trials.
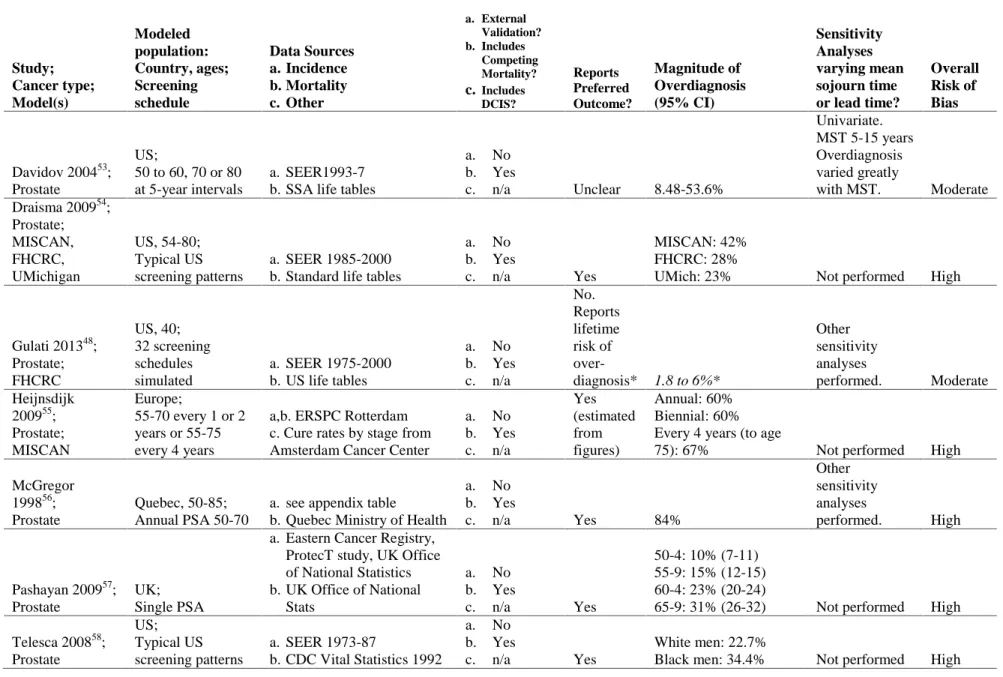
Characteristics of Included Studies: Modeling Studies
We included nineteen modeling studies in this review, including nine models of prostate cancer,
seven models of breast cancer, two models of lung cancer and one model of colon cancer overdiagnosis.
The characteristics of the included modeling studies are listed in Table 2, and full details are provided in
study48modeling 32 different hypothetical prostate screening schedules, for example. Not all studies
modeled both the non-progressive disease and competing mortality components of overdiagnosis, as three
breast cancer studies49,50,51did not include overdiagnosis resulting from competing mortality in their
models. One breast cancer model did not include DCIS.52 It is important to note that these studies
provide an incomplete look at overdiagnosis and almost certainly underestimate its magnitude to some
degree.
In contrast to the other study types, most modeling studies reported the preferred outcome, which
was the percentage of excess cancers divided by the total number of screen-detected cancers. However, a
few studies instead reported an overdiagnosis measure that dilutes the estimate, such as lifetime risk of
overdiagnosis of prostate cancer reported by Gulati and colleagues.48 There was considerable variability
within and among modeling studies in estimates of overdiagnosis, with estimates of overdiagnosis as a
percentage of screen-detected prostate cancers ranging from 8.48% to 67% depending on model
parameters and screening and population details. Many studies provided multiple estimates depending on
these various parameters to demonstrate the variability of the results. Among studies of breast cancer,
estimates of overdiagnosis as a percentage of screen-detected cancers ranged from 0.3% to 67.4%, though
these estimates were provided for specific time points such as the prevalence screen or the second screen
Table 2: Summary Evidence Table of Modeling Studies Study; Cancer type; Model(s) Modeled population: Country, ages; Screening schedule Data Sources a. Incidence b. Mortality c. Other a. External Validation? b. Includes Competing Mortality? c. Includes DCIS? Reports Preferred Outcome? Magnitude of Overdiagnosis (95% CI) Sensitivity Analyses varying mean sojourn time or lead time?
Overall Risk of Bias
Davidov 200453; Prostate
US;
50 to 60, 70 or 80 at 5-year intervals
a. SEER1993-7 b. SSA life tables
a. No b. Yes
c. n/a Unclear 8.48-53.6%
Univariate. MST 5-15 years Overdiagnosis varied greatly
with MST. Moderate Draisma 200954;
Prostate; MISCAN, FHCRC, UMichigan US, 54-80; Typical US screening patterns
a. SEER 1985-2000 b. Standard life tables
a. No b. Yes
c. n/a Yes
MISCAN: 42% FHCRC: 28%
UMich: 23% Not performed High
Gulati 201348; Prostate; FHCRC US, 40; 32 screening schedules simulated
a. SEER 1975-2000 b. US life tables
a. No b. Yes c. n/a No. Reports lifetime risk of
over-diagnosis* 1.8 to 6%*
Other sensitivity analyses
performed. Moderate Heijnsdijk
200955; Prostate; MISCAN
Europe;
55-70 every 1 or 2 years or 55-75 every 4 years
a,b. ERSPC Rotterdam c. Cure rates by stage from Amsterdam Cancer Center
a. No b. Yes c. n/a Yes (estimated from figures) Annual: 60% Biennial: 60% Every 4 years (to age
75): 67% Not performed High
McGregor 199856; Prostate
Quebec, 50-85; Annual PSA 50-70
a. see appendix table b. Quebec Ministry of Health
a. No b. Yes
c. n/a Yes 84%
Other sensitivity analyses
performed. High
Pashayan 200957; Prostate
UK; Single PSA
a. Eastern Cancer Registry, ProtecT study, UK Office of National Statistics b. UK Office of National
Stats
a. No b. Yes
c. n/a Yes
50-4: 10% (7-11) 55-9: 15% (12-15) 60-4: 23% (20-24)
65-9: 31% (26-32) Not performed High
Telesca 200858;
US;
Typical US a. SEER 1973-87
a. No
Study; Cancer type; Model(s) Modeled population: Country, ages; Screening schedule Data Sources a. Incidence b. Mortality c. Other a. External Validation? b. Includes Competing Mortality? c. Includes DCIS? Reports Preferred Outcome? Magnitude of Overdiagnosis (95% CI) Sensitivity Analyses varying mean sojourn time or lead time?
Overall Risk of Bias
Tsodikov 200659; Prostate
US; Typical US screening patterns
a. SEER
b. Human Mortality Database
a. No b. Yes
c. n/a Yes 30% Not performed High
Wu 201260; Prostate
Finland, 55, 59, 63, 67;
3 PSA tests every 4 years until 71
a. Finnish Prostate Cancer Screening Trial, Finnish Cancer Registry b. Statistics Finland
a. No b. Yes
c. n/a No*
3.4% (2.4-5.7) risk of overdetection during
study period* Not performed High
De Gelder 2011 (Epi Rev)61; Breast; MISCAN Netherlands, 0-100; Biennial mammo 49-74
a. Dutch Comprehensive Cancer Centers, National Evaluation Team for Breast Cancer Screening 1990-2006
a. No b. Yes
c. Yes Yes
Implementation: 22.1-67.4%
Extension: 15.4-30.5%
Steady state: 8.9-15.2% Not performed High
De Gelder 2011 (Prev Med)62; Breast; MISCAN
Netherlands, 0-100;
Biennial screen film or digital mammo
a. Dutch Cancer Registry, National Evaluation Team for Breast Cancer
Screening 1990-2006
a. No b. Yes
c. Yes Yes
Screen film: 7.2% Digital: 8.2%
Other sensitivity analyses
performed. High
Duffy 200549; Breast
Sweden, 40-74/ 39-59;
Mammo every 18, 24 or 33 months
All Data: Swedish 2-County RCT (1977-84) and
Gothenburg RCT (1982-87) (separate analyses)
a. No
b. No
c. Yes Yes
Swedish: 1st screen 3.1% (0.1-10.9), 2nd: 0.3% (0.1-1), 3rd: 0.3% (0.1-1).
Gothenburg: 1st: 4.2% (0.0-28.8), 2nd: 0.3% (0.0-2.0), 3rd: 0.3%
(0.0-2.0) Not performed High
Gunsoy 201263; Breast
UK, 40-49; Annual mammo
a. England/Wales Office of National Statistics, Age RCT Control Arm b. Office of National
Statistics
c. Parameter estimation model: Age RCT
a. No b. Yes
c. Yes Yes 0.70%
Univariate. Varied MST and sensitivity.
Study; Cancer type; Model(s) Modeled population: Country, ages; Screening schedule Data Sources a. Incidence b. Mortality c. Other a. External Validation? b. Includes Competing Mortality? c. Includes DCIS? Reports Preferred Outcome? Magnitude of Overdiagnosis (95% CI) Sensitivity Analyses varying mean sojourn time or lead time?
Overall Risk of Bias
Martinez-Alonso 201052;
Breast
Spain, 25-84; Biennial mammo 50-69
a. Girona Cancer Registry and IARC Registry
a. No b. Yes c. No No. Reported as percent excess of expected incidence. *
1935 birth cohort: 0.4% (-8.8 to 12.2) 1940: 23.3% (9.1-43.4%)
1945: 30.6% (12.7-57.6%)
1950: 46.6% (22.7-85.2%)*
Univariate. Varied MST from 1 to 5.
18.3 to 51.1% Moderate
Olsen 200650; Breast
Denmark, 50-69; Biennial mammo 50-69
a. Danish Cancer Registry, Breast Cancer Cooperative Group, Central Population Registry
a. No
b. No
c. Yes Yes
1st screen 7.8% (0.3-27.5)
2nd screen: 0.5% (0.01-2.2%) Other sensitivity analyses performed High Seigneurin 201251; Breast
France, 50-69; Not specified
a. French population-based study by Seigneurin 2009
a. No
b. No
c. Yes Yes
DCIS: 31.9% (2.9-62.3) Invasive cancer: 3.3% (0.7-6.5) Univariate. Varied MST. DCIS: 17.3-51.7% Invasive: 0-8.9% Moderate
Hazelton 201264; Lung
Heavy smokers, <5yrs asbestos exposure; Low dose CT
a,b. CARET (calibration) c. Calibrated model applied to NYU Biomarker Center Trial and Moffitt Cancer Center Trial
a. No b. Yes
c. n/a Yes
Men: 14.1% (11.6-19.7) Women: 35.2%
(28.9-39.3) Not performed High
Pinsky 200465; Lung
Men 50-75, heavy smokers;
Annual CXR and sputum cytology 50-75
All data: Mayo Lung Screening Trial (prevalence screen and screening arm only)
a. No b. Yes
c. n/a Yes 13 to 17% Not performed High
Luo 201266; Colon
Cohort age 40, 50 or 60;
5 annual or 3 biennial FOBT
a. Minnesota Colon Cancer Control study (1976-82) b. SSA life tables
a. No b. Yes c. n/a Yes (reported for age 50)
Females: 6.65% (2.56-20.49)
Males: 6.15%
(1.92-44.69%) Not performed High
Risk of Bias: Modeling Studies
For this review, we developed new criteria for evaluating risk of bias of modeling studies. An
ideal modeling study would clearly state its assumptions and data sources in a table, and all assumptions
would be supported by evidence identified and quality rated in a systematic review. Only one modeling
study48provided a table of assumptions, and none were supported by systematically-reviewed evidence.
Instead, most studies picked different data inputs from a variety of sources without justification for the
use of such diverse sources. This raises the risk of manipulation of the model to achieve a desired output
and thus the risk for bias. An alternative to performing a systematic review to inform the model with high
quality evidence would be to use all data inputs from a well-done randomized controlled trial. One breast
cancer modeling study49did use all data from the Swedish 2-County and Gothenburg randomized
controlled trials and was given credit for its use of consistent unbiased data sources, but this study had a
fatal flaw in that it did not perform sensitivity analyses. Three other studies55,63,66 used some data from a
randomized controlled trial but also pulled data from other sources.
We also attempted to rate modeling studies on the probability for biases in the data used in the
model. We expected that authors would choose data sources in an attempt to minimize bias as well as
discuss the potential biases in their choices in an effort to convince the reader of the validity of their
results. However, none of the modeling studies provided any information or discussion on potential
biases in their data.
A major component of the risk of bias assessment for modeling studies was the performance of
sensitivity analyses. The ideal study would perform probabilistic multivariate sensitivity analyses for key
uncertain parameters including mean sojourn time or lead time. Only four studies specifically varied
mean sojourn time in univariate sensitivity analyses51-53,63and one other study varied rates of disease
onset, metastasis and clinical detection,48which is likely equivalent. All other studies either performed
minimal sensitivity analyses that did not directly address key uncertain variables or did not perform
Several studies used a data set to calibrate the model and determine uncertain model parameters,
such as transition probabilities betweendifferent states in the model, and then “validated” the modelby
fitting it to the same original data set. A study which truly externally validated its model would use one
data set to calibrate the model and determine parameters and then externally validate it to another data set
in a different population. Performing this external validation would lend more credibility to the
assumptions made in the model and would make it more likely that the calibrated parameters are
applicable to more than just the modeled population. None of the modeling studies included in this
review performed external validation of their models and thus did not achieve this degree of credibility.
We rated the majority of modeling studies as having a high risk of bias because they had a fatal
flaw of not performing sensitivity analyses for key uncertain variables, in addition to the other potential
biases already discussed. The five studies that performed univariate sensitivity analyses as described
above were rated as having moderate risk of bias, as none performed external validation or informed the
model with systematically reviewed evidence or data from a single randomized trial.
Strength of Evidence: Modeling Studies
We assessed strength of evidence for modeling studies grouped by cancer type, with other criteria
in addition to risk of bias being directness, external validity, precision and consistency. Our ratings for
each study are available in Appendix Table 3. Directness for all modeling studies was rated as poor,
because by nature the models used to draw conclusions about overdiagnosis require assumptions about
progression of cancer from early, preclinical stages to later stages. The nature of this progression is
fundamental to the question of overdiagnosis and its magnitude, so in many ways it is inappropriate that
models attempting to answer such questions would require such assumptions. Ratings for external
validity for prostate cancer modeling studies were generally good, as these studies tended to be based on
US data and based on typical US screening patterns. In contrast, all the breast cancer models were based
diagnostic rate of DCIS, and thus were rated as fair for external validity. We were often unable to
determine the precision of the overdiagnosis estimates because confidence intervals were not provided in
many cases, but in most other cases precision was fair to poor. Finally, we rated consistency for both
breast and prostate cancer modeling studies as poor. Strength of evidence was rated as low for breast,
prostate, lung and colon cancer modeling studies.
Characteristics of Included Studies: Pathologic and Imaging Studies
We included eight studies that drew conclusions about overdiagnosis based on a pathologic or
imaging characteristics, six of lung cancer overdiagnosis and two of prostate cancer overdiagnosis. Table
3 highlights the characteristics of these included studies, and full details are available in Appendix Table
4. The lung cancer studies were typically small studies that retrospectively looked at volume doubling
time of patients diagnosed with lung cancer by screening chest x-ray or CT scan. These studies included
a total of 376 cancers. The definition for overdiagnosis was typically set at a volume doubling time of
400 days, though one study used 300 days67, and one study used information on volume doubling time to
calculate the patient’s expected time of death which was then compared with the typical life expectancy in
Japan to determine if the cancer was overdiagnosed.68 Another study with unique methods among those
of lung cancer followed patients diagnosed with screen-detected clinical stage 1 lung cancer who did not
undergo surgical treatment and defined overdiagnosis as death from a cause other than lung cancer.69
Estimates of lung cancer overdiagnosis varied from“minimal” to 27% in these studies.
The two pathologic/imaging prostate cancer studies involved a total of 3093 patients and used
similar definitions of overdiagnosis based on Gleason score, negative surgical margins and other
criteria.41,70 Patients in both studies were undergoing radical retro-pubic prostatectomy for prostate cancer
Table 3: Summary Evidence Table of Pathologic and Imaging Studies
Study Cancer Type Study Period
Country # of cancers
Screening test Overdiagnosis Definition Results
Magnitude of Overdiagnosis (95% CI) Overall Risk of Bias Dominioni 201267
Lung 1997-2011
Italy 21
CXR VDT> 300 days 1/21 cancers had VDT > 300 days “minimal” Moderate
Lindell 200771 Lung
1999-2004
US 61
CT VDT>400 days 13/48 cancers had VDT>400 days 27% Moderate
Sobue 199269 Lung
1976-1989
Japan 42 CXR
Dying from a cause other than lung cancer in patients diagnosed with clinical stage 1 disease
20% of screen-detected patients died
from cause other than lung cancer “minimal” High Sone 200768
Lung 1996-1998
Japan 45 CT
Expected age of death (calculated from VDT) greater than average Japanese life expectancy
6 of 45 cases had expected death age
greater than Japan life expectancy 13.3% High Veronesi 201272
Lung 2004-2010
Italy 120
LDCT VDT>400 days 31/120 cases had VDT> 400 days
25.8% (18.3-34.6) Moderate Yankelevitz 200373 Lung Not provided US 87 CXR/sputum
cytology VDT> 400 days 4/87 cases had VDT> 400 days 5% High
Graif 200770 Prostate 1989-2005
US 2126 PSA
tumor volume <0.5 cm3, Gleason <7, organ-confined disease in RRP specimen with clear surgical margins
4.5% met criteria for overdiagnosis compared with 27% meeting criteria
for underdiagnosis 4.5% High
Pelzer 200841 Prostate 1999-2006 Austria 997 (806 screened, 161 unscreened) PSA
Gleason <7, pathologic stage of pT2a and negative surgical margins
16.8% of screened group and 7.9% of
Risk of Bias: Pathologic and Imaging Studies
As most pathologic and imaging studies did not have control groups, traditional selection bias and
confounding were not the key internal validity issues for these studies. However, many of the lung cancer
studies were unable to obtain complete follow-up information on their initial set of diagnosed cancers and
omitted certain patients from the analysis, increasing the risk for bias by arbitrarily cutting down an
already limited sample. The Sobue et al69study, which followed patients with stage 1 lung cancer to
determine causes of death, compared screen-detected patients to a control group of patients with
symptom-detected lung cancer who were matched by age within 5 years, sex and year of diagnosis. This
study had a high risk for selection bias and confounding because it did nothing to mitigate confounding
beyond matching, in addition to having low numbers and omitting several patients from the analysis.
Likewise, the Pelzer 2008 et al41study of prostate cancer compared overdiagnosis based on RRP
specimens from a screened group compared to an unscreened referred cohort without controlling for any
confounders. In a similar study, Graif and colleagues created a study group of “screened” individuals
based on three different sets of screening and biopsy criteria.70
While many studies had problems with incomplete data, selection bias, and confounding,
measurement bias was the major flaw in many of these pathologic and imaging studies. In the Sobue et al
study of lung cancer, verification of the cause of death was not convincingly valid and reliable as only 35
of 42 patients who died of lung cancer even had progression of their lung cancer verified in their medical
records.69 Yankelevitz et al73calculated volume doubling time for lung cancers with data obtained from
two different studies. For one study, individual data on tumor size was available, but for the other study
only the frequency distribution of tumor dimension and disease stage at the time of diagnosis was
available without data on individual tumor size, so the authors assumed the smallest tumors were the
stage 1 malignancies. We rated these two studies as having a high risk of measurement bias. The Graif et
al study of prostate cancer also had a high risk for measurement bias as different procedures were used
of measurement bias because they provided minimal information on how volume doubling time was
calculated and whether it was done in a valid and reliable way. Likewise, the final prostate cancer study
provided minimal information on the uniformity of the RRP procedures producing the study specimens
and had only one pathologist reading biopsies.41
Overall, three lung cancer studies had a high risk of bias68,69,73, and three had a moderate risk of
bias.67,71,72 Both prostate cancers studies had a high risk of bias.41,70
Strength of Evidence: Pathologic and Imaging Studies
Ratings for Risk of Bias and Strength of Evidence criteria for pathologic and imaging studies are
available in Appendix Table 5. Directness was poor for all pathologic and imaging studies, with one
exception, because the validity of the conclusions of the studies was contingent on the assumption that the
pathologic or imaging characteristics were directly correlated with cancer-related morbidity and mortality.
With the exception of Veronesi and colleagues72, no authors attempted to explain the linkage between the
pathologic or imaging characteristic and cancer progression or to justify the somewhat arbitrary cutoff
they had chosen as the definition of overdiagnosis. In contrast, directness was good for the Sobue et al
study69because this study followed untreated early stage cancer patients until death from cancer or
another cause, directly examining the link between cancer diagnosis and cancer death. Unfortunately, the
study’s methodologic flaws limit its usefulness. External validity was fair for the majority of studies
either due to European settings or to use of screening tests such as chest x-ray that are no longer relevant
to current screening discussions. Authors mostly did not provide confidence intervals for overdiagnosis
estimates so we were unable to determine precision. Based on a moderate to high aggregate risk of bias
along with poor directness, fair external validity, questionable precision and lack of consistency, we rated
Characteristics of Included Studies: Ecologic and Cohort Studies
A total of 21 ecologic and cohort studies were included in this review, the full details of which
are available in Appendix Table 6. Table 4 provides the summary details of 19 of these studies, 17 of
breast and two of prostate cancer overdiagnosis. Two additional prostate cancer cohort studies74,75are not
included in the summary table because they do not share many of the relevant issues, but these studies are
listed in the full appendix table. Of the breast cancer studies, one took place in the United States30and
one in New South Wales, Australia76, with the rest being performed in European countries. The majority
of these studies were ecologic studies in European countries, but several were cohort studies that took
advantage of population-based registries to track large numbers of individuals for their screening
experiences and cancer outcomes. The screening programs were fairly comparable between studies,
tending to involve biennial mammography most commonly for women ages 50 to 69 years. One study
looked only at younger women ages 40 to 49 years77, and a few included some screening extended to
women in their seventies.78,79
The breast cancer studies used several variations of unscreened reference populations in
comparison with the screened populations studied. Most studies modeled the continuation of the
pre-screening period incidence trend throughout the pre-screening period with linear regression as the reference.
A few studies77,80,81took advantage of the fact that screening programs were introduced gradually
throughout certain countries and were able to use contemporary counties where screening had not yet
been introduced as the reference population. One study used historical age-matched cohorts as the
reference.79 Another two studies used a combination of three control groups, including a contemporary
unscreened group and historical groups in the regions with and without screening, in an effort to control
for differences in baseline incidence trends between geographic areas.82,83Finally, two studies compared
screening program attenders to non-attenders as the reference group.46,84 The magnitude of overdiagnosis
reported in breast cancer ecologic and cohort studies was highly variable and ranged from 1% to 76%,
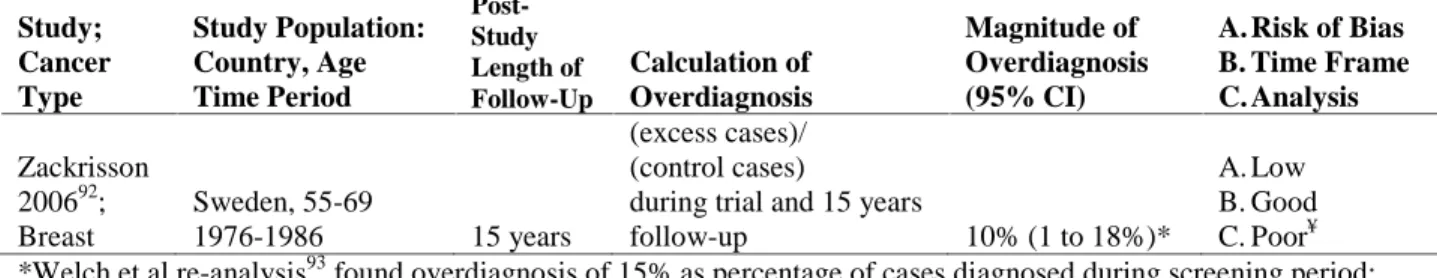
Table 4: Summary Evidence Table of Ecologic and Cohort Studies Study Cancer Type Study Design Study Population: Country Ages Time Period Reference Population Adjustment for Confounders Management of Lead Time
Calculation of Overdiagnosis
Magnitude of Overdiagnosis (95% CI)
**does not include DCIS
A. Risk of Bias B. Timeframe C. Analysis
Bleyer 201230 Breast Ecologic US 40+ 1976-2008 Pre-screening trend (1976-8) HRT, baseline increasing incidence Steady-state screening (excess cases)/ (observed cases)
during screening 31%
A. Moderate B. Good C. Good
Duffy 201078 Breast Cohort and Ecologic Sweden 50-60 1977-98; UK 47-73 1989-2003 Calculated from Swedish 2-County control; UK: Pre-screening trend (1974-89) Swedish: Unclear UK: Baseline changes in incidence Swedish: excluded prevalence screen UK: unclear
Based on complex calculation
Swedish: 12%¥ UK: 2.3 per 1000 screened for 20 years
A. Moderate B. NA C. Poor Falk 201384
Breast Cohort Norway 50-69 1995-2009 Screening program non-attenders Age, county, calendar year 10-year FU post-screening (excess cases)/ (expected cases)
during screening 19.4% (11.8-27.0)
A. High B. Good C. Good Hellquist
201277, breast Ecologic Sweden 40-49 1986-2005 Contemporary counties w/o screening Differences in baseline incidence trends Statistical adjustment (excess cases)/ (expected cases) during screening
1% (-6 to 8%) [16% w/o lead time adjustment]
A. Moderate B. NA C. Poor
Jorgensen 2009 (BMJ)85 Breast Ecologic UK: 50-64 (1993-1999) CA:50-69 (1995-2005) NSW: 50-69 (1996-2002) Sweden: 50-69 (1998-2006) Norway:50-69 (2000-2006) Pre-screening trend (UK 1971-84, CA 1970-78, NSW 1972-87, Sweden 1971-85, Norway 1980-94) Baseline increasing incidence
Up to 7-year FU post-screening
(excess cases)/ (expected cases) during screening
UK: 57% (53-61%) CA: 44% (25-65%) NSW: 53% (44-63%)
Sweden: 46% (40-52%)
Norway: 52% (36-70%) Meta-analysis: 52% (46-58%) A. Moderate B. Fair C. Good Jorgensen 2009(BMC)80 Breast Ecologic Denmark 50-69 1991-2003 Contemporary counties w/o screening Age and differences in baseline incidence trends
Up to 10-12 years FU post-screening
(excess cases)/ (expected cases)
during screening 33%
A. Moderate B. Fair C. Good
Junod 201179 Breast
France 50-79
Age-matched
historical cohorts HRT, alcohol
excess cases)/ (expected cases)
Ages 50-64: 76% (67-85%) ** Ages 65-79: 23%
Study Cancer Type Study Design Study Population: Country Ages Time Period Reference Population Adjustment for Confounders Management of Lead Time
Calculation of Overdiagnosis
Magnitude of Overdiagnosis (95% CI)
**does not include DCIS
A. Risk of Bias B. Timeframe C. Analysis Kalager 201283 Breast Ecologic Norway 50-79 1996-2005 Contemporary counties w/o screening, and historical cohorts in screening region and w/o screening
Differences in baseline incidence trends
Including women up to 79 in incidence, w/ up to 10 years FU post-screening
(excess cases)/ (observed cases) during screening period, including women up to age 79
Entire country: 25% (19-31%) ** County w/10yrs follow-up: 18% (11-24%) **
A. Moderate B. Fair C. Poor Morrell
201076, breast Ecologic NSW, Aust. 50-69 1991-2001 Pre-screening trend (1972-90) HRT, obesity, and nulliparity Statistical adjustment (excess cases)/ (expected cases)
during screening 30% **
A. Moderate B. NA C. Poor
Njor 201382 Breast Cohort Denmark (Copenhagen /Funen) 56-79/59-78 1991/93-2009 Contemporary counties w/o screening, and historical cohorts in screening region and w/o screening
Differences in baseline incidence trends
Up to 8 years follow-up post-screening
(excess cases)/ (expected cases) during screening and 8-years post-screening
Copenhagen: 6% (-10 to 25%) Funen: 1% (-7 to 10%)
Pooled: 2.3% (-3 to 8%)
A. Moderate B. Fair C. Poor
Paci 200686 Breast Cohort Italy 50-74 1986-2006 (10-year period) Pre-screening trend Age Statistical adjustment (excess cases)/ (expected cases) during screening
4.6% (2-7%) after adjustment for lead time
36.2% (34-39%) before adjustment for lead time
A. Moderate B. NA C. Poor Peeters 198981 Breast Ecologic Netherlands 35+ 1975-86 Contemporary county w/o
screening None Did not
(excess cases)/ (expected cases)
during screening 11%
A. High B. Poor C. Poor
Puliti 200945 Breast Cohort Italy 60-69 1990-2005 Pre-screening trend (forced to
1.2% growth) Age
5-10 years FU post-screening
(excess cases)/ (expected cases) during screening and
5-years post-screening 1% (-5 to 7%)
A. Moderate B. Fair C. Poor
Puliti 201246 Breast Cohort Italy 60-69 1991-2007 Screening non-attenders Age, marital status, and area-level socio-economic status
5-14 years FU post-screening
(excess cases)/ (expected cases) during screening and
5-14 years post-screening 10% (-2 to 23%)
Study Cancer Type Study Design Study Population: Country Ages Time Period Reference Population Adjustment for Confounders Management of Lead Time
Calculation of Overdiagnosis
Magnitude of Overdiagnosis (95% CI)
**does not include DCIS
A. Risk of Bias B. Timeframe C. Analysis Svendsen 200687 Breast Ecologic Denmark 50-69 1991-2001 Pre-screening
trend (1979-90) Age Did not Not calculated
“None” (See appendix table) **
A. Moderate B. Poor C. Poor
Zahl 200488 Breast Ecologic Norway (N) 50-74 1995-2000 Sweden (S) 50-70 1986-2000 N: Pre-screening period (1991) S: Pre-screening trend (1971-85) Age
Up to 4 (N) and 14 (S) years FU post-screening
(excess cases)/ (expected cases) during screening
N: 56% (42-73%) increased incidence with no post-screening drop ** S: 45% (41-49%) increased incidence with 12% drop **
A. Moderate B. Poor (N)/ Fair (S) C. Good
Zahl 201289 Breast Ecologic Norway 50-79 1995-2009 Pre-screening trend (1991-5) Age, county, population growth and baseline incidence trend
Up to 14 years FU post-screening (excess cases)/ (expected cases) during screening Confirmed 50% incidence growth from Zahl 2004, with non-significant drop of 7% in women 70-74
A. Moderate B. Fair C. Good
Ciatto 200590 Prostate Cohort Italy 60-74 1991-2000 Contemporary counties w/o screening Age
7-9 year FU post-screening
(excess cases)/ (expected cases) during screening and
9-years post-screening 66% (40-100%)
A. Moderate B. Fair C. Poor Zappa 199891
Prostate Cohort/ Modeling
Italy 60 or 65 Not provided
Contemporary counties w/o
screening None
4 years FU post-screening
(excess cases)/ (expected cases) during screening and 4-years post-screening
age 60: 25% (19-32%)
age 65: 65% (58-73%)
A. Moderate B. Fair C. Poor Abbreviations: HRT, hormone replacement therapy; FU, follow up; w/o, without; CA, Canada; NSW, New South Wales;
¥