Sharif University of Technology
Scientia IranicaTransactions A: Civil Engineering www.scientiairanica.com
Layout optimization of double-layer grids using
modied genetic algorithm based on fuzzy inference
system
P. Torkzadeh
a, T. Jaari
band S. Shojaee
a;a. Department of Civil Engineering, Faculty of Engineering, Shahid Bahonar University of Kerman, Kerman, Iran. b. Department of Civil Engineering, Graduate University of Advanced Technology, Kerman, Iran.
Received 1 Jun 2014; received in revised form 11 November 2014; accepted 28 Jan 2015
KEYWORDS Optimization; Genetic algorithm; Space structures; Design space search; Fuzzy inference system.
Abstract. In weight optimizitaion of double-layer grids, various parameters, such as members cross-sectional areas, the height between two layers, structure meshing in two directions and the topology of the structure should be considered. In this study, for simultaneous optimization of size, shape and topology of double-layer grids, a genetic algorithm is employed and is modied based on the fuzzy inference system. First, to eciently search in design space at each stage, some solutions are generated in the neighborhood of the best sample, which enhances searching operation in the neighborhood of the optimum solution. Then, in order to achieve the possible solutions, penalties for violation of constraints, and the number of violated constraints are considered in order to choose the next generation. The value of objective function and the values of genetic algorithm parameters have a great eect on the result of the algorithm. For adaptive setting of these parameters, the fuzzy inference system is employed. The eciency of these improvements has been conrmed by presenting some examples of truss structures and comparison with the other algorithms.
c
2015 Sharif University of Technology. All rights reserved.
1. Introduction
Structural optimization means the design of structures, so that all the design criteria are considered while the structural weight or cost is minimum. In the recent years, many studies have been performed on meta-heuristic algorithms to reduce the mathematical calculations and to enhance the ability of nding the global solution. In order to improve the above mentioned, many studies have been done in the eld of structural optimization.
Lee and Geem proposed a new structural op-timization method by harmony search algorithm [1].
*. Corresponding author. Tel.: +98 3433222559; Fax: +98 3433220054
E-mail address: [email protected] (S. Shojaee)
Truss optimization was presented using Big Bang-Big Cranch method [2]. Kaveh and Shojaei optimized skeletal structures using ant colony algorithm [3]. Particle swarm optimization algorithm was used for structural design optimization [4]. Modied particle swarm optimization algorithms (PSO-HPSO-PSOPC) were presented for truss optimization [5]. DHPSACO approach was proposed by combination of Particle Swarm Optimization Passive Congregation (PSOPC), Ant Colony Optimization (ACO) and Harmony Search algorithm (HS) for truss optimization with discrete variables [6]. A two-stage method was presented using GA with discrete variables and was applied for optimization of truss structures [7]. Double-layer grids were optimized using back propagation neural networks [8]. Salajegheh and Gholizadeh performed optimization of space structures using modied genetic
algorithm and radial basis function neural network [9]. Gholizadeh et al. proposed shape optimization of double-layer grids using quantum behaved particle swarm optimization (QPSO) and neural networks [10]. Shape optimization of structures was implemented by sequential harmony search algorithm [11]. Also, layout optimization of truss structures was carried out by hybridizing cellular automata and particle swarm optimization [12].
In weight optimization of double-layer grids, structural design variables should be assigned so that the structure has a minimum weight. In this study, design variables such as members cross-sectional areas, thickness of the double layer, the structure meshing in two directions and topol-ogy of the structure are assigned using improved GA. Since optimization of every system consists of two basic steps including searching the design space and evaluation of the search vectors, in or-der to have a proper searching in design space, some improvements are applied on optimization algo-rithm.
2. Formulation of the optimization problem The optimization problem of truss structures is dened in general form by Eq. (1) in which all the design constraints are satised, and the total weight of the structure has the lowest value [13]:
minimize : W (fXg) =Xn
i=1
iAiLi
subjected to : gi(fXg) 0; i = 1; 2; :::; m
hi(fXg) 0; j = 1; 2; :::; k
fXLg fXg fXug; (1)
where W (fXg) is total weight of the structure (objec-tive function), n is the number of structural elements, hi and gi are the design constraints. Some of the
design constraints in structures are limitation of the stress, elements slenderness and node displacements. XL and Xu are the upper and the lower bounds of
variations.
Since the genetic algorithm is used in unconstraint optimization problems, in this study, penalty function method is employed to transform the constrained func-tion to unconstrained funcfunc-tion. In penalty funcfunc-tion, if the constraints are in the allowable range, the penalty rate will be zero. Otherwise, the penalty rate is obtained from the following equations [14]:
8 > > < > > : min
i i maxi ) i= 0
i< min or i> max ) i=i
max=min i
max=min i
i = 1; 2; :::; m (2)
8 > > < > > : min
j j jmax ) j= 0
j< minor j> max ) j= j
max=min j
max=min j
j = 1; 2; :::; k
(3) 8 > > < > > : min
n n maxn ) n= 0
n< min or n> max ) n=n
max=min n
max=min n
n = 1; 2; :::; p (4) AFWk = "
1Wk+ "2 k+ k + k
"3; (5)
where max = mini and i are, respectively, the existing
stress and the allowable stress in ith member; max=minj and j are, respectively, the existing and the
allow-able displacement of jth node; max=minn and n are,
respectively, the existing and the allowable slenderness of the ith member; k
; k and k are the summation
of the penalties calculated for stress, displacement and slenderness constraints, respectively; and "1, "2and "3
are coecients of the penalty function. In this study, "1
and "3are equal to 1, and "2is obtained from Eq. (6).
AFWkis additional function due to addition of penalty
to the weight of the structure.
"2= 0:015 W i < 2 W; (6)
where W is the weight of the structure, and i is the number of iteration loops in optimization process. The coecient of penalty function, "2, is directly
proportional to the number of iteration loops and W i is relatively a high value. For reduction of the penalty coecient, the value of 0.015, which is the optimal value obtained by optimization of several truss structures, is used. The 0:015 W i value considers a smaller penalty in initial stages of the optimization and increases subsequently by increasing the number of iteration loops. This procedure results in a better search of the algorithm. To avoid a large penalty value in higher loops, the penalty value is limited to the 2W value.
3. Genetic algorithm
Genetic algorithm is one of the optimization methods which is a member of the large family of evolution-ary algorithms. This algorithm establishes a search method by natural inheritance principle of survival of the stronger members and analyzing the members to create better members. In this algorithm, variables
are encoded by means of numerical strings in binary system, which are called genes. By taking together the strings of each variable, xed-length string is gen-erated which is called chromosome. Each chromosome represents a solution point in the search space. In this algorithm, the initial population is randomly selected, and by evaluating the chromosomes, calculating the tness function by Eq. (7), selecting the parents, and applying host and mutation operators, new children are generated. Using the tness of the chromosomes, the population of the next generation is selected. The algorithm will continue to approach a convergence [15].
Fi= exp
AFWi
AFWmax+ 1
; i = 1; 2; :::; n; (7) where n is the number of members of current pop-ulation, Fi is a parameter which shows the level of
ith members tness, and is a selection pressure coecient.
3.1. Improvement of search space in genetic algorithm
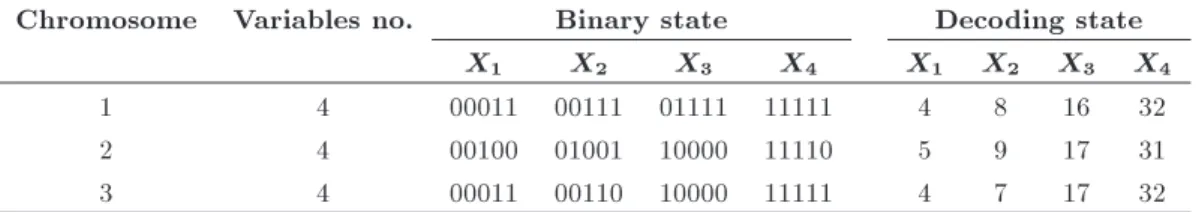
Fundamental characteristic of meta-heuristic algo-rithms is to search in the design space. Depending on the manner of searching the space, algorithms exhibit dierent performance. The more appropriate the manner of searching the space, the more the likelihood of achieving the optimum solution increases. One of the drawbacks of GA is unsuccessful mutations. For example, if the problem has four variables, according to Table 1, and chromosome 1 is the best possible solution, and chromosomes 2 and 3 are random chro-mosomes obtained in the algorithm implementation process, objective function value will be near to the global optimum. Applying several dierent mutations indicates that there is a little chance to reach the nal optimum. Sample space variables are as follows:
X = [1; 2; 3; :::; 31; 32] : (8) It is to be noted that the values of Xi (i = 1; 2; :::; 4)
(all chromosomes are in the neighborhood of each other, but comparison between chromosomes 1 and 2 and chromosomes 1 and 3 shows that to transform chromosome 2 to chromosome 1, the number of 12 bits and to transform chromosome 3 to chromosome 1, 6 bits of chromosomes should be changed. This case is
less likely to occur. To solve this problem, the method of generating new children in the neighborhood of the best solution is used. In this method, after nding the optimal chromosome at the end of iteration, sampling interval for each variable by using Eq. (9) is reduced, and new children are randomly generated from the given distance interval.
number( l
i); number( ui)
=hnumberXi[fav] ; numberXi[fav]+i; (9)
where Xi[fav] i = 1; 2; 3; 4 is the value of chromosome variables with the highest tness; numberXi[fav] is the number corresponding to Xi[fav] from variable search space; number ( l
i) and number ( ui) are,
respectively, the upper and the lower bound number of variable search space, and is the distance coecient which is assumed to be equal to 1. For example, since for chromosome 2 the value and its corresponding number in selected sampling interval are the same, sampling interval based on = 1 for chromosome 2 variables is obtained as follows:
number( l
1); number( u1)
= [5 1; 5 + 1] = [4; 6]
number( l
2); number( u2)
= [9 1; 9 + 1] = [8; 10]
number( l
1); number( u1)
= [17 1; 17 + 1]
= [16; 18];
number( l
1); number( u1)
= [31 1; 31 + 1]
= [30; 32]: (10) The sampling interval should be in the range of initial sampling interval. It is clear that the global optimum is located at a distance of the above sampling intervals. So, if the sampling of chromosomes is randomly gener-ated, the probability of obtaining the global optimum is high. This method improves the algorithm search in the obtained optimal neighborhood.
Table 1. Sample of chromosomes.
Chromosome Variables no. Binary state Decoding state
X1 X2 X3 X4 X1 X2 X3 X4
1 4 00011 00111 01111 11111 4 8 16 32
2 4 00100 01001 10000 11110 5 9 17 31
3.2. Using possible solutions to choose the next generation
In large-scale structures, due to the long duration of structural analysis and duration of obtaining the nal optimum, the priority is to achieve the results that can satisfy all the constraints. In this study, in addition to considering the tness function, in case of violation of the constraints, the following three rules are used to select the next generation.
1. Every possible solution is preferred to impossible solution.
2. Between two possible solutions, the solution which has a better objective function will be chosen.
3. Between two impossible solutions, the solution which violates fewer constraints will be accepted.
This procedure makes the algorithm dependent on the number of violated constraints in addition to its dependence on objective function. Since the solution obtained by the algorithm must satisfy all the required constraints, the algorithm is greatly conducted to the possible solutions by using penalty function and the above three rules.
3.3. Modifying the parameters of GA using fuzzy inference system
Selection of GA parameters and the manner to control them have a great inuence to nd the best solution. Maintaining the population diversity in GA prevents the premature convergence and also increases the likelihood of achieving the optimum solution. During the implementation of the algorithm with respect to the mean variance of tness value, selection pressure coecient, percent of elite population and mutation rate are determined dynamically using fuzzy inference system to increase the chances of nding the best solu-tion of algorithm. As the algorithm parameters change at each iteration, the adaptation feature of algorithm parameters reduces. As a result, the algorithm param-eters should be kept constant for a specic number of iterations (12 iterations in this study). Based on the algorithm performance (mean value of tness of iterations) in this number of iterations, mutation rate of previous stage and iteration loop counters, algorithm parameters (selection pressure coecient, percent of elite population and mutation rate) are computed.
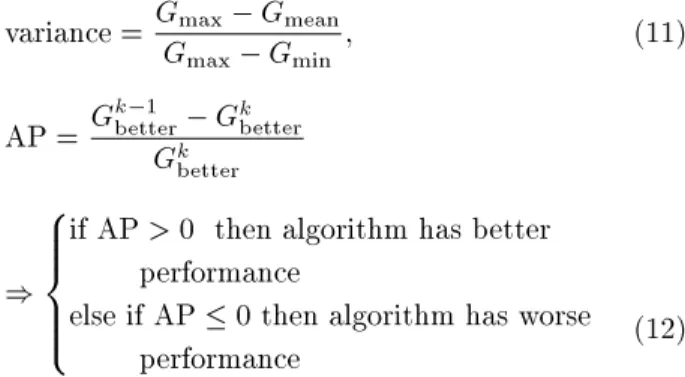
Eq. (10) is used to calculate the variance, and Eq. (11) is employed to determine the improvement of algorithm performance by specic number of iterations. In this equation, if the obtained value is a number greater than zero, the algorithm has been improved or the algorithm has a better performance; otherwise the algorithm has a worse performance.
variance = Gmax Gmean
Gmax Gmin ; (11)
AP = Gk 1better Gkbetter
Gk better
) 8 > > > < > > > :
if AP > 0 then algorithm has better performance
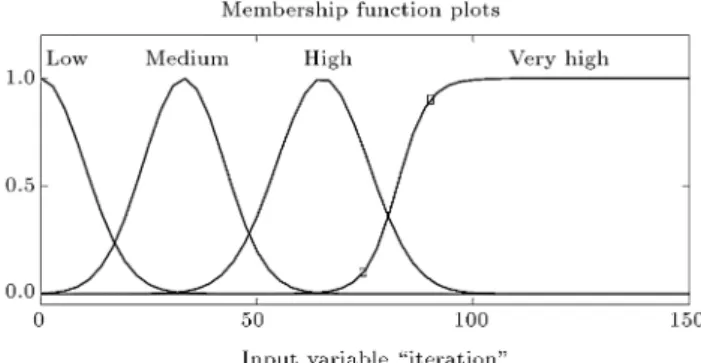
else if AP 0 then algorithm has worse performance (12) The membership functions are dened using triangular, trapezoidal, Gaussian and bell-shaped function. Input and output membership functions are illustrated in Figures 1-7.
If-Then rules are used to formulate the fuzzy conditional statements. The fuzzy rules are given in
Figure 1. Input membership function of mean-variance.
Figure 2. Input membership function of previous iteration mutation rate.
Figure 3. Input membership function of improved algorithm.
Figure 4. Input membership function of loop counters.
Figure 5. Output membership function of selection pressure coecient.
Table 2. All the rules are combined with \and" logical operator. Phase-eld model has been used for inference system. For defuzzication of the fuzzy output, the centroid method is employed.
Figure 6. Output membership function of elite population percent.
Figure 7. Output membership function of mutation rate.
4. Simultaneous optimization of size, shape, and topology of double-layer grids
In double-layer grids, various parameters, such as the member cross-sectional areas, the height between
Table 2. If-Then rules used for fuzzy inference system.
Input Output
Ave vara APb Muc Itd Beta Pee Mu
Low - - Not very high High High
-Medium - - Not very high Medium Medium
-High - - - Low Low
-- Worse Medium Low - - High
- Worse Medium Medium - - High
- Worse Medium High - - High
- Worse Medium Very high - - High
- Worse High Low - - Medium
- Worse High Medium - - Medium
- Worse High High - - Medium
- Worse High Very high - - Medium
- Worse Low Low - - Medium
- Worse Low Medium - - Medium
- Worse Low High - - Medium
- Worse Low Very high - - Low
- Better Medium - - - Medium
- Better High - - - High
- Better Low - - - Low
aAve var = Average variance;bAP = Algorithm performance;cMu = Mutation; dIt = Iteration; andePe = Percent of elite.
two layers, the structure meshing in two directions and topology of the structures are necessary which should be assigned to optimize the weight of the structure and satisfy all the design constraints. In this study, the mentioned variables are considered as design variables. Structural members and the nodes are grouped to achieve the desired results and to reduce the design space. In grouping the lower layer nodes, the geometrically symmetrical grouping is considered. The members are grouped based on internal forces which obtain from FE analysis in each iteration. Allowable domain of considered constraints during the optimization process is obtained from the following equations:
1. Stress constraints [16]:
i= 0:6Fy (for tensional members) (13)
i= c (for compressive members) (14)
c=
8 > > > > > > < > > > > > > :
h 1 2i
2C2 c
Fy
i =5
3+8C3ic
3 i
8C3 c
for i< Cc 122E
23 for i Cc
Cc=
q
22E
Fy
(15)
In the above equations, Fy is the yield stress of
material, E is the modulus of elasticity, Cc is the
boundary slenderness between elastic and inelastic buckling, and is slenderness ratio of the members.
2. Slenderness ratio constraints [16]:
i= KiLi=ri 300 (for tensional members)
(16) i= KiLi=ri 200 (for compressive members)
(17) where ri is radius of gyration, and Ki is buckling
length coecient of ith member. In truss struc-tures, the member buckling length coecient (Ki)
is considered equal to unit.
3. Displacement constraints: the maximum displace-ment for double-layer grids is of small span.
To take into account the structural stability, where determinant of the structural stiness matrix is equal to zero, a large penalty value is assigned to the structures to avoid the selection of unstable structures in the next stages of the algorithm.
5. Numerical examples
In order to verify the eciency of the proposed method, two examples of truss structures are discussed and
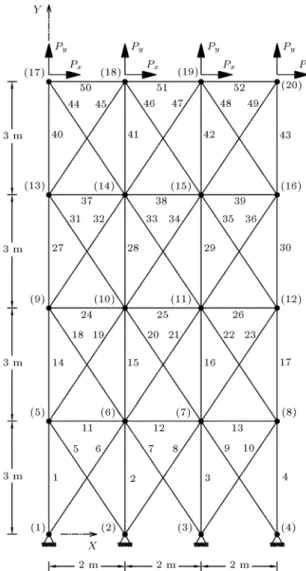
Figure 8. 52-bar planar truss structure.
then, one example of simultaneous optimization of the size, shape, and topology of space structures is presented. In all examples presented, 85 percent of the next generation chromosomes are obtained using host and mutation operators, and the remaining 15 percent are obtained through the generation of new chromosomes in the neighborhood of optimum sam-ple.
5.1. Size optimization of a 52-bar planar truss structure
A 52-bar planar truss structure, shown in Figure 8, had been investigated by many researchers [6,7,17,18]. Members of this structure are divided to 12 groups: (1) A1 A4, (2) A5 A10, (3) A11 A13, (4) A14
A17, (5) A18 A23, (6) A24 A26, (7) A27 A30,
(8) A31 A36, (9) A37 A39, (10) A40 A43, (11)
A44 A49, and (12) A50 A52. The mass density of
materials is 7860 kg/m3, and the elasticity modulus is
2:07 105MPa. The members have a stress limitation
of 180 MPa. The loads Px = 100 kN and Py =
Table 3. List of the available cross sectional areas for 52-bar planar truss structure (in2).
A1 A2 A3 A4 A5 A6 A7 A8 A9 A10
0.111 0.141 0.196 0.25 0.307 0.391 0.442 0.563 0.602 0.766
A11 A12 A13 A14 A15 A16 A17 A18 A19 A20
0.785 0.994 1 1.228 1.266 1.457 1.563 1.62 1.8 1.99
A21 A22 A23 A24 A25 A26 A27 A28 A29 A30
2.13 2.38 2.62 2.63 2.88 2.93 3.09 1.13 3.38 3.47
A31 A32 A33 A34 A35 A36 A37 A38 A39 A40
3.55 3.63 3.84 3.87 3.88 4.18 4.22 4.49 4.59 4.8
A41 A42 A43 A44 A45 A46 A47 A48 A49 A50
4.97 5.12 5.74 7.22 7.97 8.53 9.3 10.85 11.5 13.5
A51 A52 A53 A54 A55 A56 A57 A58 A59 A60
13.9 14.2 15.5 16 16.9 18.8 19.9 22 22.9 24.5
A61 A62 A63 A64
26.5 28 30 33.5
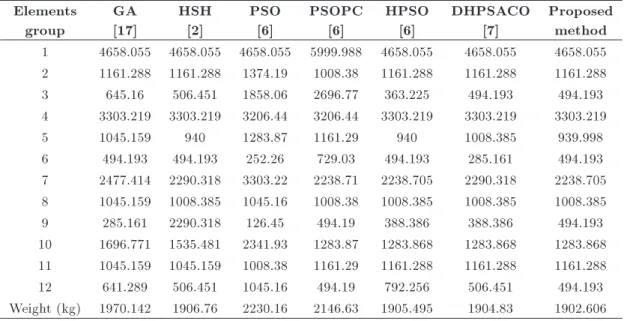
Table 4. Comparison of optimal designs for 52-bar planar truss structure. Elements
group
GA [17]
HSH [2]
PSO [6]
PSOPC [6]
HPSO [6]
DHPSACO [7]
Proposed method 1 4658.055 4658.055 4658.055 5999.988 4658.055 4658.055 4658.055 2 1161.288 1161.288 1374.19 1008.38 1161.288 1161.288 1161.288 3 645.16 506.451 1858.06 2696.77 363.225 494.193 494.193 4 3303.219 3303.219 3206.44 3206.44 3303.219 3303.219 3303.219
5 1045.159 940 1283.87 1161.29 940 1008.385 939.998
6 494.193 494.193 252.26 729.03 494.193 285.161 494.193 7 2477.414 2290.318 3303.22 2238.71 2238.705 2290.318 2238.705 8 1045.159 1008.385 1045.16 1008.38 1008.385 1008.385 1008.385 9 285.161 2290.318 126.45 494.19 388.386 388.386 494.193 10 1696.771 1535.481 2341.93 1283.87 1283.868 1283.868 1283.868 11 1045.159 1045.159 1008.38 1161.29 1161.288 1161.288 1161.288 12 641.289 506.451 1045.16 494.19 792.256 506.451 494.193 Weight (kg) 1970.142 1906.76 2230.16 2146.63 1905.495 1904.83 1902.606
set of cross sections are selected from Table 3 for the design variables. The results obtained from the best 20 implementations and the results of previous studies are given in Table 4.
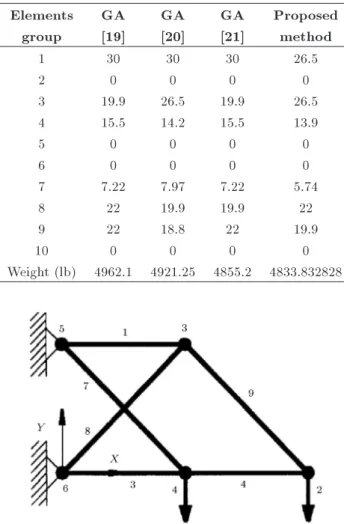
5.2. Size and topology optimization of a 10-bar planar truss structure
A 10-bar planar truss structure, shown in Figure 9, has been investigated by many researchers [19,21]. Variables considered in this example are the members cross sectional areas and the presence or absence of structural members. The load of 100 kips is applied at nodes 2 and 4 in the vertical direction. Mass density of materials is 0:1 lb/in3 and the elasticity
modulus is 107 psi. The members have a stress
limitation of 25000 Psi. All nodes in y-direction have
a displacement limitation of 2.05 in. Cross sections for the design variables are selected from Table 5. The results obtained from the best 20 implementations and
Table 5. List of the available cross sectional areas for 10-bar planar truss structure. No. Area (in2) No. Area (in2) No. Area (in2) No. Area (in2)
1 1.62 9 3.63 17 5.74 25 16
2 1.8 10 3.84 18 7.22 26 18.8
3 2.38 11 3.87 19 7.97 27 19.9
4 2.62 12 4.18 20 11.5 28 22
5 2.88 13 4.49 21 13.5 29 22.9
6 3.09 14 4.8 22 13.9 30 26.5
7 3.13 15 4.97 23 14.2 31 30
8 3.38 16 5.12 24 15.5 32 33.5
the results of previous studies are given in Table 6. Figure 10 shows the optimized structure.
5.3. A double-layer grid with 57m57m dimensions
A double-layer grid with 57m57m dimensions is selected. The members cross sectional areas, the height between two layers, the number of meshes in the
x-Table 6. Comparison of optimal designs for the 10-bar planar truss structure.
Elements GA GA GA Proposed
group [19] [20] [21] method
1 30 30 30 26.5
2 0 0 0 0
3 19.9 26.5 19.9 26.5
4 15.5 14.2 15.5 13.9
5 0 0 0 0
6 0 0 0 0
7 7.22 7.97 7.22 5.74
8 22 19.9 19.9 22
9 22 18.8 22 19.9
10 0 0 0 0
Weight (lb) 4962.1 4921.25 4855.2 4833.832828
Figure 10. The optimum topology obtained for the 10-bar planar truss structure.
and y-direction and the presence or absence of nodes of the lower layer are considered as the design variables. The characteristics of the design variables are selected from Tables 7 and 8. The nodes around the lower grid are assumed to be connected to the supports. The elasticity modulus of steel is 2:1106kg/cm2and mass
Table 7. Characteristics of the shape variables for double-layer grid.
No.
No. of meshes in x-direction
No. of meshes in y-direction
Diameter of layer
(m)
1 25 25 5.25
2 23 23 5
3 21 21 4.75
4 20 20 4.5
5 19 19 4.25
6 17 17 4
7 15 15 3.75
8 14 14 3.5
Table 8. List of the available proles for double-layer grid.
No. ODa Tb No. OD T No. OD T
1 4.83 0.26 12 11.43 0.36 23 21.91 0.45 2 6.03 0.29 13 13.3 0.4 24 21.91 0.45 3 7.61 0.29 14 13.3 0.4 25 24.45 0.63 4 7.61 0.29 15 13.97 0.4 26 24.45 0.63 5 8.89 0.32 16 13.97 0.4 27 27.3 0.63 6 8.89 0.32 17 15.9 0.45 28 27.3 0.63 7 10.16 0.36 18 15.9 0.45 29 32.39 0.71 8 10.16 0.36 19 16.86 0.45 30 35.56 0.8 9 10.8 0.36 20 16.86 0.45 31 40.64 0.88 10 10.8 0.36 21 19.37 0.45 32 45.72 1 11 11.43 0.36 22 19.37 0.45
density is 7850 kg/m2and external uniform distributed
load is assumed to be 180 kg/m2. The results obtained
from the best 20 implementations and the results of previous studies are given in Tables 9 and 10. Figure 11 shows the optimized structure.
Figure 11. The topology obtained for double-layer grid with 57m57m dimensions: (a) Double-layer grid; (b) upper layer; (c) diagonal layer; and (d) lower layer.
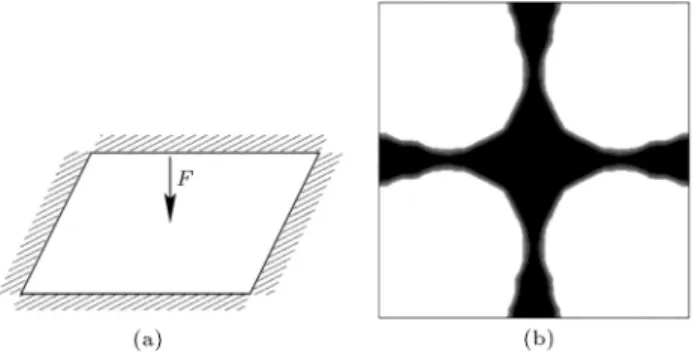
The topology obtained for double-layer grid in terms of structural engineering is remarkable, because this optimum topology is similar to the plate topology demonstrated in Figure 12 which is obtained from Ref. [23].
6. Conclusions
In this study, in order to achieve the ecient results for optimization of truss structures, genetic algorithm has been improved. First, the design space has been eciently searched in the neighborhood of optimum solution by generating the new samples in the neigh-borhood of the best obtained sample. For selecting the next generation, in addition to considering the tness function of population, the possible solutions have also been considered. This makes the algorithm to have possible solutions which satisfy the constraints,
Figure 12. Topology optimization of plate: (a) Base structure; and (b) optimum structure.
Table 9. Comparison of optimal designs for double-layer grid. ACO
[22]
MMA-ACO
[22] Proposed method
The best weight (kg)
The best
weight (kg) Runs no.
Average weight (kg)
The best weight (kg)
Size optimization 97335 97335 - -
-Size & topology optimization 85036 81927 - -
-Size, shape & topology optimization - - 3 76204.47 73960.453 Table 10. Optimal characteristics for double-layer grid.
MMA-ACO (size & topology) [22]
GA (size, shape & topology)
Mesh no. in x-direction 19 14
Mesh no. in y-direction 19 14
Height between two layers 450 500
No. of groups of compressive members 14 12
No. of groups of tensional members 3 5
No. of nodes in initial topology 841 481
No. of nodes in optimized topology 653 410
No. of elements in initial topology 3200 1800
so that there is no need to run again. This subject looks essential in large-scale structures which require a lot of analysis time. Also, adaptive setting of genetic algorithm parameters, based on fuzzy inference system, causes improvement of the algorithm to achieve the optimum solution and to avoid the premature convergence.
Ecient selection of design variables in double-layer grids has a great inuence on the weight of the structure. The most eective variables in double-layer grids are the height between two layers, the structure meshing in two directions, presence or absence of nodes and the members cross sectional areas. For this purpose, simultaneous optimization of size, shape and topology of double-layer grids has been performed using the mentioned modications on GA. The results demonstrate that the proposed method for optimum design of double-layer grids is ecient and can be used in practical problems.
References
1. Lee, K.S. and Geem, Z.W. \A new structural optimiza-tion method based on the harmony search algorithm", Computers & Structures, 82(9), pp. 781-798 (2004). 2. Camp, C.V. \Design of space trusses using Big
Bang-Big crunch optimization", Journal of Structural Engi-neering, 133(7), pp. 999-1008 (2007).
3. Kaveh, A. and Shojaee, S. \Optimal design of skeletal structures using ant colony optimization", Interna-tional Journal for Numerical Methods in Engineering, 70(5), pp. 563-581 (2007).
4. Perez, R.E. and Behdinan, K. \Particle swarm ap-proach for structural design optimization", Computers & Structures, 85(19), pp. 1579-1588 (2007).
5. Li, L.J., Huang, Z.B. and Liu, F. \A heuristic particle swarm optimization method for truss structures with discrete variables", Computers & Structures, 87(7), pp. 435-443 (2009).
6. Kaveh, A. and Talatahari, S. \A particle swarm ant colony optimization for truss structures with discrete variables", Journal of Constructional Steel Research, 65(8), pp. 1558-1568 (2009a).
7. Dede, T., Bekiroglu, S. and Ayvaz, Y. \Weight min-imization of trusses with genetic algorithm", Applied Soft Computing, 11(2), pp. 2565-2575 (2011).
8. Kaveh, A. and Servati, H. \Design of double-layer grids using backpropagation neural networks", Computers & Structures, 79(17), pp. 1561-1568 (2001).
9. Salajegheh, E. and Gholizadeh, S. \Optimum design of structures by an improved genetic algorithm using neural networks", Advances in Engineering Software, 36(11), pp. 757-767 (2005).
10. Gholizadeh, S., Torkzadeh, P. and Jabarzadeh, S. \Optimum shape design of double-layer grids by quan-tum behaved particle swarm optimization and neural
networks", International Journal of Optimization in Civil Engineering, 3(1), pp. 85-98 (2013).
11. Gholizadeh, S. and Barzegar, A. \Shape optimization of structures for frequency constraints by sequential harmony search algorithm", Engineering Optimiza-tion, 45(6), pp. 627-646 (2013).
12. Gholizadeh, S. \Layout optimization of truss struc-tures by hybridizing cellular automata and particle swarm optimization", Computers & Structures, 125, pp. 86-99 (2013).
13. Kirsch, U., Optimum Structural Design: Concepts, Methods, and Applications, McGraw-Hill New York (1981).
14. Kaveh, A. and Talatahari, S. \Size optimization of space trusses using Big Bang-Big crunch algo-rithm", Computers & Structures, 87(17), pp. 1129-1140 (2009b).
15. Nezamabadi-pour, H., Genetic Algorithm: The Basic Concept and Advanced Topics, Shahid Bahonar Uni-versity of Kerman (2010).
16. AISC Manual, American institute of steel construction (2005).
17. Wu, Sh.J. and Chow, P.T. \Steady-state genetic algo-rithms for discrete optimization of trusses", Computers & Structures, 56(6), pp. 979-991 (1995).
18. Lee, K.S., Geem, Z.W., Lee, S.H. and Bae, K.W. \The harmony search heuristic algorithm for discrete structural optimization", Engineering Optimization, 37(7), pp. 663-684 (2005).
19. Rajan, S.D. \Sizing, shape, and topology design opti-mization of trusses using genetic algorithm", Journal of Structural Engineering, 121(10), pp. 1480-1487 (1995).
20. Tang, W., Tong, L. and Gu, Y. \Improved genetic algorithm for design optimization of truss structures with sizing, shape and topology variables", Interna-tional Journal for Numerical Methods in Engineering, 62(13), pp. 1737-1762 (2005).
21. Rahami, H., Kaveh, A. and Gholipour, Y. \Sizing, geometry and topology optimization of trusses via force method and genetic algorithm", Engineering Structures, 30(9), pp. 2360-2369 (2008).
22. Mashayekhi, M. \Reliability-based topology optimiza-tion of space structures using advanced optimizaoptimiza-tion methods", Ph.D. Thesis, Shahid Bahonar University of Kerman (2011).
23. Luo, Y., Kang, Z., Luo, Z. and Li, A. \Continuum topology optimization with non-probabilistic reliabil-ity constraints based on multi-ellipsoid convex model", Structural and Multidisciplinary Optimization, 39(3), pp. 297-310 (2009).
Biographies
Peyman Torkzadeh is Assistant Professor of De-partment of Civil Engineering, Faculty of Engineer-ing, Shahid Bahonar University of Kerman. He has
over 50 papers in various journals and conferences. His researches have been in structural optimization, numerical modeling and seismic design of structures, structural health monitoring and structural damage detection.
Taghi Jaari received his MSc degree in Structural Engineering from Graduate University of Advanced Technology, Kerman, in 2013. His research interests include metaheuristic optimization techniques. He has published a number of papers in journals.
Saeed Shojaee obtained his BS degree from Shahid Bahonar University of Kerman, in 2001, and his MS and PhD degrees in Structural Engineering from Iran University of Science and Technology in 2003 and 2007, respectively. He is currently Associate Professor in the Department of Civil Engineering at Shahid Bahonar University in Kerman, Iran. His main research interests include: optimal analysis and design of structures, metaheuristic optimization techniques and applications, computational mechanics and seismic design of structures.