ISSN: 2252-8938, DOI: 10.11591/ijai.v9.i3.pp561-568 561
Source localization of tone perception in alcoholic brain indexed
by standardized low-resolution electromagnetic tomography
Vachrintr Sirisapsombat1, Phakkharawat Sittiprapaporn2, Chaiyavat Chaiyasut3, Sasithorn Sirilun4,Roungsan Chaisricharoen5, Thamthiwat Nararatwanchai6
1,2,5Brain Science and Engineering Innovation Research Group, Mae Fah Luang University, Thailand 1,2Neuropsychological Research Laboratory, School of Anti-Aging and Regenerative Medicine
Mae Fah Luang University, Bangkok, Thailand
3,4 Innovation Center for Holistic Health, Nutraceuticals and Cosmeceuticals, Faculty of Pharmacy
Chiang Mai University, Chiang Mai, Thailand
5School of Information Technology, Mae Fah Luang University, Chiang Rai, Thailand 6School of Anti-Aging and Regenerative Medicine, Mae Fah Luang University, Bangkok, Thailand
Article Info ABSTRACT
Article history: Received May 4, 2020 Revised Jun 18, 2020 Accepted Jul 12, 2020
Alcohol consumption is known to associate with several diseases, injuries, and social problems. The long-term, excessive alcohol exposure can lead to liver cirrhosis and pancreatitis. After repating alcohol exposure, alcohol dependence would develop an individually behavioral, cognitive, and physiological phenomenon. Previous studies indicated that although the left hemisphere was selectively employed for processing linguistic information irrespectively of acoustic cues or subtype of phonological unit, the right hemisphere was employed for prosody-specific cues. These previous studies provided the impetus for future investigations of tone perception and temporal integration differences in tonal brain speaker who had long-term, excessive alcohol exposure such as Thai in the present study. The present study used both an auditory mismatch negativity (MMN) component of event-related potentials (ERPs) recording and the standardized Low-resolution Electromagnetic Tomography (sLORETA) techniques to measure the degree of cortical activation and to localize the brain area contributing to the scalp recorded auditory MMN component during the passive oddball paradigm. Ten healthy right-handed adults participated in this study. The findings showed that both [kha:] - mid tone perception and
[khá:] - high tone perception elicited a strong MMN between 215-284 ms
with reference to the standard-stimulus ERPs. Source localization was obtained in the middle temporal gyrus of the right hemisphere for both [kha:] - mid tone perception and [khá:] - high tone perception. Automatic
detection of tone perception in alcoholic tonal brain is a useful index of language universal auditory memory traces.
Keywords: Alcoholic Brain
Mismatch negativity sLORETA
Tone
This is an open access article under the CC BY-SA license.
Corresponding Author: Phakkharawat Sittiprapaporn,
Neuropsychological Research Laboratory, Department of Anti-Aging and Regenerative Science, School of Anti-Aging and Regenerative Medicine,
Mae Fah Luang University, Bangkok, Thailand. Email: [email protected]
1. INTRODUCTION
Alcohol consumption is associated with several diseases, injuries, and social problems. It is a significant cause of cancer of the mouth, esophagus, and larynx. The long-term, excessive alcohol
exposure can lead to liver cirrhosis and pancreatitis. Moreover, gastritis, diabetes, and hypertension, and depression seem to be provoked even by occasional and short-term alcohol exposure [1-2]. Several previous studies demonstrated that gut dysbiosis, an imbalance of the intestinal microbiome, cause several diseases including diabetes mellitus, allergy, obesity, and inflammatory bowel diseases, respectively [3-7]. In addition, gut microbiome could affect the brain functions and emotional behavior involved in the development of psychiatric disorders [7-9].According to previous clinical studies, gut microbiome significantly shapes the bidirectional communication between the brain and the gastroentestional tract which is known as the microbiota-gut-brain axis while both acute and chronic alcohol consumption could alter the microbial composition, bacterial overgrowth, and disturbed the mucosal barrier [10-14]. There are several evidences supporting that probiotics favorably affect brain function in healthy individuals. This is because the gut microbiome in alcohol-dependent individuals could help defray alcohol’s effect on brain function in the central nervous system wich are related to alcohol-associated behaviors [11-13]. Additionally, several previous studies reveled that probiotic supplementation could improve anxiety and depressive symptoms considered to induce an inclination toward drinking in alcoholic patients [14]. Despite the lack of any current disorders in the individual user, hazardous drinking patterns significantly impact public health. Hazardous alcohol use implies alcohol ingestion that elevates the risk of detrimental outcomes for the user or others [15]. After repeating alcohol exposure, alcohol dependence would develop an individually behavioral, cognitive, and physiological phenomenon [16]. Therefore, harmful alcohol drinking is known as a pattern of alcohol consumption that affects individual physical and mental health [15].
While it seems indisputable that language is sub-served by left-hemisphere and right-hemisphere are lateralized for speech, language, or something else, hypotheses proposed to account for functional hemispheric asymmetries could generally be classified as either cue dependent i.e., basic neural mechanism underlied processing of complex auditory stimuli regardless of linguistic relevance [17], or task dependent, i.e., specialized neural mechanisms exist that were activated only by speech [18]. In earlier studies, Chinese (i.e., tonal speaker) and English (i.e., non-tonal speaker) listeners did not show the same left-hemisphere lateralization as Thai listeners, tonal speakers, when making perceptual judgments of Thai tones [19-21]. In addition, Chinese and English listeners were asked to make perceptual judgments of Chinese tones, consonants, and vowels. The results showed that Chinese listeners showed left-hemisphere lateralization for both segmental and suprasegmental phonological units [21]. These earlier studies suggest that functional circuits engage in early, pre-attentive speech perception of either segmental or suprasegmental units in tone languages [19-21]. Listeners normally tune in to the relevant stream of speech and filter out irrelevant speech input while engaging in a conversation. So, there is still controversial issue whether the human brain contains neural circuits uniquely engaging in the pre-attentive stage of speech processing [22]. Human central auditory system has a remarkable ability to establish memory traces for invariant features of acoustic sounds in the environment such as human speech sound and music, in order to correct the interpretation of these natural acoustic sounds heard [23].
Event-related potentials ( ERPs) recordings is known as tool in investigating the neuronal activities of auditory function in the human brain. The ERPs recordings thus allow scientist to investigate the neural processes which are involved in the attentional mechanisms [17-18, 24]. ERPs components thus reflect the conscious detection of a physical, semantic, or syntactic deviation from the expected sounds [ 23] . The auditory system has a remarkable ability to establish memory traces for invariant features of acoustic sounds in the environment such as human speech sound to correct the interpretation of these natural acoustic sounds heard [ 23] . Theoretically, mismatch negativity ( MMN) component of ERPs can be elicited in the auditory cortex when incoming sounds are detected as deviating from a neural representation of acoustic regularities generating in the auditory cortex occurring between 100 to 250 ms [22-23, 25-27] and thus long been regarded as specific to the auditory modality [ 28-29] . MMN implies the existence of an auditory sensory memory that stores a neural representation of a standard against which any incoming auditory input is compared [30-31]. Some ERPs studies at a phonetic level demonstrated that the MMN was enhanced in Finnish (i.e., non-tonal speaker) subjects by their first-language (Finnish) phoneme prototype rather than a non-prototype (Estonian; non-tonal sapeaker) [1] and that the MMN for a vowel contrast in Finnish was not generated in native Hungarian (i.e., non-tonal speaker) subjects with no knowledge of Finnish [24], implying that the MMN reflects language-specific memory traces formed by early and extensive exposure to a first language [22,24]. Regarding to a previous study revealing that although the left-hemisphere was selectively employed for processing linguistic information irrespectively of acoustic cues or subtype of phonological unit, the right-hemisphere was employed for prosody-specific cues [18, 21]. These previous studies provide the impetus for future investigations of tone perception and temporal integration differences in tonal brain speaker who have long-term, excessive alcohol exposure such as Thai in the present study. The present study used both an auditory MMN component of ERPs recording and the standardized
Low-resolution Electromagnetic Tomography (sLORETA) techniques to measure the degree of cortical activation and to localize the brain area contributing to the scalp recorded auditory MMN component during the passive oddball paradigm in the alcoholic tonal brain speaker.
2. RESEARCH METHOD
2.1. Subjects
Ten right-handed alcoholic drinkers, aged 23-39 years old (mean 31.18±1.07), with normal hearing and no known neurological disorders volunteered for participation. All subjects were categorized by alcohol use disorders identification test (AUDIT) and included in the study based on the AUDIT score at 8 or above, considered high-risk alcoholics. They were asked to fill out the demographic and food frequency questionnaire. Exclusion criteria consisted of abnormal signs, symptoms and laboratory investigations of cirrhosis (ascites, jaundice, hematemesis, coagulopathy, and hypoalbuminemia), neurological and psychiatric disorders, any immunodeficiency and autoimmune disorder, regular use of drugs other than alcohol, taking antibiotics, others dietary supplements and herbs during this trial, history of adverse effects towards synbiotic supplements. The approval of the institutional committee on human research and written consent from each subject were obtained before starting the experiment.
2.2. Stimuli
Stimuli consisted of two pairs of non-speech sound (Hum) of monosyllabic, Thai words. Stimuli were digitally generated and edited to have equal peak energy level in decibels SPL with the remaining data within each of the stimuli scaled accordingly using the Cool Edit Pro v. 2.0 (Syntrillium Software Corporation). The sound pressure levels of stimuli were then measured at the output of the earphones (E-A-RTONE 3A, 50Ω) in dBA using a Brüel and Kjaer 2230 sound-level meter. Pairs were designed to have similar long vowel duration (i.e., [a:]). Two different stimuli were synthetically generated: Stimuli 1: [kha:] - mid tone; Stimuli 2: [khá:] - high tone. Five native tonal Thai speakers listened
to these synthesized sounds and evaluated them all as non-speech sounds or Hum speech. The standard (S)/deviant (D) pairs (e.g., [kha:] (S) - [khá:] (D) or [khá:] (S) - [kha:] (D)) for each trial were
randomized across subjects. The stimuli were binaurally delivered using ePrime software version 3.0 (Psychology Software Tools, Inc., Pittsburgh, PA, USA) via headphones (HP Gaming Headset H300, HP Inc., Palo Alto, CA, USA) at 85 dB. The inter-stimulus interval (ISI) was 1.25 second (offset-onset). The deviant (D) stimuli appeared randomly among the standard (S) at 10% probability in the oddball paradigm. Each experiment included 125 trial (10% D). Electroencephalographic (EEG) signal recording was time-locked to the onset of a sound. Subjects were instructed not to pay attention to the stimuli presented via headphones, but rather to concentrate on other activities.
2.3. Alcohol use disorders identification test (AUDIT)
Alcohol use disorders identification test (AUDIT)was used as a tool for screening individuals with an excessive drinking habit, screen alcohol consumption levels, to determine the decreasing or stopping drinking, alcohol dependency and addiction-treatment efficacy. Fleming et al. reported that AUDIT was the best screening method for the entire range of alcohol troubles than other questionnaires, including the CAGE and the MAS [32]. The ten questions of AUDIT were classified into three domains consisted of recent alcohol use, alcohol dependence symptoms, and alcohol-related problems, respectively. Each response has a score ranging from 0 to 4, as well as the total score sum up a range from 0 - 40. A cut-off value of 8 points provided sensitivities for indicators of hazardous drinking, harmful alcohol use, and possible alcohol dependence at least 90 percent, while specificities across countries and criteria averaged around 80 percent. Hence, in this study, we considered high-risk alcohol drinking subjects with a score higher than or equal to 8 [15, 33].
2.4. Electroencephalographic recording
For EEG/ERP recording, the standard 21 locations of the 10-20 system, EEG, eegoTM
(ANT Neuro, Netherlands), was recorded via an elastic electrocap (Electrocap International) from 20 active electrodes (Fp1, Fpz, Fp2, F7, F3, Fz, F4, T3, C3, Cz, C4, T4, T5, P3, Pz, P4, T6, O1, Oz, O2) positioned according to the 10-20 International System of Electrode Placement, plus Ground were applied, pre-mounted in an elastic electrocap. Reference electrodes were manually applied to left and right mastoids, where the Fp1 and Fp2 electrodes were used for ocular artifact detection. Horizontal eye movements were monitored with electrodes at the left and right outer canthi and vertical eye movements were monitored at Fp1 and Fp2. EEGs were amplified with a gain of 5,000 and filtered with a bandpass of 0.1-30 Hz. EEGs were acquired as
continuous signals and were subsequently segmented into epochs of 1s (a 100 ms pre-stimulus baseline and a 900 ms post-stimulus epoch).
2.5. EEG data processing
EEG recordings were filtered and carefully inspected for eye movement and muscle artifacts. ERPs were obtained by averaging epoch, which started 100 ms before the stimulus onset and ended 900 ms thereafter; the -100-0 ms interval was used as a baseline. Epochs with voltage variation exceeding ±100µV at any EEG channel were rejected from further analysis. The MMN was obtained by subtracting the response to the standard (S) from that to the deviant (D) stimulus. All responses were recalculated offline against average reference for further analysis. For analysis of processing time, ERP component latency was measured at the electrode sites where the mean component amplitude was maximal or near maximal across conditions. Peak amplitude and latency values of 50 ms time-window were used to measure components in this study. These data provide a topographic description of these peak-related components. MMNs were statistically assessed by t-tests comparing the averaged amplitude of the deviant (D) minus standard (S) difference waveform to zero in the 50 ms time-window around the latency of the peak in the grand-average responses. 2.6. Spatial analysis
The average MMN latency was defined as a moment of the global field power (GFP) with an epoch of 50-ms time window related stable scalp-potential topography. In the next step, sLORETA was applied to estimate the current source density distribution in the brain, which contributed to the electrical scalp field. sLORETA computed the smoothest of all possible source configurations throughout the brain volume by minimizing the total squared Laplacian of source strengths [34].
2.7. Statistical analysis
During the auditory stimulation, electric activity of the subjects’ brain was continuously recorded. The MMN was obtained by subtracting the response to the standard (S) ([kha:] - mid tone OR [khá:] -
high tone) from that to the deviant (D) ([khá:] - high tone OR [kha:] - mid tone) stimulus. When significant
stimulus main effects were detected, topographic maps were generated from the mean peak voltage values across subjects. All MMN amplitude measures were taken relative to average baseline voltage in the 100 ms interval prior to stimulus onset. A p value criterion of ≤ 0.05 (two-tailed) was used for significance testing with one sample t-test.
3. RESULTS AND DISCUSSION
The difference waveforms show that deviant stimuli with mid tone ([kha:]) and high tone
([khá:]) elicited MMN between 215-284 ms with reference to the standard-stimulus ERPs.
Table 1 shows mean amplitude of mismatch negativity elicited in the study. The t-test comparing mean MMN amplitudes were statistically significant (e.g., [kha:] - mid tone (-2.11±0.75); [khá:] - high tone
(-3.27±0.04); t(9) = 1.41, p < 0.05.
Table 1. Mean amplitude (µV) ± S.D. of mismatch negativity
Stimuli* Mismatch Negativity Amplitudes (µV±S.D.) p-value
[khá:] - [kha:] -2.11±0.75 <0.05
[kha:] - [khá:] -3.27±0.04
*Stimuli, non-speech sound or hum speech of monosyllabic, Thai words, i.e. [kha:] - mid tone and [khá:] - high tone, were digitally edited to have equal peak energy level in decibels SPL with the remaining data within each of the stimuli scaled accordingly.
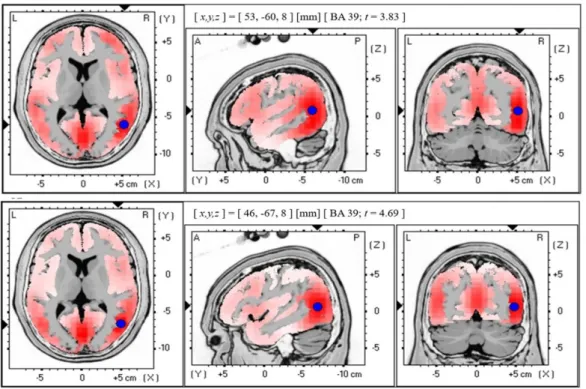
Source localization analyses of each MMN deviant stimulus were further performed by using sLORETA technique to measure the degree of cortical activation and to localize the brain area contributing to the scalp. Table 2 shows the xyz-values in Talairach space in the time window between 215-284 ms as calculated by sLORETA.
Table 2. Stereotaxic coordinates of activation foci of mismatch negativity
Stimuli Coordinates (mm) x y z Brodmann Area (BA) t-values
[khá:] - [kha:] 53 -60 8 39 3.83
In [kha:] - mid tone perception, a single source was estimated to be located in the middle temporal
gyrus (MTG) (Brodmann area (BA) 39; X = 53, Y = -60, Z = 8; MNI cords; t = 3.83) of right hemisphere. Similar to [kha:] - mid tone perception, a single source of [khá:] - high tone perception was shown in the
middle temporal gyrus (MTG) (Brodmann area (BA) 39; X = 46, Y = -67, Z = 8; MNI cords; t = 4.69) of right hemisphere, as shown in Figure 1.
Figure 1. Graphical representation of the standardized Low-resolution Electromagnetic Tomography (sLORETA) t-statistic comparing the mean MMN deviant stimuli responses at the epoch of 50-ms time window between 215-284 ms of the global field power (GFP) waveforms related stable scalp-potential topography at the middle temporal gyrus (MTG)
of the right hemisphere for [kha:] - mid tone perception (Brodmann area (BA) 39; X = 53, Y = -60, Z = 8; MNI cords;
t = 3.83) (Top) and [khá:] - high tone perception (Brodmann area (BA) 39; X = 46, Y = -67, Z = 8; MNI cords; t = 4.69)
of right hemisphere (bottom). Red color indicates local maxima of increased electrical activity in an axial, a saggital and a coronal slice through the reference brain. Blue dots mark the center of significantly increased electric activity.
Both [kha:] - mid tone perception and [khá:] - high tone perception elicited a strong MMN between
215-284 ms with reference to the standard-stimulus ERPs. Source localization analyses performed using sLORETA demonstrated that sources were obtained in the middle temporal gyrus (MTG) of the right hemisphere for both [kha:] - mid tone perception and [khá:] - high tone perception. The current findings
stayed in the same line of previous studies recorded by Magnetoencephalogram (MEG) technique [35-36]. As the synthesized non-speech sounds of monosyllabic Thai words were employed in the present study, the detection of tone was most likely acoustically driven rather than semantically driven, such that the stimuli were processed without any access to semantic information. The synthesized sounds were listened by five native tonal speakers and evaluated as non-speech sounds or hum speech. We hypothesized that the acoustic aspect in the absence of phonetic or higher-order properties may account for neuronal responses of this tone perception. By referencing to previous study, it is reasonable to speculate that the continued auditory processing required for the tone interferes with or masks the detection mechanism underlying the MMN [35]. Additionally, the current findings showed similar results with previous tone studies that reported a clear MMN elicited by both duration increments and decrements [37]. However, the present study were controlled pairs of stimuli with the same duration and did not investigated the MMN in both duration increments and decrements compared to previous study [37].
Theoretically, the MMN component of ERPs elicited in the auditory cortex when incoming sounds are detected as deviating from a neural representation of acoustic regularities [22]. It is mainly generated in the auditory cortex occurring between 100 to 250 ms [ 28] and thus long been regarded as specific to the auditory modality [ 22, 28-29] . Although MMN implies the existence of an auditory sensory memory that stores a neural representation of a standard against which any incoming auditory input is compared,
it is clear that the MMN can be elicited in auditory modality in the absence of attention [38-39]. The MMN component in the present study was found to be more sensitive to [khá:] - high tone perception compared to
[kha:] - mid tone perception. The current findings revealed similar result to previous tone studies showing a
larger MMN elicited by increments than decrements [40]. One might expect language-specific effects on the elicitation of the MMN of speech in the present study, since Thai is a tonal language. A tendency towards stronger MMN in either [kha:] - mid tone perception or [khá:] - high tone perception is observed and support
such an expectation in that statistically significant difference in MMN amplitudes was found between [kha:] -
mid tone perception or [khá:] - high tone perception at an acoustic level. At least two previous studies at a
phonetic level demonstrated that the MMN was enhanced in Finnish subjects by their first-language (Finnish) phoneme prototype rather than a non-prototype (Estonian) [22] and that the MMN for a vowel contrast in Finnish was not generated in native Hungarian speakers with no knowledge of Finnish [24], implying that the MMN reflects language-specific memory traces formed by early and extensive exposure to a first language [22, 24]. Hence, our current finidngs are stayed in the line of these previous MMN studies.
The topographic analysis in the present study was used to locate sources particularly involved in the discrimination of these different synthesized acoustic sounds perception as well as characterizing the cortical distribution of the ERP electrical generators. The source analyses of the MMN components suggest that both [kha:] - mid tone perception and [khá:] - high tone perception may elicit activity in the middle temporal gyrus
(MTG) of the right hemisphere in alcoholic tonal brain speaker. However, source modeling using a single equivalent dipole approach has well-recognized spatial limitations, perhaps accounting for the discrepancy between current findings and previous reports of MMN/MMF generators in the planum temporale. While there existed no hemispheric differences in the current study, the current findings contrasted with previous f-MRI [41] and MEG [9] reports that the left posterior superior temporal gyrus was found to be activated by the pre-attentive detection of acoustic changes in non-speech (tones) and speech (CV syllables). However, language-specific word-related MMN component at acoustic and phonetic levels in both [kha:] -
mid tone perception and [khá:] - high tone perception in alcoholic tonal brain speaker remain to be
investigated in future studies.
4. CONCLUSION
The current findings show that both [kha:] - mid tone perception and [khá:] - high tone perception
elicited a strong mismatch negativity between 215-284 ms with reference to the standard-stimulus ERPs. Source localization analyses performed by using sLORETA demonstrated that the middle temporal gyrus of the right hemisphere was the main source for both [kha:] - mid tone perception and [khá:] - high tone
perception in alcoholic tonal brain speaker. Finding the present evidences of alcoholic tonal brain speaker in this study, an automatic detection of tone perception is a useful index of language universal auditory memory traces.
ACKNOWLEDGEMENTS
This study was supported by research funding from the National Research Council of Thailand (Grant No. 126/2561), Mae Fah Luang University grant (MFU-grant no. 61210320031), Mae Fah Luang University (Electroencephalogram Laboratory 2019), and Brain Science and Engineering Innovation Research Group (BSEI), Mae Fah Luang University grant (MFU-grant no. 611U109005), Thailand. The authors gratefully acknowledge the Faculty of Pharmacy, Chiang Mai University, Chiang Mai, Thailand. The research was also partially supported by Chiang Mai University, Thailand. We thank all subjects participated in this study.
REFERENCES
[1] P. Anderson, et al., “The risk of alcohol,” Addiction, vol. 88, pp. 1493-1508, 1993.
[2] G. Edwards, “Alcohol policy and the public good,” Addiction, vol. 92, Suppl. 1, pp. S73-S79, 1997.
[3] M.C. Noverr and G.B. Huffnagle, “Does the microbiota regulate immune responses outside the gut?” Trends in Microbiology, vol. 12, no. 12, pp. 562-568, 2004.
[4] F.H. Karlsson, et al., “Gut metagenome in European women with normal, impaired and diabetic glucose control,” Nature, vol. 498, no. 7452, pp. 99-103, 2013.
[5] C. Manichanh, et al., “Reduced diversity of faecal microbiota in Crohn’s disease revealed by a metagenomic approach,” Gut, vol. 55, no. 2, pp. 205-211, 2006.
[6] P. Seksik, et al., “Review article: the role of bacteria in onset and perpetuation of inflammatory bowel disease,” Alimentary Pharmacology and Therapeutics, vol. 24, pp. 11-18, 2006.
[7] B.S. Sivamaruthi, et al., “A Review on Role of Microbiome in Obesity and Antiobesity Properties of Probiotic Supplements,” BioMed Research International, Article ID 3291367, 2019.
[8] S.M. Finegold, et al., “Pyrosequencing study of fecal microflora of autistic and control children,” Anaerobe, vol. 16, no. 4, pp. 444-453, 2010.
[9] C. Chaiyasut and B.S. Sivamaruthi, “Influence of Probiotic Supplementation on Brain Function: Involvement of Gut Microbiome, Inflammation, and Stress Pathway,” In: A. Evrensel and B.Ö. Ünsalver, Gut Microbiota - Brain Axis, pp. 20-33, IntechOpen: Croatia, 2018.
[10] C. Leung, et al., “The role of the gut microbiota in NAFLD,” Nature Reviews. Gastroenterology and Hepatology, vol. 13, no. 7, pp. 412-425, 2016.
[11] P. Bercik, et al., “The intestinal microbiota affects central levels of brain-derived neutropic factor and behavior in mice,” Gastroenterology, vol. 141, no. 2, pp. 599-609, 2011.
[12] K. Tillisch, et al., “Consumption of fermented milk product with probiotic modulates brain activity,” Gastroenterology, vol. 144, pp. 1394-1401, 2013.
[13] J. Gorky and J. Schwaber, “The role of the gut-brain axis in alcohol use disorders,” Progress in Neuro-Psychopharmacology and Biological Psychiatry, vol. 65, pp. 234- 241, 2016.
[14] Y. Tang, et al., “Effect of alcohol on miR-212 expression in intestinal epithelial cells and its potential role in alcoholic liver disease,” Alcoholism, Clinical and Experimental Research, vol. 32, no. 2, pp. 355-364, 2008. [15] T. Babor, et al., “Lexicon of alcohol and drug terms,” World Health Organization, Geneva, 1994.
[16] World Health Organization, “ICD-10, the ICD-10 classification of mental and behavioural disorders: diagnostic criteria for research” Geneva, World Health Organization, 1993.
[17] R. Ivry and L. Roberson, “The two sides of perception,” MIT Press: Cambridge, MA, 1998.
[18] S. Imaizumi, et al., “Task-dependent laterality for cue decoding during spoken language processing,” Neuroreport, vol. 9, pp. 899-903, 1998.
[19] J. Gandour, “Aphasia in tone languages,” In: P. Coppens, A. Basso and Y. Lebrun (eds.), Aphasia in atypical populations, pp. 117-141, Lawrence Erlbaum, Hillsdale, NJ, 1998.
[20] J. Gandour, et al., “A Cross-linguistic PET Study of Tone Perception,” Journal of Cognitive Neuroscience, vol. 12, no. 1, pp. 207-222, 2000.
[21] L. Hsieh, et al., “Functional Heterogeneity of Inferior Gyrus is Shaped by Linguistic Experience,” Brain and Language, vol. 10, pp. 1-15, 2001.
[22] R. Näätänen, “Attention and Brain Function”, Lawrence Erlbaurn, Hillsdale, 1992.
[23] R. Näätänen, et al., Early selective-attention effect on evoked potential reinterpreted, Acta Psychologica, 42: 313-329, 1978.
[24] I. Winkler, et al., “Pre-attentive detection of vowel contrasts utilizes both phonetic and auditory memory representations,” Cognitive Brain Research, vol. 7, pp. 357-369, 1999.
[25] R. Näätänen, “The perception of speech sounds by the human brain as reflected by the mismatch negativity (MMN) and its magnetic equivalent (MMNm)”, Psychophysiology, vol. 38, pp. 1-21, 2001.
[26] M. Jaramillo, et al., “Mismatch negativity and behavioral discrimination in humans as function of the magnitude of change in sound duration,” Neuroscience Letter, vol. 290, pp. 101-104, 2000.
[27] G. Dehaene-Lambertz, “Electrophysiological correlates of categorical phoneme perception in adults,” Neuroreport, vol. 8, pp. 919-924, 1997.
[28] J.D. Kropotov, et al., “Mismatch negativity to auditory stimulus change recorded directly from the human temporal cortex,” Psychophysiology, vol. 32, pp. 418-422, 1995.
[29] G. Nyman, et al., “Mismatch negativity (MMN) for sequences of auditory and visual stimuli: evidence for a mechanism specific to the auditory modality,” Electroencephalography and Clinical Neurophysiology, vol. 77, pp. 436-444, 1990.
[30] W. Ritter, et al., “The mismatch negativity of event-related potentials as a probe of transient auditory memory: a review,” Ear and Hearing, vol. 16, pp. 52-67, 1995.
[31] J. Besle, et al., “Is the auditory sensory memory sensitive to visual information?”, Experimental Brain Research, vol. 166, pp. 337-344, 2005.
[32] M.F. Fleming, et al., “The alcohol use disorders identification test (AUDIT) in a college sample,” Substance Use and Misuse, vol. 26, no. 11, pp. 1173-1185, 1991.
[33] S. Kuitunen-Paul and M. Roerecke, “Alcohol Use Disorders Identification Test (AUDIT) and mortality risk: a systematic review and meta-analysis,” Journal of Epidemiol Community Health, vol. 72, pp. 856-863, 2018. [34] R.D. Pascual, et al., “Low Resolution Electromagnetic Tomography: A New Method for Localizing Electrical
Activity in the Brain,” International Journal of Psychophysiology, vol. 18, pp. 49-65, 1994.
[35] M. Inouchi, et al., “Neuromagnetic auditory cortex responses to duration and pitch changes in tones: cross-linguistic comparisons of human subjects in directions of acoustic changes,” Neuroscience Letter, vol. 331, pp. 138-142, 2002.
[36] M. Inouchi, et al., “Magnetic mismatch fields elicited by vowel duration and pitch changes in Japanese words in humans: comparison between native- and non-speakers of Japanese,” Neuroscience Letter, vol. 353, pp. 165-168, 2003.
[37] R. Näätänen, et al., “Do event-related potentials to infrequent decrements in duration of auditory stimuli demonstrate a memory trace in man?” Neuroscience Letter, vol. 107, pp. 347-352, 1989.
[38] K. Alho, et al., “Intermodal selective attention. II. Effects of attentional load on processing of auditory and visual stimuli in central space,” Electroencephalography and Clinical Neurophysiology, vol. 82, pp. 356-368, 1992.
[39] P. Pazo-Alvarez, et al.,“MMN in the visual modality: a review,” Biological Psychology, vol. 63, pp. 199-236, 2003.
[40] M. Jaramillo, et al., “An event-related potential (ERP) study of duration changes in speech and non-speech sounds,” Neuroreport, vol. 10, pp. 3301-3305, 1990.
[41] J. Binder, et al., “Human brain language areas identified by functional magnetic resonance imaging,” Journal of Neuroscience, vol. 17, pp. 353-362, 1997.
BIOGRAPHIES OF AUTHORS
Vachrintr Sirisapsombat received Bachelor of Allied Health Sciences (Medical Technology) (First Class Hons.) from Chulalongkorn University, and Doctor of Medicine (First Class Hons.) from Chulalongkorn University, Thailand. He is currently a Ph.D. Candidate in Anti-Aging and Regenerative Medicine, School of Anti-Aging and Regenerative Medicine, Mae Fah Luang University, Bangkok, Thailand. His research interests are energy-based technology, aesthetic medicine, anti-aging and regenerative medicine.
Phakkharawat Sittiprapaporn received Bachelor of Arts (Second Class Hons.) in English from Srinakharinwirot University, Thailand, Master of Arts in Linguistics, Institute of Language and Cultural for Research and Development from Mahidol University, Thailand, and Ph.D. in Neurosciences, Neuro-Behavioural Biology Center, Institute of Science and Technology for Research and Development Mahidol University, Thailand. He is currently a Head of Brain Science and Engineering Innovation Research Group, Mae Fah Luang University, and Neuropsychological Research Laboratory, as well as a lecturer at Department of Anti-Aging and Regenerative Science School of Anti-Aging and Regenerative Medicine, Mae Fah Luang University, Bangkok, Thailand. His research interests are cognitive psychology, cognitive neurosciences, cerebral mechanisms in perception and cognition, brain mechanism of music and language perception and cognition, and neurobiology of learning and memory.
Chaiyavat Chaiyasut received Bachelor of Pharmacy from Chiangmai University, Master of Science in Pharmaceutical Sciences from Chulalongkorn University, Thailand and Ph.D. in Applied Chemistry from Nagoya Institute of Technology, Japan. He is lecturer at Department of Pharmaceutical Sciences, as well as a Head of Innovation Center for Holistic Health, Nutraceuticals and Cosmeceuticals, Faculty of Pharmacy, Chiang Mai University, Chiang Mai, Thailand. His research fields and special interests are probiotics, prebiotics and synbiotics, microbiota on health and beauty, natural products from microorganisms and medicinal plants, fermentation technology. He also researched about bioactive ingredients for cosmeceuticals, holistic health and the applications.
Sasithorn Sirilun received Bachelor of Science in Microbiology from Burapha University, Master of Science in Pharmaceutical Sciences and Ph.D. in Pharmacy from Chiang Mai University, Thailand. She is lecturer at Department of Pharmaceutical Sciences, as well as a researcher at Innovation Center for Holistic Health, Neutraceuticals and Cosmeceuticals, Faculty of Pharmacy, Chiang Mai University, Chiang Mai, Thailand. Her research fields and special interests are probiotics, prebiotics and synbiotics, microbiota on health and beauty, natural products from microorganisms and medicinal plants, fermentation technology and food biotechnology, lactic acid bacteria and their applications.
Roungsan Chaisricharoen received Bachelor of Engineering and Master of Engineering in Computer Engineering, and Ph.D. in Electrical and Computer Engineering from King Mongkut's University of Technology Thonburi, Thailand.He is currently a lecturer at School of Information Technology, Mae Fah Luang University, Chiang Rai, Thailand. His research interests are analogue circuit and IC design, continuous-time active filter, compensation/optimization techniques, data and computer communication, networking, active inductor simulation design and analysis of experiments, and computational intelligence.
Thamthiwat Nararatwanchai received Bachelor of Science in Medical Science, Doctor of Medicine, Post Graduate Certificate in Internal Medicine, and Post Graduate Diplomate Thai Board of Dermatology from Siriraj University Hospital, Mahidol University Bangkok, Thailand. He is certified Board of Anti-Aging Medicine Specialization by European society of Anti-Aging medicine and world society of Anti-Aging medicine. He is currently an Advisor Dean of School of Anti-Aging and Regenerative Medicine, Mae Fah Luang University, Bangkok, Thailand. His research interests are dermatology, aesthetic medicine, anti-aging and regenerative medicine.