ISSN: 1992-8645 www.jatit.org E-ISSN: 1817-3195
SCHEME OF AN ALGORITHM FOR THE SUPPRESSION OF
ENVIRONMENTAL NOISE IN HEARING DEVICES
1JUAN A. R. CHÁVEZ
1Academic, University of the Valley of Mexico, Department of Executive Degree
San Juan de Dios Avenue #6 Tlalpan, Mexico City E-mail: 1[email protected]
ABSTRACT
At present, noise pollution is a relevant factor to measure the quality of life of people. In order to solve this problem, in this article an algorithm is proposed that allows to filter the unwanted noise levels and to admit the flow to the sounds that are required. The algorithm is based on the amplification and filtering techniques that are provided by the operational amplifiers. The function of the algorithm is divided into two parts: it first filters out the frequencies that are not wanted (environmental noise) and then amplifies the frequencies that are required (conversations, sounds very close to the user); the output signal is evaluated by calculating the ODG (Objective Difference Grade) as regulated by the ITU (International Telecommunications Union). The average ODG obtained was -0.946, the previous result indicates that the output signal of the algorithm (clean signal of noise) with respect to the input signal (signal with noise attached) has been correctly filtered such that the noise is slightly perceptible but not annoying to Human Auditory System (HAS). The algorithm was designed using ORCAD® and the subjective test was the MOS
(Mean Opinion Score) with people who have suffered various hearing loss.
Keywords: Algorithm, Noise, Filtering, Amplification, Hearing Loss
1. INTRODUCTION
Currently, life in the city is extremely busy, so all people go from environment to environment where there is a common alteration: noise.
Noise can be found in the environment[1], as a consequence of the means of transportation, the industrial sector and even the daily life of the people themselves. The noise interferes in the accomplishment tasks, in the concentration to solve problems in addition, according to the psychologists, modifies social behavior and causes discomfort.
Clinical studies show that exposure to environmental noise is associated with hypertension and cardiovascular disease. Such exposure to noise causes a gradual decrease and loss of auditory sensitivity known clinically as Hearing Loss.
Hearing loss is considered a functional defect that occurs when a person gradually loses his hearing capacity, regardless of the intensity of loss that the person shows. There are several factors that cause a decrease in hearing sensitivity, some of the causes of this condition are genetic, complication in childbirth, some infectious diseases, chronic ear infections, use
of certain medications, exposure to excessive noise and aging.
According to the World Health Organization, 1.1 billion young people are at risk of hearing loss due to their exposure to noise in recreational settings and 60% are due to preventable causes.
Hearing loss produces several types of consequences, listed below:
Functional consequence: It is the limitation of the person’s ability to communicate with others. In some cases, speech development is often delayed.
Social and emotional consequences: Feeling of loneliness, isolation, frustration, poor scholar performance and even failure, unemployment and discrimination.
ISSN: 1992-8645 www.jatit.org E-ISSN: 1817-3195
An alternative to combating hearing loss is the cochlear implant. This paper proposes a scheme of an algorithm that gives the patient with hearing loss an amplification of the desired sound and, in turn, a suppression of the unwanted noise (environmental noise).
The above so that, unlike the devices that are in the current market, they achieve a better fidelity on the part of the user and thus contribute to the social inclusion that affects them so much.
The objectives of the research are as follows:
1. Design a scheme to reduce the unwanted frequency amplitude (ambient noise) and amplify the desired frequencies (sounds close to the implant user)
2. Validate theoretically the results obtained by calculating the ODG (Objective Difference Grade)
3. Validate the results obtained through the MOS test (Mean Opinion Score)
The paper is organized as follows, in section 1 is the introduction in which defines the problematic situation that the proposal seeks to solve. Section 2 shows the conceptual approaches and theories on which the proposed project was based. Section 3 shows the design of the algorithm divided in two parts: the amplification of the desired sound and the suppression of the noise, besides the theoretical support of the project. Section 4 covers the results obtained after implementation and the tests performed. Finally, in section 5 the conclusions are presented.
2. CONCEPTUAL APPROACH
Robert Dome[2] proposes a system that adds an auxiliary signal to the desired signal in order to limit its amplitude and reduce noise. According to the results of the proposal it is shown that the auxiliary signal allows a significant reduction in the noise without altering the useful power of the output, the previous one generates that the sound leaves pure and amplified although dissipating heat. However, it is inappropriate in the implementation of the cochlear implant by the use of so little physical space of the latter.
Operational amplifiers have the advantage that they are limited in the amplitude they generate at the output, which does not affect the user's ear.
The algorithm designed bases its operation on the theory of operational amplifiers. The objective of an operational amplifier is to raise the voltage value of a signal variant over time but always trying to keep it as faithful as possible.
2.1 Microphone
It is a transducer capable[3] of converting the sound signal into electrical, that is to say, a device that converts sound pressure into electrical voltage. Something to consider of microphones is its directionality. According to acoustic theory, the sensitivity of a microphone varies according to the angle with respect to its axis from which the sounds comes. It is possible to indicate the directional characteristics of a microphone using a polar diagram.
For the test of this project was used a microphone with omnidirectional polar diagram was used because the user of the final device must hear all the sounds (including environmental noise) for when the person is crossing the street.
After acoustic signal has been picked up with the microphone comes the signal processing, for this we made use of the theory of operational amplifiers. The use of this theory allowed the design of the algorithm structure.
2.2 Operational Amplifiers
A great advantage that the operational amplifiers have is that depending on the way of connection they give us a certain modification to the output with respect to the input that is the output can be calculated depending on the input. Electronically, an operational amplifier is able to reproduce sound without altering the structure of the same since it does not handle great electrical currents.
The configuration of the operational amplifiers will modify the output signal with respect to the input signal, whether it increases or decreases the amplitude. For the development of the proposed algorithm, use was made of the one the main configurations: inverter amplifier.
ISSN: 1992-8645 www.jatit.org E-ISSN: 1817-3195
nR
[image:3.612.92.295.124.303.2]gain. Figure 1 shows the electronic configuration of the inverting amplifier.
Figure 1: Inverter Amplifier
The equation that determines the system of Figure 1 is shows below:
classified into three types: height, sonority and timbre.
The height is the sensation that allows us to distinguish the low sounds of the treble, the sonority allows us to distinguish a loud sound from a weak and the timbre allows to distinguish sounds of different instruments and voices.
The frequency is directly related to the sensation of height, the amplitude of the signal with the sonority and the spectrum with the timbre.
2.5 Evaluation Criteria
For the evaluation of the system, two types of test were used:
MOS (Mean Opinion Score)
ODG (Objective Difference Grade)
The MOS test is a standard used and V =
R
2V
(1) defined by the ITU to measure the quality of the0 i experience; it is the arithmetic mean of all
1 individual values.
Equation 1 represents the output of the inverting amplifier, shows that the output will be inverted with respect to the input (by the negative sign) and that its amplitude is also modified based on the resistor ratio as follows: is feedback resistance R2 is greater than R1 then we speak of an amplification, otherwise we speak of a reduction.
It is considered a subjective test of quality evaluation although it can also be estimated mathematically as expressed in equation 2.
It is usually used[4] to evaluate audio and video quality.
N
R
n0
2.3 Headphones
MOS
N (2)
The main function of hearing aids[3] is to be a transducer that converts electrical energy into acoustics in order to be heard.
A headphone receives the acoustic signal converted into electrical and previously captured by the microphone and later reproduced in an acoustic signal that is possible to hear from the user. This headphone will allow you to hear the desired signal and the environmental noise, the first amplified and the second attenuated.
2.4 Psychoacoustic Sensations
Psychoacoustic[3] is dedicated to studying the perception of sound, that is, how the ear and the brain process the information that comes to us in the form of sound. Perceived sensations are
Equation 2 represents the mathematical form of the MOS subjective evaluation test. Where
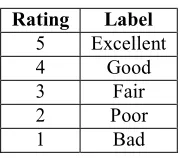
[image:3.612.373.463.580.659.2]R are the individual ratings given by N persons. Ratings are awarded using the following scale:
Table 1. Rating Scales
Rating Label
5 Excellent
4 Good
3 Fair
2 Poor
1 Bad
ISSN: 1992-8645 www.jatit.org E-ISSN: 1817-3195
implements the calculation of the Objective
Difference Grade (ODG) using equation 3: environment, it was necessary to use the FAME For proper reception of sound in the noisy strategy[6]. The FAME strategy allows an adequate
Eˆs[k, n] [k]Eˆs[k, n 1] (1[k])Ec[k, n] (3) performance in the perception of the desired audio so that the user does not make more effort to Equation 3 represents the mixture of both
[image:4.612.110.277.245.321.2]signals (the desired signal with the environmental noise), this equation is based on the imperfection of the Human Auditory System (HAS)[5] and allowed to evaluate the noise on the sound signal using the following scale in Table 2:
Table 2. ODG Values
Impairment Description ODG
Imperceptible 0.0 Perceptible, but not annoying -1.0 Slightly annoying -2.0
Annoying -3.0
Very annoying -4.0
Environmental noise should be perceptible but not disturb or overlap with the desired signal. Then, in section 3 the design of the proposal is shown.
3. ALGORITHM DESIGN
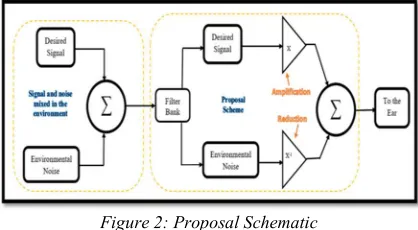
[image:4.612.90.299.521.636.2]The proposed algorithm consists of two parts: the filter stage and the amplification/reduction stage. In the first part comes the simulation of the mixing process of the signals in the free environment, on the other hand, in the second part shows the design of the proposal consisting of the step of amplification/reduction. Figure 3 shows the general diagram of the proposed proposal.
Figure 2: Proposal Schematic
Then, each of the above are defined.
3.1 Filter stage
It is important to mention that sound waves in the free environment overlap each other, that is, they are mixed.
capture and interpret the sound heard. It was proposed with the purpose of coding the frequency and amplitude modulation with the objective of efficient operation of sound pickup by cochlear implants under ambient noise conditions.
The FAME strategy consists of two parts, analysis and synthesis. First the input signal is divided into several parts making use of bandpass filters, then the frequency modulation and the amplitude modulation of the signal are extracted so that both parts are subsequently synthesized and that when joined, the desired signal is generated with the lowest amount of clinging noise possible.
Later, it is necessary in the first instance to separate the desired signal from the noise to be minimized, said action being performed by means of a filter bank.
The filter bank consists of two types of filtering: a bandpass and a rejectband. The bandpass filter is useful to allow the passage of the frequencies covered within a range of two cut frequencies. In the design of the algorithm, bandpass was used to allow the passage of the desired frequencies (the sounds to be amplified). The rejectband was used to separate the frequencies of noise that are intented to be minimized.
The bandpass filter was designed for a range of frequencies from 200 Hz to 3.2 kHz which is the frequency band established by the International Telecommunications Union (ITU) for telephone range.
The rejectband filter allows to “setting aside” all the frequencies outside the bandpass filter. This filter allows separating the frequencies to be minimized, as frequencies that the user has no interest in listening will be minimized in amplitude so that their perception is minimal and do not interfere in overlapping with the sounds that will be heard.
ISSN: 1992-8645 www.jatit.org E-ISSN: 1817-3195
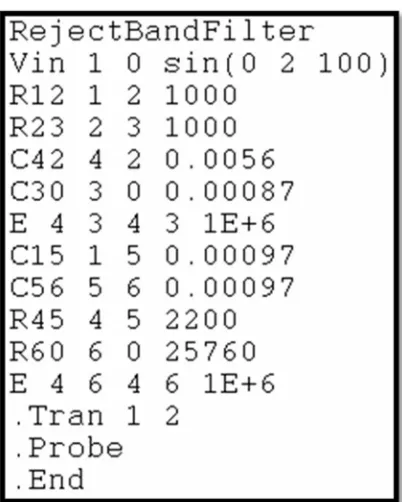
[image:5.612.98.286.148.374.2]The code representing the filter bank is shown in figure 3 for Bandpass filter and figure 4 for Rejectband Filter corresponding to the bank of filters of the first stage.
[image:5.612.92.293.400.651.2]Figure 3. Code for Bandpass Filter
Figure 4. Code for Rejectband Filter
It should be noted that the algorithms were designed in the ORCAD platform; this platform allows us to implement code to simulate electronic systems in generic hardware. Figure 3 shows a
bandpass filter which is composed of two filters in series, one passes low and one passes high. Figure 4 shows a rejectband filter composed of two filters in parallel one low pass and one pass high. Both filters designed with the frequencies show previously.
3.2 Amplification / Reduction stage
Subsequently, the stage of amplification / reduction comes. This stage is responsible for amplifying the sound that should be heard by the user, at the same time, to minimize the sound that is not intended to be heard. The amplification and reduction was performed on the amplitude of the signals.
The processes mentioned were based on the theory of operational amplifiers. An arrangement in the structure of the amplifier allows an increase or decrease in the amplitude of the input signal to the output of the system as detailed in section 2.
Finally, the signals will be mixed again for the user to hear both, however, the user will now listen in more detail to the signals of their interest and the noises will be heard but with an attenuator in their volume.
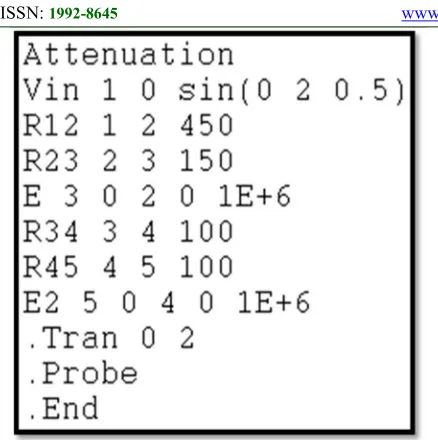
The code representing the step of applying and attenuating corresponding to the second stage of the system, are shown in figure 5 and 6 respectively.
[image:5.612.316.514.479.710.2]ISSN: 1992-8645 www.jatit.org E-ISSN: 1817-3195
[image:6.612.85.304.72.292.2]V
Figure 6. Code for Attenuation Stage
Figure 5 shows the amplification algorithm, the ratio of the declared resistors play the role of amplifying at three times since 450/150 = 3 (later in the test and results it is shown that this gain is adequate) subsequently, comes the unit gain stage that only serves to phase the audio signal. Figure 6 performs the same function as Figure 5, but instead of amplifying, it attenuates due to the ratio of resistors.
The signal-to-noise ratio (SNR) plays an important role in analyzing the amount of noise that is mixed with the signal at the output (after it has been processed).
Vs
4. TESTING AND RESULTS
This section shows the results of the implementation of the proposal design. They are divided into two parts: objective and subjective results. The first one cover the theoretical result of the analysis of the proposal, that is to say, what is the response of the system to real conditions implemented in a simulation environment and the practical result after having been implemented in general purpose software. In addition, the signal-to- noise ratio of the resultant is calculated in order to corroborate that the desired audio "covers" the environmental noise (without suppressing it). The above calculation was performed considering the amplitudes of both signals before and after processing. The second covers the results obtained from the MOS test, using a sample of 26 people who suffer from hearing loss and who give their opinion about the use of the device and its operation.
4.1 Objective Results
This section shows objective results, based on the implementation of the proposed algorithm.
Recapping, the algorithm must perform the following actions:
1. Filter the signals, they must be separated for analysis.
2. Amplify the desired signals and attenuate the amplitude of the noise. We mean by wanted signals to the sound that is around and close to the user.
3. Mix both signals with the changes made in
SNR 20 log
N
(4) step two.
Equation 4 shows the calculation of the signal-to-noise ratio of the output of the proposed system. It should be mentioned that the relevant aspect of the output signal is that the desired amplitude practically covers the unwanted noise (ambient noise), allowing the user suffering from hearing loss to achieve optimal sound reception.
The general purpose is to obtain an audible signal as clear as possible, in addition, minimizing the signal of noise (unwanted) in order for the user to achieve a proper capture and interpretation of what he intends to hear.
It is exemplified based on ideal conditions. That is, they are not considered conditions outside the implementation of the algorithm. For example, heat dissipation of devices that could alter or distort the audio signal received by the user.
Understood the above, the resultant signal will be subjected to the calculation of the signal-to- noise ratio according with equation 4 to know how involved the unwanted signal is relative to the one that is of interest to listen to the user.
ISSN: 1992-8645 www.jatit.org E-ISSN: 1817-3195
Figure 7. Signals Involved in the Environment
The signal of a) shows the graph of the time – varying test voice signal. This signal represents a purely natural voice without noise or any disturbance.
The signal of b) shows the Gaussian Additive White Noise (AWGN) that is added in the environment to the desired signal. Generally, the noise is of smaller amplitude but of greater frequency that the desired one, reason why it is more feasible that there is a splicing between both signals.
The c) image shows the voice signal with the addition of the noise. It can be said that this image represents the signal “contaminated” since it is the one that travels through the free space and that, in fact, is the one that perceives the human ear. The image in d) shows both overlapping signals, the original and the polluted, can be appreciated the difference between both and the above lies in the addition of noise. Subsequently, this is the one that must be submitted to the bank of filters for their separation.
Figure 8 shows the contaminated signal (audio signal with noise) and its frequency spectrum, it is important to mention that the spectrum of both the vocal signal and the noise signal appear. Figure 9 shows the filtered audio signal (no noise) and its frequency spectrum, compared with the previous figure, it can be seen that amplitudes of the frequencies spectrum of the
[image:7.612.312.520.398.713.2]noise has been minimized since the band pass filter allows only the signal audible. In addition, the audible signal is amplified practically covering the noise.
Figure 8. Frequency Spectrum of the Contaminated Signal
ISSN: 1992-8645 www.jatit.org E-ISSN: 1817-3195
In the transition of Figure 8 and 9 it is possible to appreciate that the bandpass filter allows the passage of the vocal range (which is the interest
Based on equation 2, we obtained for MOS[8] in equation 3:
of the user) rejecting all the other frequencies. The above allows the algorithm shown in Figure 5 to
MOS 3.88 4 (5)
[image:8.612.92.299.216.404.2]increase the amplitude of the audio signal three times but, in turn, the algorithm of Figure 6 decreases the amplitude of the noise. Finally, it is necessary to join the signals, both increased and the decremented using the algorithm of figure 10.
Figure 10. Code for Adder Stage
4.2 Subject Results
[image:8.612.312.522.334.483.2]This section contains subjective tests called MOS and ODG performed with a sample of 26 people suffering from hearing loss or symptoms of low hearing due to the excessive auditory exposure they have suffered or by some congenital malformation. Using the scale from Table 1, we proceeded to subject people to listen to the resulting amplified signal with noise attenuation. Figure 11 shows the graph of the opinions found.
Figure 11. Results of Mean Opinion Score
The result for the MOS test indicates that, as shown graphically, the quality of the audio signal is good for people with the condition of hearing loss. People mention that their hearing loss has prevented them from performing their daily activities properly. However, they think that the sound that results after the algorithmic process is intelligible in spite of its suffering.
For the ODG test, the same survey was performed. Were surveyed the same people as in the MOS test but making use of a different scale (Table 2) and indicating that environmental noise would now be evaluated (extraneous sound). The result obtained was the following:
Figure 12. Results of Objective Difference Grade
Based on equation 3, the ODG calculated for the output signal from the input was -0.946, which according to the scale in Table 2 the noise in the resulting signal is perceptible but not annoying.
[image:8.612.90.294.570.710.2]ISSN: 1992-8645 www.jatit.org E-ISSN: 1817-3195
The power of the desired signal is amplified and can be adjusted based on the requirements of the user, the amplification algorithm allows the above without suffocating its function and, therefore, without generating heat (a very important factor knowing that the user will have the implant in the ear).
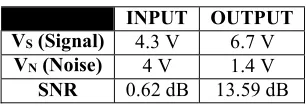
[image:9.612.118.271.263.316.2]To verify the signal-to-noise ratio of the resultant, a sample was taken for which its adequate amplification factor (when it already listened well to the desired signal) was of 1,558 having the following data and results into the table 3:
Table 3. SNR Results
INPUT OUTPUT
VS (Signal) 4.3 V 6.7 V
VN (Noise) 4 V 1.4 V
SNR 0.62 dB 13.59 dB
In the above table, it can be visualized that the desired signal is higher in amplitude to the noisy signal at the output of the system but without deleting it.
5. CONCLUSIONS
The algorithm proposed in this paper is based on the theory of amplifiers for some reasons found in the operation of the same:
a) The structure of connection of the operational amplifiers is of mathematical manipulation, the previous one provides its own design and based on the requirements of the application.
b) The stability offered by the amplification structures, allow maintaining almost intact the submitted signal so that the audio quality will practically not be affected. c) The saturation of the operational
amplifiers is an advantage for the implementation of the device because it can serve as a limitation to avoid an uncomfortable (and even annoying) amplification of the sound and the environmental noise adhered.
d) As a future work, it is feasible to propose the implementation of the algorithm in general purpose hardware in order to test the operation of the algorithm under real conditions.
e) When it has been adapted to general purpose hardware, it is feasible to professionalize its electronic implementation perhaps in a digital signal processor to eradicate any impurity that has been added to the analogue sound signal.
f) The designed algorithm provides a fast convergence, the measured processing time was approximately 562 ms which means a considerable value for real-time use.
g) The modulation of the amplitude in the processing of the system can be adjusted according to the particular situation of each user. The above provides the advantage that the system is adaptable and configurable to the needs required by the user which makes it dynamic and comfortable.
6. REFERENCES
[1] H. Yao, G. Yang, DDNM: Monitoring Environment Noise using Smart Phones, China University of Geosciences (China), 2013, pp. 1
[2]B. Dome Robert, Audio Amplifier with Reduce Plate Dissipation, IRE Transactions on Audio (USA), 1958, pp. 29 – 33.
[3]F. Miyara, Acústica y Sistemas del Sonido, 4th. Edition, Argentina, 1999, pp. 18 – 120. [4] Y. Yue, X. Xiang, W. Yaodu, A Novel
Objective Method for Evaluating the Quality of Streaming Audio, Beijing Institute of Technology (China), 2009, pp. 556 – 557. [5] Recommendation ITU-R BS.1387-1 Method
for objective measurements of perceived audio quality, 2001.
[6] H. L. Ying, Improving the Performance of Speech Perception in Noisy Environment Based on an FAME Strategy (Taiwan), 2016, pp. 1 – 4.
[7] B. Carter , Filter Design in Thirty Seconds, Texas Instruments (USA), 2001, pp. 2-6. [8] R. Streijl, S. Winkler, Mean Opinion Score