IJPSR (2016), Vol. 7, Issue 2 (Research Article)
Received on 07 August, 2015; received in revised form, 16 October, 2015; accepted, 05 December, 2015; published 01 February, 2016
DEVELOPMENT AND VALIDATION OF RP-HPLC METHOD FOR QUANTIFICATION OF BETULINIC ACID IN VITEX NEGUNDO L. AND ITS POLYHERBAL FORMULATIONS
R. K. Patel* and P. D. Trivedi
Department of Pharmaceutical Analysis, K. B. Institute of Pharmaceutical Education and Research, Gandhinagar, Gujarat, India.
ABSTRACT: The Vitex negundo, which is traditional Indian medicine, has been used for treatment of various diseases. A simple, sensitive, precise and accurate RP-HPLC method has been developed for the analysis of Vitex negundo L. samples and its polyherbal formulations for their Betulinic acid content. The extraction was checked using different solvents like methanol, chloroform, 95% ethanol, acetone and dichloromethane. It was found chloroform was good extraction solvent that allowed extraction of Betulinic acid with highest content. The method involves RP C18 column with methanol-acetonitrile-water (90:5:5 % v/v/v) pH 2.5 adjusted with ortho phosphoric acid as mobile phase and UV detection at 270 nm. The flow rate was 1.3 ml/min. The retention time was 2.29 min. The linearity range was 5-30 μg/ml. The method was validated for linearity range, precision, LOD, LOQ, robustness and accuracy. Mean recovery was 99.16-100.76 %. The method was successfully applied for the quantification of Betulinic acid in leaves, seeds of Vitex negundo L. and its polyherbal formulations. The results demonstrated that the content of Betulinic acid was depending on different extraction solvents and ensure its clinical benefits. The content of total triterpenoids was also determined by colorimetry method.
INTRODUCTION: The Vitex negundo, which is traditional Indian medicine, of Verbenaceae family, has been used for treatment of various diseases. It is used in the treatment of inflammation, fungal diseases, antioxidant and hepatoprotective disorders 1, 2. Betulinic acid (3β-hydroxylup-20-(29)-en-28-oic acid) is a pentacyclic triterpenoids and is common constituent of many medicinal plants and herbs. The structure of Betulinic acid is shown in Fig. 1.
QUICK RESPONSE CODE
DOI:
10.13040/IJPSR.0975-8232.7(2).856-61
Article can be accessed online on: www.ijpsr.com
[image:1.612.328.563.479.619.2]DOI link: http://dx.doi.org/10.13040/IJPSR.0975-8232.7 (2).856-61
FIG. 1: STRUCTURE OF BETULINIC ACID
Betulinic acid is white to slightly being rose powder, highly soluble in pyridine, acetic acid, soluble in methanol, ethanol, chloroform, ether and low solubility in water, petroleum ether, DMF, DMSO and benzene 3. They have many important pharmacological effects like anti-inflammatory, hepatoprotective, anti-tumor, anti-HIV, anti-Keywords:
Betulinic acid,
Vitex negundo L,
Polyherbal formulations, RP-HPLC.
Correspondence to Author: Mr. Rajendra K. Patel
Lecturer,
Department of Pharmaceutical Analysis, K. B. Institute of Pharmaceutical Education and Research, Gandhinagar, Gujarat, India.
microbial, anti-gastric ulcer and anti leukemic properties 4-7. A literature survey described that RP-HPLC 8-11, HPTLC 12-18 methods were developed for the determination of Betulinic acid in the various plant samples and formulations, but no RP-HPLC method has been reported for estimation of Betulinic acid in plant samples and polyherbal formulations containing Vitex negundo. Hence, this paper described RP-HPLC for estimation of Betulinic acid and colorimetry method for total triterpenoids in plant samples of Vitex negundo L. and its herbal formulations.
MATERIALS:
The leaves of Vitex negundo collected from the L. M. College of Pharmacy, Ahmedabad, Gujarat. Reference standard of Betulinic acid (HPLC purity >98.0 %) was purchased from Sigma aldrich, Bangalore, Karnataka, India. HPLC grade acetonitrile and methanol were used for the HPLC analysis. Milli-Q water was used by the Milli-Q system. All other solvents used in this study were of analytical grade. Seed powder of Vitex negundo and marketed polyherbal formulations were purchased from the local market, India.
Instruments:
HPLC system, 2230 series (Analytical
Technologies ltd, India) equipped with P 2230 HPLC pump, LU 2230 Plus 4 low pressure gradient unit, Autosampler, UV 2230 UV visible detector. Colorimetry method was performed on Shimadzu 1800 series double beam spectrophotometer with a fixed slit width (1nm) attached to the computer with UV-Probe, version 2.33 software for obtaining the spectra.
Quantification of Betulinic acid by RP-HPLC: Preparation of standard solution of Betulinic acid (50µg/ml):
A standard solution of Betulinic acid (50µg/ml) was prepared by dissolving 0.5 mg of accurately weighed Betulinic acid in methanol and the volume was made up to 10 mL with methanol.
Preparation of calibration curve of Betulinic acid (5-30 µg/ml):
Suitable aliquots of standard solution of Betulinic acid were transferred to vials separately and volume was made up to 2 ml with methanol. The
above standard solutions were injected and run for calibration curves. Calibration graph was plotted subsequently for linear regression analysis of peak area with concentration.
Extraction and preparation of sample solutions: 2 g powdered leaves and seeds of Vitex negundo and its formulations were extracted with Chloroform (20 ml*3). Combined all chloroform extracts and evaporate to dryness on water bath to get the residue. Also 2 g powdered of leaves were extracted with methanol, 95 % ethanol, acetone and dichloromethane (20 ml*3). Combined all extracts, respectively and evaporate to dryness on water bath to get the residue. The residues of all samples were dissolved in 10 ml of methanol, respectively. The afforded solutions were filtered through whatmann filter prior to HPLC. All test solutions were diluted further using methanol. Each of sample solutions were injected into chromatogram and peak area were recorded.
Chromatographic Conditions:
Analysis was performed on Kromasil 100 RP C18 (5 µm, 250×4.6 mm i.d.) column using an isocratic mobile phase comprising Methanol-Acetonitrile-Water (90:5:5 % v/v/v) pH 2.5 adjusted with orthophospharic acid. The flow rate was maintained at 1.30 ml/min and temperature of the column was kept at room temperature. The samples were injected in a volume of 20 μL and detection was carried out at 270 nm.
Method validation:
The method was validated according to International Conference on Harmonization guidelines for validation of analytical procedures.
Linearity:
The linear response was determined by analyzing six independent levels of the calibration curve in the range of 5-30 μg/ml for Betulinic acid. Result should be expressed in terms of Correlation co-efficient.
Precision:
for inter-day precision.
LOD and LOQ:
Calibration curve was repeated 5 times and the standard deviation (SD) of the intercepts (response) was calculated. Then LOD and LOQ were measured by using mathematical expressions.
Accuracy (% Recovery):
Accuracy expressed as % Recovery by the assay of known, added amount of analyte. Its measure of the exactness of the analytical method. The recovery experiments were carried out in triplicate by previously analyzed test samples with three different concentrations of standards at 80%, 100% and 120% respectively.
Robustness study:
Robustness of the method were determined by performing small changes in the mobile phase ratio, wavelength detection and flow rate. The results indicated insignificant differences in results and thus indicative of a robust method.
System Suitability:
The parameters used in these were asymmetry of chromatographic peak, Theoretical plates, and retention time.
Quantification of total triterpenoids by colorimetric method:
The determination of total triterpenoids was determined by colorimetric method19 with the following procedure. Initially, a stock solution of Ursolic acid (500μg/ml) was prepared. From above solution a suitable aliquot (0.1, 0.2, 0.3, 0.4 and 0.5 ml) were transferred to 10 ml of test tube, respectively. 0.2 ml of 5% vanillin–acetic acid and 1.2 ml of perchloric acid were added, mixed and incubated at 70o C for 15-20 min. Then after tubes were taken out and cooled in running water for 2 min then, acetic acid was added to make up the volume up to 5 ml. The absorbance was taken at 550 nm against blank. The calibration curve was constructed by absorbance versus concentration of Ursolic acid standard (µg/ml).
Study the effect of extraction solvent on content of Betulinic acid and total triterpenoids:
This developed RP-HPLC method was
subsequently applied for determination of Betulinic acid and colorimetric method was applied for determination of total triterpenoids in leaves of Vitex negundo respectively, with different extraction solvents (methanol, chloroform, 95 % ethanol, acetone and dichloromethane) and to compare the extraction efficiency.
RESULTS AND DISCUSSION: RP-HPLC separation optimization:
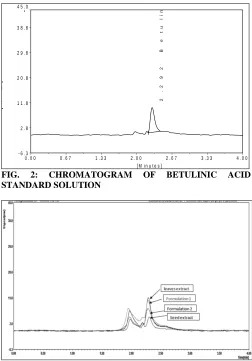
Initially various mobile phases, flow rate and detection wavelength were tried for HPLC analysis to attempt best chromatograph in Methanol-Acetonitrile-Water (90:5:5 v/v/v) pH 2.5 adjusted with Orthophospharic acid on Kromasil 100 RP C18 column at flow rate of 1.3 ml/min and detection was at 270 nm. The chromatograph of Betulinic acid standard and sample solutions were shown in Fig. 2 & 3 respectively. The retention time was 2.29 min.
[ M i n u t e s ]
0 . 0 0 0 . 6 7 1 . 3 3 2 . 0 0 2 . 6 7 3 . 3 3 4 . 0 0
- 6 . 3 2 . 8 1 1 . 8 2 0 . 8 2 9 . 8 3 8 . 8 4 5 . 0
[
m
v
]
2
.
2
9
2
B
e
t
u
l
i
n
i
c
a
c
i
d
FIG. 2: CHROMATOGRAM OF BETULINIC ACID
STANDARD SOLUTION
[image:3.612.313.565.341.702.2]Validation and Assay results of RP-HPLC method:
The linearity data of standard Betulinic acid is shown in Table 1. The calibration curve for Betulinic acid was obtained by plotting the peak area of Betulinic acid versus concentration over the range of 5-30 μg/ml and it was found to linear with r2=0.990 (Fig. 4).
TABLE 1: RESULTS OF LINEARITY DATA
Conc (μg/mL) Peak Area
(mean ± S.D, n=3)
%RSD
5 17951 ± 152.68 0.851
10 39920 ± 214.39 0.537
15 48489 ± 249.95 0.515
20 74735 ± 337.79 0.452
25 90228 ± 236.53 0.262
30 107676 ± 381.09 0.354
Mean %RSD
0.459
FIG. 4: CALIBRATION CURVE OF BETULINIC ACID (PEAK AREA VS. CONCENTRATION)
The LOD and LOQ were found to be 0.144 and 0.436 respectively. The % RSD for intraday and inter day precision were found to 0.501 and 0.795 respectively (Table 2 and 3). The results of accuracy were 99.16-100.76% (Table 4). The % RSD for different parameters of robustness was found to less than 2% (Table 5). The proposed HPLC method was applied to the quantification of Betulinic acid in plant samples of Vitex negundo and its herbal formulations. The result of system suitability was shown in Table 6. The content of Betulinic acid in leave sample, seeds sample, formulation 1 and 2 were 0.060 %, 0.031 %, 0.043 and 0.041 % respectively (Table 7). The summary of regression analysis and validation parameters was shown in (Table 8).
TABLE 2: RESULTS OF INTRADAY PRECISION BA
(μg/mL)
Mean SD %RSD
10 39920.3 214.393 0.537
15 48489 249.946 0.515
20 74735.7 337.79 0.452
Mean % RSD 0.501
TABLE 3: RESULTS OF INTERDAY PRECISION BA
(μg/mL)
Mean SD %RSD
10 39774.67 377.42 0.945
15 48477.67 435.83 0.899
20 74804.33 401.58 0.537
Mean % RSD 0.795
TABLE 4: RESULTS OF RECOVERY STUDY % Amt
Estimated
Amt of BA present in
pre analysed
sample (μg/mL)
Amt of BA standard
added (μg/mL)
Amt recovered
(µg/mL)
% Recovery
± SD
80 5 4 8.92 99.16 ±
0.042
100 5 5 10.067 100.67 ±
0.054
120 5 6 11.084 100.76 ±
0.095
TABLE 5: RESULTS OF ROBUSTNESS STUDY
Parameters %RSD
Mobile phase composition 0.675
Wave length 1.3
Flow rate 0.715
TABLE 6: RESULTS OF SYSTEM SUITABILITY STUDY
Parameters BA %RSD
Asymmetry 1.81 ± 0.017 0.957
Theoretical Plates 14793.66 ± 62.931 0.420 Retention Time(min) 2.29 ± 0.001 0.025
TABLE 7: ASSAY RESULTS OF PLANT SAMPLES OF
VITEX NEGUNDO AND ITS FORMULATIONS
Formulations
Amt found (μg/mL)
% Assay ± SD (n=3) (% w/w)
Leaves sample 12.025 0.060 ± 0.0005 Seed sample 6.353 0.032 ± 0.0004 Formulation 1 8.644 0.043 ± 0.0002 Formulation 2 8.027 0.040 ± 0.0004
TABLE 8: SUMMARY OF VALIDATION PARAMETERS
Parameters BA Total triterpenoids
(Ursolic acid equivalent) Linearity range (μg/mL) 5-30 10-50 Correlation coefficient (r2) 0.990 0.989 Intraday Precision (%RSD) 0.501 1.125 Interday Precision (%RSD) 0.795 1.506
LOD(μg/mL) 0.144 3.182
LOQ(μg/mL) 0.436 9.643
Validation and assay results of colorimetric method:
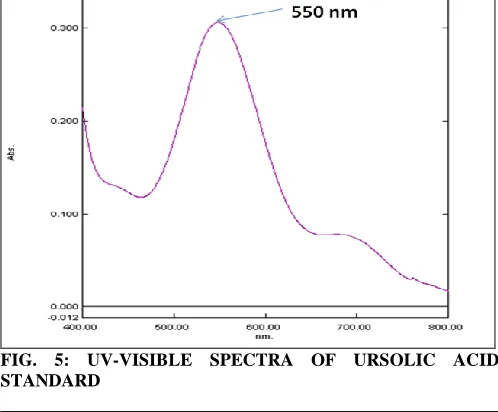
The UV visible spectra of Ursolic acid standard was shown in Fig. 5. The calibration curve were constructed in range of 10-50 μg/mL, and it was found to linear with r2=0.989 (Fig. 6). The LOD and LOQ were found to be 3.182 and 9.643 respectively. The % RSD for intraday and inter day precision were found to 1.125 and 1.506 respectively. The result of accuracy was 95.68-103.03 %. The summary of regression analysis and validation parameters was shown in (Table 8). The content of total triterpenoids in leaves sample, seeds sample, formulation 1 and 2 were 0.148 %, 0.081 %, 0.236 and 0.211 % respectively
FIG. 5: UV-VISIBLE SPECTRA OF URSOLIC ACID STANDARD
FIG. 6: CALIBRATION CURVE OF URSOLIC ACID STANDARD SOLUTIONS
Result of effect of extraction solvents
The results of different extracting solvent on content of Betulinc acid and total triterpenoids were shown in Table 9. The results shown that content of both were strongly dependent on the
solvents with different polarities. Chloroform and methanol were good extraction solvent that allowed extraction of Betulinic acid and total triterpenoids with a higher yield compared with the other extraction solvents. The extraction of acetone, 95 % ethanol and dichloromethane were rather small.
TABLE 9: YIELD OF BETULINIC ACID AND TOTAL TRITERPENOIDS IN THE LEAVES OF VITEX NEGUNDO
WITH DIFFERENT EXTRACTION SOLVENTS Extraction
solvents
BA % w/w
% RSD Total
triterpenoids % w/w
% RSD
Chloroform 0.060 0.801 0.148 1.111 Methanol 0.058 0.505 0.163 0.362 95 % Ethanol 0.027 1.290 0.079 1.037 Acetone 0.025 1.399 0.062 0.883 Dichloromethane 0.015 1.172 0.053 0.497
CONCLUSION: The developed RP-HPLC method was accurate, precise, sensitive, reproducible and simple for quantification of the Betulinic acid in plant samples and its herbal formulations. The spectrophotometric method was successfully applied for estimation of total triterpenoids in plant samples and its herbal formulations, which was simple, rapid, accurate, precise and reproducible. Significant variations in the content of Betulinic acid and total triterpenoids in Vitex negundo leaves with different extraction solvents were observed. Therefore, in order to ensure and improve the therapeutic benefits, it is necessary to quantify bioactive components in the leaves of Nagod derived extracts and herbal formulations.
ACKNOWLEDGMENTS: The authors would like to thank K. B. Institute of pharmaceutical education and research, Gandhinagar to provide reagents and instruments facility for proposed work.
REFERENCES:
1. Anonymous: The Wealth of India, Raw Materials, Vol.10, New Delhi, CSIR (Council of Scientific & Industrial Research) 2003: 158-160.
2. Anonymous: Ayurvedic Pharmacopoeia of India, Part 1, Vol.3, New Delhi, 2001: 142-144.
3. Maryadele J and Neil O: The Merck Index an encyclopedia of chemicals, drugs and biological. USA Merck Research Laboratories, 14th Edition, 2006: 195.Onwuchekwa C, Oluwole FS: Anti-gastric ulcer and anti inflammatory properties of betulinic acid in male albino rats. Science World Journal 2010; 5(4):15-17. 4. Abdalrahim FA, Aisha K, Salman A et al.: Syzygium
[image:5.612.48.297.281.487.2] [image:5.612.48.300.475.649.2]potential anti-breast cancer. Brazilian Journal of Pharmacognosy 2012; 22(2):335-343.
5. Kumar D, Mallick S, Vedasiromoni JR et al.: Anti-leukemic activity of Dilleni indica L. fruit extract and quantification of betulinic acid by HPLC. Phytomedicine 2010; 17(6):431-435.
6. Mondal S, Dash GK, Acharyya S: Isolation of phytoconstituents from the roots of Cleome rutidosperma
DC. Drug Invention Today 2010; 2(1):92-95.
7. Taralkar SV, Chattopadhyay S: A HPLC method for determination of ursolic acid and betulinic acids from their methanolic extracts of vitex negundo Linn. Journal Analytical and Bioanalytical Technique 2012; 3:1-6. 8. Liviu H, Floricuța R, Diana C et al.: Evaluation of betulin
and betulinic acid content in birch bark from different forestry areas of western carpathians. Notulae Botanicae Horti Agrobotanici 2012; 40(2):99-105.
9. Khalid H, Muhammad T, Zhari I, Amirin S: Rapid separation and determination of betulinic acid from a complex matrix using combination of TLC and RP-HPLC. Pakistan Journal of Pharmaceutical Science 2012; 25(2):413-422.
10. Guo LL, Jin MU, Cui HS et al.: Development of a new HPLC method with precolumn fluorescent derivatization for rapid, selective and sensitive detection of triterpenic acids in fruits. Journal of Agriculture and Food Chemistry 2011; 59: 2972–2979.
11. Patel RK, Patel JB, Trivedi PD: Novel TLC-Densitometry method for quantification of betulinic acid in nagod (Vitex
negundo L.) and its herbal formulations. Journal of Planar
Chromatography 2014; 27(2):1-5.
12. Yadav A, Gupta M: Simultaneous quantification of the anti-inflammatory phytoconstituents betulinic acid,
24β-ethylcholesta-5, 22E, 25-triene-3β-ol, and lupeol
in Clerodendrum phlomidis. Journal of Planar
Chromatography 2014; 27(3):174-180.
13. Pagi K, Lahiri S, Yadav G et al.: Development and validation of HPTLC method for determination of betulinic acid in Helicteres isora root extract. International Journal of ChemTech Research 2010; 2(2):851-855. 14. Agilandeswari D: Quantification of oleanolic acid and
betulinic acid by TLC and brine shrimp lethality assay of
Nymphaea stellata willd. leaves. International Journal of
Pharmaceutical Chemical Biological Science 2012; 2(2):166-173.
15. Hussain K, Ismail Z, Sadikun A: High-performance thin-layer chromatographic method for quantification of betulinic acid in extracts of leaves of Orthosiphon
stamineus benth. Asian Journal of Chemistry 2011;
23(3):977-979.
16. Gandhi DM, Mehta PJ: Validated high-performance thin-layer chromatographic method for the quantification of betulinic acid from two Indian plants of the species Dillenia and Ziziphus. Journal of Planar Chromatography 2013; 26(4):331-335.
17. Katerina N, Breda S, Alen A et al.: TLC and TLC-MS screening of ursolic, oleanolic and betulinic acids in plant extracts. Journal of Planar Chromatography 2013; 26(2): 125-131.
18. Prasad R, Zainol M, Ahmad I et al.: Kinetic study of microwave assisted extraction of hypoglycemic active compounds from Ceriops decandra sp. Leaves using methanol: comparison with soxhlet extraction. Journal of Applied Science 2011; 11(13):2364-2369.
All © 2013 are reserved by International Journal of Pharmaceutical Sciences and Research. This Journal licensed under a Creative Commons Attribution-NonCommercial-ShareAlike 3.0 Unported License.
This article can be downloaded to ANDROID OS based mobile. Scan QR Code using Code/Bar Scanner from your mobile. (Scanners are available on Google Playstore)
How to cite this article:
R. K. Patel* and P. D. Trivedi: Development and Validation of RP-HPLC Method for Quantification of Betulinic Acid in Vitex Negundo L.