IJPSR (2016), Vol. 7, Issue 12 (Research Article)
Received on 20 June, 2016; received in revised form, 15 August, 2016; accepted, 27 August, 2016; published 01 December, 2016
METHOD DEVELOPMENT AND VALIDATION FOR THE ESTIMATION OF IDELALISIB IN RABBIT PLASMA BY HPLC
A. Suneetha *1 and D. Sharmila 2
Department of Pharmaceutical Analysis 1, Hindu College of Pharmacy, Amaravathi road, Guntur-522 002, Andhra Pradesh, India.
Department of Pharmaceutical Analysis 2, V.V. Institute of Pharmaceutical Sciences, Gudlavalleru-521356, Andhra Pradesh, India.
ABSTRACT: A simple, rapid, sensitive, and accurate high performance liquid
chromatography was developed for determination of Idelalisib (IL) in rabbit plasma using Ibrutinib as internal standard (IS). Idelalisib is a phosphoinositide 3-kinase inhibitor indicated in the treatment of chronic lymphocytic leukemia (CLL), relapsed follicular B-cell non-Hodgkin lymphoma (FL), and relapsed small lymphocytic lymphoma (SLL). The analytes and IS were separated on a ODS (250 mm × 4.6 mm, 5 µm) column using Mobile phase composition as Buffer and Acetonitrile in the ratio of 85:15 v/v%. The total chromatographic runtime is 10.0 min with retention time for IL and IS at 7.195, and 5.435 min, respectively with a flow rate 1ml/min. The method is validated over a dynamic linear range of 0.02-4 µg/mL for IL with a correlation coefficient of r2 0.999. The method was validated as per the USFDA guidelines and the results were within the acceptance criteria for selectivity, sensitivity, linearity, precision, accuracy, recovery stability of solution and stability of solution in plasma. INTRODUCTION: Idelalisib is an oral
phosphatidylinositol 3-kinase delta (PI3Kδ) inhibitor 1. It had clinically significant activity with an acceptable toxicity profile in patients with relapsed or refractory chronic lymphocytic leukemia, follicular B cell non-Hodgkin's lymphoma and small lymphocytic lymphoma 2, 3. Idelalisib has demonstrated activity in indolent B-NHL (iB-B-NHL) and is approved for use as monotherapy in patients with follicular lymphoma and small lymphocytic lymphoma and in combination with rituximab in patients with chronic lymphocytic leukemia 4.
QUICK RESPONSE CODE
DOI:
10.13040/IJPSR.0975-8232.7(12).4998-05
Article can be accessed online on:
www.ijpsr.com
DOI link: http://dx.doi.org/10.13040/IJPSR.0975-8232.7 (12).4998-05
Treatment of lymphoma cells with Idelalisib has been shown to result in inhibition of chemotaxis and adhesion, and reduced cell viability. Chemically Idelalisib is 5-fluoro-3-phenyl-2-[(S )-1-(9H-purin-6-ylamino)-propyl] – 3 H - quinazolin- 4 one, with molecular formula C22H18FN7O 5, 6.
N
N
N HN
NH
N N
F O
FIG.1: STRUCTURE OF IDELALISIB
Keywords:
Idelalisib, Ibrutinib, Anticaner, Rabbit Plasma
Correspondence to Author: Dr. A. Suneetha
Professor & HOD,
Department of Pharmaceutical Analysis, Hindu College of Pharmacy, Amaravathi road, Guntur - 522 002, Andhra Pradesh, India.
Ibrutinib is a bruton tyrosine kinase (BTK) inhibitor effective in patients with chronic lymphocytic leukemia 7. Ibrutinib is an orally available small molecule that forms an irreversible covalent bond with the Cys481 of BTK kinase 8. Ibrutinib is also indicated for the treatment of patients with Waldenström’s Macroglobulinemia (WM). IUPAC Name 1-[(3R)-3-[4-amino-3-(4-phenoxyphenyl)-1H-pyrazolo [3,4-d]pyrimidin-1-yl]piperidin-1-yl]prop-2-en-1-one 9.
1.1Reagents and chemicals:
The pure samples of Idelalisib and Ibrutinib were obtained from Selleckchem.com LLC supplied by Pro lab marketing. HPLC grade Acetonitrile, HPLC grade Methanol and all other chemicals were obtained from Merck chemical division, Mumbai. HPLC grade water obtained from Milli-Q water purification system was used throughout the study.
1.2 Instrumentation:
Chromatography was performed with waters 2695 HPLC provided with high speed auto sampler, column oven, degasser and & 2996 PDA detector to provide a compact and with class Empower-2 software.
1.3Chromatographic method:
The separation was carried on ODS C18 analytical column (250mm×5mm×4.6µm) using mobile phase Buffer and Acetonitrile in the ratio of 85:15%v/v and flow rate is 1 ml/min. The Injection volume was 10 µl and the run time was 10 min. The temperatures of column and auto sampler were maintained at 30°C and 5°C respectively. The detection was carried at wavelength 270 nm.
1.4 Buffer Preparation:
1ml of 0.1% Perchloric acid was transferred into 1000mL volumetric flask and made the volume to produce 1000mL with water.
1.5Preparation of Idelalisib Stock solution: The standard stock solution of Idealisib was prepared at 1mg/mL with mobile phase. The stock is further diluted with mobile phase to obtain 0.1mg/mL solution.
1.6Preparation of Idelalisib Spiking Solutions (4.6 µg/mL to 920µg/mL):
From the above Idelalisib stock solution 2 (0.1mg/mL) take out 0.460ml, 1.380ml, 2.30ml
and from the stock 1(1mg/mL) solution take out 1.150ml, 2.300ml, 4.600ml, 6.900ml and 9.200 ml was pipette and transferred to 8 individual 10 ml volumetric flask and make up the volume up to the mark with mobile phase to produce 4.6 µg/mL, 13.8 µg/mL, 23 µg/mL, 115 µg/mL, 230 µg/mL, 460 µg/mL, 690 µg/mL and 920 µg/mL.
1.6Extraction procedure:
To 250µl of drug free plasma 50µl of internal standard & 10µl of Idelalisib was added. To the mixture 2 ml of Acetonitrile was added, subjected to cyclomixer for 15 sec. Then vertexed for 2 min and finally centrifuged for 3 min at 3200 rpm speed. After the centrifugation the organic layer was collected and directly injected 10 µL into HPLC.
1.7Methodology for Analysis:
A thorough and complete method of validation was following the USFDA guidelines. The method was validated for system suitability, auto sampler carryover, specificity and screening of biological matrix, sensitivity, matrix effect, linearity, precision and accuracy, recovery of analyte and internal standard, ruggedness on precision accuracy and linearity, reinjection reproducibility and stability on day zero, long batch, LT at -28°C and LT at -80°C.
System suitability was done by MQC level sample as six homogenous injections and will see the %RSD values for retention time and response of analyte and internal standard. Auto sample carryover was done by ULOQ and LLOQ level and check whether drug is remains or not in system.
Linearity of the method was determined by analysis of standard plots associated with an 8-point standard calibration curve. Intra-batch and inter-batch accuracy and precision was evaluated at five different concentrations levels (LLOQ, LQC, MQC and HQC) in six replicates for both the analytes. Mean values were obtained for calculated drug concentration over these batches. The accuracy and precision was calculated and expressed in terms of % Accuracy and coefficient of variation (% CV), respectively. Recovery of the analytes from the extraction procedure was performed at LQC, MQC, and HQC levels. It was evaluated by comparing peak area of extracted samples (spiked before extraction) to the peak area of un extracted samples (quality control working solutions spiked in extracted plasma). Ruggedness can be done by changing the person to person for linearity, precision and accuracy in the levels of ULOQ, LQC, MQC and HQC.
Stability studies was performed as Zero hours, Long batch, LT at -28ºC and LT at -80ºC. Day zero having two sample with six replicates of HQC and LQC levels. Long batch have 35replicates of LLOQ, LQC, MQC and HQC level of samples with %Mean accuracy. LT at -28ºC and LT at -80ºC have HQC and LQC level with % Stability finding by comparison sample and stability sample.
2. RESULTS AND DISCUSSIONS:
3.1 System suitability: Six replicate samples of middle quality control samples of concentration along with internal standards were injected and % CV was calculated. The % CV of the retention time of analyte and IS was found to be ≤ 2.00%. The % CV of the peak area ratio of analyte to IS was found to be ≤ 5.00%. The results were found to be within limits and are summarized in Table 1.
TABLE 1: SYSTEM SUTABILITY DATA
Sample Name Analyte IS Area Ratio
Area RT (min) Area RT (min)
MQC
57496 7.19 32172 4.31 1.7871
57495 7.18 32170 4.30 1.7872
57492 7.17 32168 4.32 1.7872
57487 7.19 32162 4.30 1.7874
57484 7.18 32160 4.32 1.7874
57481 7.20 32161 4.31 1.7873
MEAN 7.185 4.310 1.78729
SD 0.0072 0.0094 0.000115
%CV 0.10 0.22 0.01
The carryover experiment was done to ensure that it does not affect the accuracy and precision. There
was no carryover observed. The results were presented in Table 2.
TABLE 2: AUTO SAMPLER CARRYOVER
Sample ID Peak Area % Carryover
Drug IS Drug IS
Unextracted samples
RS 0 0 N/A N/A
AQ ULOQ 221216 48156
0.00 0.00
RS 0 0
AQ LLOQ 2956 48152 N/A N/A
Extracted samples
STD Blk 0 0 N/A N/A
ULOQ 201216 32172
0.00 0.00
STD Blk 0 0
LLOQ 1956 32170 N/A N/A
3.2 Specificity and screening of biological matrix: Response of interfering peaks in standard blank at the retention time of analyte should be
samples were found to be free of interference at retention time of analyte in blank samples. The
results were shown in Table 3.
TABLE 3: SPECIFICITY AND SCREENING OF BIOLOGICAL MATRIX
Sample Response % Interference Pass/Fail
Drug ISTD Drug ISTD
STD Blk1 0 0
0.00 0.00 Pass
LLOQ1 1956 32172
STD Blk2 0 0
0.00 0.00 Pass
LLOQ2 1952 32168
STD Blk3 0 0
0.00 0.00 Pass
LLOQ3 1991 32160
STD Blk4 0 0
0.00 0.00 Pass
LLOQ4 1982 32194
STD Blk5 0 0
0.00 0.00 Pass
LLOQ5 1943 32168
STD Blk6 0 0
0.00 0.00 Pass
LLOQ6 1968 32173
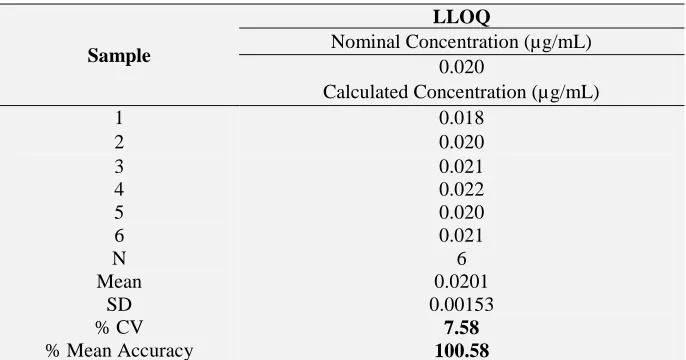
Sensitivity: The accuracy and precision of Idelalisib at LLOQ level was found to be 7.58 % CV and % Mean accuracy was found to be 100.58. Acceptance Criteria is at least 67 % (4 out of 6) of samples should be within 80.00-120.00 %. % Mean
accuracy should be within 80.00-120.00 %. % CV accuracy should be ≤ 20.00 %. The results comply with acceptance limit and were incorporated in Table 4.
TABLE 4:SENSITIVITY DATA
Sample
LLOQ
Nominal Concentration (µg/mL) 0.020
Calculated Concentration (µg/mL)
1 0.018
2 0.020
3 0.021
4 0.022
5 0.020
6 0.021
N 6
Mean 0.0201
SD 0.00153
% CV 7.58
% Mean Accuracy 100.58
3.4 Matrix effect: The matrix effect data of HQC and LQC were presented in Table 5. The Acceptance Criteria is at least 67 % (2 out of 3) of samples at each level should be within 85.00-115.00 %. At least 80 % (5 out of 6) of the matrix
[image:4.612.88.525.103.268.2] [image:4.612.135.478.371.551.2]lot should be within the acceptance criteria. The % mean accuracy of back calculated concentration of LQC and HQC samples prepared from different biological matrix lots should be within 85.00-115.00 %.
TABLE 5: MATRIX EFFECT
S. No. Plasma Lot No. HQC LQC
Nominal Concentration (µg/mL)
3.000 0.100
Nominal Concentration Range (µg/mL) (2.550-3.450) (0.085-0.115)
Calculated Concentration (ng/mL) (n=3)
1 LOT1 2.740 0.097
3 LOT3 2.995 0.102
4 LOT4 2.871 0.095
5 LOT5 3.317 0.105
6 LOT6 3.174 0.102
Mean 3.0102 0.1001
SD 0.30948 0.00907
% CV 10.28 9.06
% Mean Accuracy 100.34 100.11
No. of QC Failed 0 0
3.5 Linearity: The calibration curve was found to be linear at range 0.02 – 4µg/mL with correlation coefficient (r2) 0.999. The linear graph is
represented in Fig.2. The data of calculated calibration standards are presented in Table 6.
[image:5.612.42.569.54.161.2] [image:5.612.48.521.175.501.2]FIG.2: CALIBRATION PLOT FOR CONCENTRATION v/s AREA RATIO
TABLE 6: LINEARITY S. No. Conc.
(µg/ml)
Back Calculated Concentration (µg/mL) Avg. %CV % Mean Accuracy
1 2 3
1 0.02 0.018 0.020 0.021 0.0197 7.77 98.33
2 0.06 0.054 0.060 0.068 0.0607 11.58 101.11
3 0.1 0.092 0.102 0.112 0.1020 9.80 102.00
4 0.5 0.468 0.480 0.541 0.4963 7.89 99.27
5 1 0.862 1.125 1.148 1.0450 15.21 104.50
6 2 1.765 1.984 2.247 1.9987 12.07 99.93
7 3 2.580 3.195 3.389 3.0547 13.83 101.82
8 4 3.542 3.860 4.430 3.9440 11.41 98.60
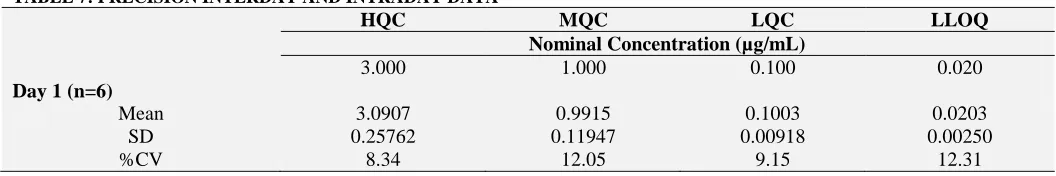
3.6 Precision: The % CV of estimated concentrations for all four level quality control samples with six replicates for analyte was within 8.34 to 12.31%. The % mean accuracy for LLOQ, LOQ, MOQ and HQC was within 97.50% to 103.02%. For inter day precision and accuracy the % CV and accuracy results of all quality control samples were in between 8.36 to 11.44 and 99.61 to
102.40 respectively. The acceptance criteria is that at least 67 % of total QC samples should be ≤ 15.00 % and for the LLOQ, should be ≤ 20.00 %. % Mean accuracy for LQC, MQC and HQC samples should be within 85.00-115.00 % and for the LLOQ sample should be within 80.00-120.00 %. The data of precision and accuracy is complied in Table 7.
TABLE 7: PRECISION INTERDAY AND INTRADAY DATA
HQC MQC LQC LLOQ
Nominal Concentration (µg/mL)
3.000 1.000 0.100 0.020
Day 1 (n=6)
Mean 3.0907 0.9915 0.1003 0.0203
SD 0.25762 0.11947 0.00918 0.00250
[image:5.612.42.570.660.748.2]% Mean Accuracy 103.02 99.15 100.33 101.67
Day-2 (n=6)
Mean 3.0660 1.0098 0.0990 0.0200
SD 0.28528 0.12326 0.00787 0.00237
%CV 9.30 12.21 7.95 11.83
% Mean Accuracy 102.20 100.98 99.00 100.00
Day-3 (n=6)
Mean 3.0593 1.0110 0.0995 0.0195
SD 0.27564 0.12282 0.01003 0.00187
%CV 9.01 12.15 10.09 9.59
% Mean Accuracy 101.98 101.10 99.50 97.50
Between Batch Precision and Accuracy
N 18 18 18 18
Mean 3.0720 1.0041 0.0996 0.0199
SD 0.25690 0.11484 0.00854 0.00215
%CV 8.36 11.44 8.57 10.80
[image:6.612.43.573.52.550.2]% Mean Accuracy 102.40 100.41 99.61 99.72
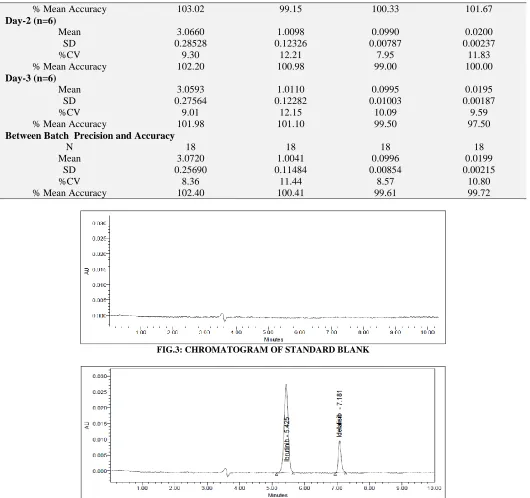
FIG.3: CHROMATOGRAM OF STANDARD BLANK
FIG.4: CHROMATOGRAM OF SEPARATION OF DRUG AND INTERNAL STANDARD
3.7 Recovery of analyte: The result of recovery study is given in Table 8 and 9. The results are within acceptance limit. The acceptable limit was
[image:6.612.38.573.636.733.2]% CV of recovery at each QC level and for IS should be ≤ 15.00 %. The overall mean recovery % CV for all QC levels should be ≤ 20.00 %.
TABLE 8: RECOVERY OF ANALYTE
Sample
HQC MQC LQC
Un extracted Response
Extracted Response
Un extracted Response
Extracted Response
Un extracted Response
Extracted Response
Mean (n=6) 186199.3 151624.2 63151.8 57828.0 8897.2 7549.3
SD 532.26 491.63 235.17 735.52 69.41 78.20
% CV 0.29 0.32 0.37 1.27 0.78 1.04
% Mean
Overall %
Mean Recovery 85.951
Overall SD 5.1580
Overall % CV 6.00
TABLE 9: REOVERY OF INTERNAL STANDARD
S. no. Un extracted Area Ratio Extracted Area Ratio
Mean (n=6) 35742.7 32575.7
SD 339.40 481.29
% CV 0.95 1.48
% Mean Recovery 91.14
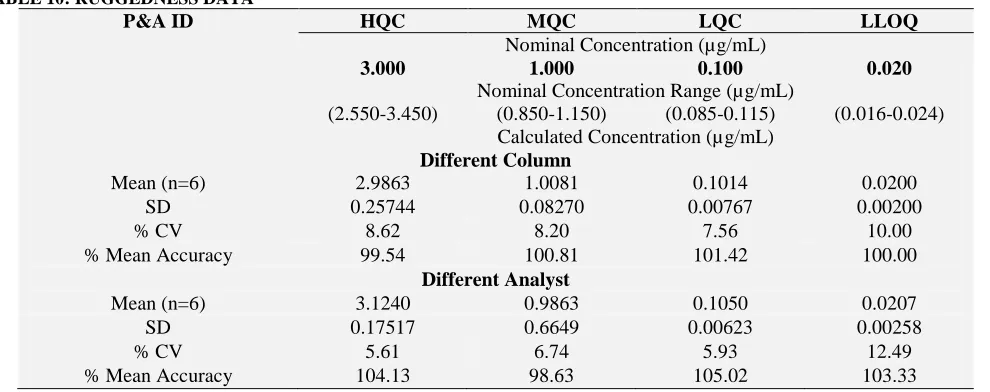
3.8 Ruggedness:
The results of ruggedness study for Idelalisib was within acceptance limit. The data is represented in
Table 10. The precision and accuracy values for different columns with different analysts ranged from 5.61% to 12.49% and 98.63% to 104.13%.
TABLE 10: RUGGEDNESS DATA
P&A ID HQC MQC LQC LLOQ
Nominal Concentration (µg/mL)
3.000 1.000 0.100 0.020
Nominal Concentration Range (µg/mL)
(2.550-3.450) (0.850-1.150) (0.085-0.115) (0.016-0.024) Calculated Concentration (µg/mL)
Different Column
Mean (n=6) 2.9863 1.0081 0.1014 0.0200
SD 0.25744 0.08270 0.00767 0.00200
% CV 8.62 8.20 7.56 10.00
% Mean Accuracy 99.54 100.81 101.42 100.00
Different Analyst
Mean (n=6) 3.1240 0.9863 0.1050 0.0207
SD 0.17517 0.6649 0.00623 0.00258
% CV 5.61 6.74 5.93 12.49
% Mean Accuracy 104.13 98.63 105.02 103.33
3.9 Stability studies: Zero hours, Long batch, LT at -28◦C and LT at -80ºC results of LQC, MQC and HQC were found to more than 95%, which is
within acceptance limit. The results were complied in Table 11.
TABLE 11: STABILITY DATA
Sample Nominal Concentration (µg/mL) Mean Calculated Concentration
(µg/mL) ±SD. (n=6) % CV
Stability on day zero
HQC 3.000 3.1153±0.142 4.57
LQC 0.100 0.1022±0.008 7.72
Long batch at -28°C
HQC 3.000 3.0102±0.155 5.17
LQC 0.100 0.0979±0.012 12.06
Long batch at -80°C
HQC 3.000 3.0753±0.162 5.76
LQC 0.100 0.0952±0.006 6.76
CONCLUSION: The objective of this work was to develop a simple, cost-effective, rugged and sensitive method for determination of Idelalisb in plasma by using Ibrutinib as internal standard. The work shows less run time while comparing with
[image:7.612.58.553.256.452.2]Idelalisib with a correlation coefficient of r2 0.999. The intra-batch and inter-batch precision (%CV) across five levels (LLOQ, LQC, MQC, HQC, and ULOQ) is less than 13.53. This can be validated according to USFDA guidelines.
ACKNOWLEDGEMENTS: The authors are very much thankful for management of V.V. Institute of Pharmaceutical sciences, and Spectrum Pharma, India, for supporting to do this work.
CONFLICT OF INTEREST: The authors declare that there is no conflict of interests.
REFERENCES:
1. Raedler LA. Zydelig (Idelalisib): First-in-Class PI3 Kinase Inhibitor Approved for the Treatment of 3 Hematologic Malignancies. American Health & Drug Benefits. 2015; 8(Spec Feature):157-162.
2. Richard R. Furman, M.D., Jeff P. Sharman et.al, Idelalisib and Rituximab in Relapsed Chronic Lymphocytic Leukemia. The new england journal of medicine. 2014 March, 370 (11).
3. S Ramanathan, F Jin, S Sharma, et. al, Clinical Pharmacokinetic and Pharmacodynamic Profile of Idelalisib. Clin Pharmacokinet. 2016 Jan; 55(1):33-45.
4. Graf SA, Gopal AK. Idelalisib for the treatment of non-Hodgkin lymphoma. Expert Opin Pharmacother. 2016 Feb; 17(2):265-74.
5. Jennifer R. Brown, Idelalisib, an inhibitor of
phosphatidylinositol 3-kinase p110δ, for relapsed/ refractory chronic lymphocytic leukemia. Blood. 2014 May 29; 123(22): 3390–3397.
6. National Center for Biotechnology Information. Pub Chem Compound Database; CID=11625818, https://pubchem ncbi.nlm.nih.gov/compound/11625818 (accessed June 7, 2016).
7. Maddocks KJ, Ruppert AS, Lozanski G, et al. Etiology of Ibrutinib Therapy Discontinuation and Outcomes in Patients with Chronic Lymphocytic Leukemia. JAMA Oncol. 2015;1(1):80-87. doi:10.1001/jamaoncol.2014.218. 8. S. Cheng, J. Ma, A. Guo et al., “BTK inhibition targets in
vivo CLL proliferation through its effects on B-cell receptor signaling activity,” Leukemia, 2013,vol. 28, no. 3, pp. 649–657.
9. National Center for Biotechnology Information. PubChem Compound Database; CID=24821094, https://pubchem ncbi.nlm.nih .gov/compound/24821094 (accessed June 9, 2016).
10. U. S. Department of Health and Human Services, Food, and Drug Administration, Guidance for Industry, Bioanalytical Method Validation, U. S. Department of Health and Human Services, FDA, 2001.
All © 2013 are reserved by International Journal of Pharmaceutical Sciences and Research. This Journal licensed under a Creative Commons Attribution-NonCommercial-ShareAlike 3.0 Unported License.
This article can be downloaded to ANDROID OS based mobile. Scan QR Code using Code/Bar Scanner from your mobile. (Scanners are available on Google Playstore)
How to cite this article: