IJPSR (2014), Volume 5, Issue 9 (Research Article)
Received on 07 March 2014; received in revised form, 18 April 2014; accepted, 01 July 2014; published 01 September 2014
ANALYTICAL METHOD DEVELOPMENT AND VALIDATION OF TRICLOSAN IN DENTAL FORMULATIONS
P. Mahitha, B. M. Gurupadayya * and R. S. Chandan
Department of Pharmaceutical Analysis, JSS College of Pharmacy, JSS University, Mysore - 570015, Karnataka, India.
ABSTRACT: The present study is a simple rapid, sensitive, selective and reproducible RP-HPLC method has been developed for the estimation of Triclosan in dental formulations. In present work a simple, sensitive and specific method (RP-HPLC assay, stability indicating RP-HPLC) has been developed by using a phenomenex, BDS C18, column having 5 µm particle size and 150 mm × 4.6 mm in length and gradient mode, with mobile phase containing acetic acid buffer (pH 2.5, adjusted with formic acid) and acetonitrile in the ratio of 30:70. The flow rate was 1.2 mL/min and effluents were monitored by PDA detector at 281nm. Injection volume was 20 µL. The method is linear (1-50 µg/mL). The regression equation was y = 7311x-2307 (r2 = 0.997). The method was validated for linearity, precision, accuracy, ruggedness, and forced degradation studies were performed. Estimation of triclosan was done in 3 dental formulations. Recoveries from formulations were between 98% and 102%. Limit of detection and limit of quantification was 0.101433 and 0.3333µg/mL, respectively. All the validation parameters are within the acceptance range.
INTRODUCTION: Triclosan (5-chloro-2-(2,4-dichlorophenoxy)phenol) Fig. 1 is a strong broad-spectrum anti-microbial agent used in many consumer products, such as anti-bacterial soaps, toothpaste, cosmetics, clothing, kitchenware, and toys1. Triclosan is a relatively small molecule , with a molecular weight of 289.54 g/mol and a diameter of about 7.4 Å2. It is a white solid at standard temperature and pressure, with a boiling point in the range of 280-290 °C and a melting point in the range of 56-58 °C. Triclosan has a low partition coefficient (log Po/w= 4.7) 3. The partition coefficient is a ratio of solubility between two liquids, typically octanol and water.
QUICK RESPONSE CODE
DOI:
10.13040/IJPSR.0975-8232.5(9).3810-16
This article can be accessed online on
www.ijpsr.com
DOI link: http://dx.doi.org/10.13040/IJPSR.0975-8232.5(9).3810-16
[image:1.612.49.301.643.732.2]Triclosan discharged into surface waters through wastewater effluents react photochemically to form polychlorinated dibenzo-p-dioxins 4. From the literature review, it is known that various methods have been reported. A gas chromatography-tandem mass spectrometry (GC-MS/MS) 5 has been developed for the simultaneous analysis of different classes of preservatives like benzoates, bronidox, 2-phenoxyethanol, parabens, BHA, BHT and triclosan in cosmetic products.
FIG 1: STRUCTURE OF TRICLOSAN
Liquid chromatography (HPLC)/GC-MS method for triclosan in personal health care products6-9, Keywords:
RP-HPLC method, Triclosan, Validation, Stability studies Correspondence to Author: B. M. Gurupadayya
Department of Pharmaceutical Analysis, JSS College of Pharmacy, JSS University, Mysore - 570015, Karnataka, India.
human milk 10, GC–MS analysis in Indian rivers 11, dentifrices 12 hydrogel patches 13, and Dioxin 14 photoproducts has been developed. Some combination analytical methods developed for triclocarban (TCC), triclosan (TCS) and Methyl-triclosan (MTCS) in environmental water, by using silicon dioxide/polystyrene composite micro-spheres solid-phase extraction and detection with HPLC-ESI-MS method 14.
From the literature review, it is known that various methods have been reported for the estimation of triclosan, and it was found that stability indicating methods for triclosan in dental formulations by RP-HPLC was not reported. Hence an attempt has been made to develop a simple and accurate method for the estimation of triclosan in dental formulations.
The objective of the study was to develop and validate new stability indicating RP-HPLC method for estimation of triclosan in dental formulations.
MATERIALS & METHODS:
Instrumentation: Chromatographic separation was performed on Shimadzu UFLC system consist of model LC20AD having autosampler and photo diode array (PDA) detector. LC solution software was applied for data collecting and processing.
Chromatographic Conditions: The method has been developed by using a phenomenex, BDS C18, the column having 5 µm particle size and 150 mm × 4.6 mm in length and gradient mode, with mobile phase containing acetic acid buffer (pH2.5, adjusted with O-phosphoric acid) and acetonitrile in the ratio of 30:70. The flow rate was 1.2mL/min, and effluents were monitored by PDA detector at 281 nm.
Chemicals and Reagents: Triclosan drug was obtained from Vivimed Private Limited, India. Acetonitrile of HPLC grade was procured from Merck Chemical Laboratories, Bangalore, India. Milli-Q-water was used throughout the process. Acetic acid, formic acid is of analytical reagent grade of Merck Pharmaceuticals. All chemicals and reagents used were of HPLC grade only.
Method Development:
Selection of Mobile Phase: The drug triclosan was injected with different mobile phases at different ratios with different flow rates till a sharp peak, without any interference peaks containing spectrum was obtained. The mobile phase selected was an acetic acid buffer (pH 2.5), and acetonitrile in the ratio 30:70.
Preparation of Mobile Phase: Solution A: Acetonitrile;
Solution B (Buffer): Buffer solution is prepared by dissolving 5 mL of acetic acid in 395 mL of Millipore water and sonicated to dissolve, then filtered through 0.45µ membrane filter;
Mobile Phase: 30 volumes of solution A and 70 volumes of solution B.
Preparation of Standard Stock Solution: 10mg of Triclosan working standard was transferred into 100 mL volumetric flask add about 40 mL of Methanol and sonicated to dissolve, and volume made with diluents (100 µg/mL Triclosan). The calibration curve was drawn with concentration range 1-50 μg/mL. The peak was eluted at Rt 5.1
minutes, chromatograms of blank and standard triclosan were shown in Fig. 2 and 3.
Working Standard Solutions: Transfer aliquots of the above standard stock solution into a series of 10 mL volumetric flasks and dilute to volume with methanol to obtain a concentration range of 1-50 μg/mL.
Extraction of Triclosan from dental formulations:
Method: The samples of Pepsodent sensitive (sample1), Senoquel-F (sample 2) and SHYOR mouth wash (sample 3) were purchased from the local supermarket. Initially, 20 or 50 mg of sample was placed in a 40 mL glass-centrifuge tube and mixed with 20 mL of ethanol. The mixture was immersed in an ultrasonic bath and extracted for 20min at room temperature. The solution was then centrifuged at 6000 rpm for 10minutes; the supernatant 50 µL was transferred to a vial and are analyzed.
RESULTS AND DISCUSSION: Method Validation:
System Suitability: To verify that the analytical system is working properly and can give accurate and precise results, the system suitability parameters are to be set. System suitability tests are used to verify the reproducibility of the chromatographic system. To ascertain its effectiveness, system suitability tests were carried out on freshly prepared standard solutions. Results are shown in Table 1.
TABLE 1: SAMPLE SUITABILITY PARAMETER
Parameters Values
The wavelength of the max absorbance (nm) 281
Retention time (min) 5.15±0.10
Tailing Factor 0.947
Theoretical Plate 13777.964
R.S.D of multiple injections (Amount, six replicates)
0.012
Limit of detection (LOD) (μg/mL) 0.101
Limit of quantification (LOQ) (μg/mL) 0.338
Linearity: The linearity of an analytical method is its ability to elicit test results that are directly or by a well-defined mathematical transformation proportional to the concentration of an analyte in samples within a given range. The study was
[image:3.612.310.567.173.433.2]performed by preparing standard solutions of the Triclosan at eight different concentrations, and analyzes were performed in triplicate. The calibration curve was constructed by plotting average peak area against concentration and regression equation was computed. The results were shown in Table 2. The linearity curve of triclosan was represented in Fig. 4.
FIG. 4: CALIBRATION CURVE OF TRICLOSAN
TABLE 2: LINEARITY PARAMETERS
Parameters Values
Linearity range (μg/mL) 1-50 Regression equation Y=7311x-2307 Regression coefficient (R2 ) 0.997
Slope 7311
Intercept 2307
Precision: The precision of an analytical method is the degree of agreement among individual test results when the method is applied repeatedly to multiple sampling of a homogenous sample. The precision of the analytical method is usually expressed as the standard deviation or relative standard deviation (coefficient of variation) of the series of measurement.
Method Precision: In method precision, a homogenous sample of a single batch should be analyzed six times. This indicates whether a method is giving consistent results for a single batch. The method precision was performed on triclosan formulation. The % RSD of the assay value for six determinations shall not be more than 2.0%. Results are shown in Table 3 and 4.
TABLE 3: INTRADAY PRECISION
Concentration (µg/mL)
Inj 1 Peak area
Inj 2 Peak area
Inj 3 Peak area
Average Std. Deviation %
RSD
5 27661 27281 27192 27196.3 73.1 0.2
20 145921 145856 145661 145821.7 135.30 0.09
TABLE 4: INTERDAY PRECISION Concentration
(µg/mL)
Inj 1 Peak area
Inj 2 Peak area
Inj 3 Peak area
Average Std. Deviation %
RSD
5 15239 15809 15269 15439 320.7 1.69
20 117093 119752 117752 118199 1384.7 0.956
50 255632 259059 254895 256528 2222.1 0.86
Accuracy: The accuracy of an analytical method is the closeness of test results obtained by that method to the true value. The accuracy of an analytical method should be established across its range. Accuracy is performed in three different levels for Triclosan, and three different triclosan formulations were analyzed. A spiked known quantity of Triclosan at 50%, 100%, and 150% levels. Analyzed sample in duplicate for each level. From
the results, % recovery was calculated. % Recovery at each spike level shall be not less than 98.0 and not more than 102.0. % RSD for the duplicate observations shall be not more than 2.0. Overall, % RSD for the % Recovery shall be not more than 2.0. Assay of three formulations was shown in
[image:4.612.54.566.265.544.2]Table 5. Peak results for Triclosan in Pepsodent sensitive, Senoquel-F, and SHYOR mouth wash were shown in Table 6, 7, and 8, respectively.
TABLE 5: ASSAY RESULTS OF TRICLOSAN
Formulations Drug Amount of drug labeled Amount of drug estimated % of label claim
Sample1 Triclosan 0.3% 0.28 93%
Sample 2 Triclosan 0.3% 0.27 90%
Sample3 Triclosan 0.3% 0.29 96.6%
TABLE 6: ACCURACY RESULTS OF PEPSODENT SENSITIVE Target
concentration
Weight of sample taken (mg)
Peak area
Total amount after spiking (mg)
Amount recovered (mg)
% recovery
% mean recovery
% RSD
80 0.6 128079 18 17.8 99.07 99.18 1.219
100 0.8 169721 24 23.5 98.04
120 1 328195 45 45.2 100.45
TABLE 7: ACCURACY RESULTS OF SENOQUEL-F Target
concentration
Weight of sample taken (mg)
Peak area
Total amount (mg)
Amount recovered (mg)
% recovery
% mean recovery
% RSD
80 0.6 133012 18 18.5 102 101.03 0.940
100 0.8 176619 24 24.5 101
120 1 327056 45 45.05 100.1
TABLE 8: ACCURACY RESULTS OF SHYOR MOUTH WASH Target
concentration
Weight of sample taken (mg)
Peak area
Total amount (mg)
Amount recovered (mg)
% recovery
% mean recovery
% RSD
80 0.6 129011 18 17.9 99.7 99.54 0.836
100 0.8 170619 24 23.6 98.5
120 1 329056 45 45.3 100.1
Procedure:
Accuracy at 80%, 100% and 120%: Accurately 0.6gm, 0.8gm, and 1gm of triclosan formulation was taken respectively for 80%, 100%, and 120% and extracted. From this 1mL was taken in each along with 15ppm standard was taken in 10 mL volumetric flask and sonicated it for 10 minutes. Filter this through 0.45µ nylon filter. Further volumes were made up to 10 mL with diluents and mixed well.
Robustness: Robustness was done by changing the column temperature (±5°C), flow rate (±10%), changing the wavelength (±5° nm), pH of buffer solution (±0.2 units) for15μg/mL concentration. All the system suitability parameters must be met as per the method. Robustness was analyzed by changing the parameters like flow rate, pH of buffer, and wavelength, and the results were recorded in Table 9.
TABLE 9: ROBUSTNESS
Parameter Actual value Changed value Rt Peak area Changed value Rt Peak area
Flow rate 1.2 mL/min 1 mL/min 5.18 144842 1.3 4.18 150141
Buffer pH 2.5 2.4 5.10 171264 2.6 5.17 168825
Ruggedness: An aliquot (15μg/mL) was injected to
study the ruggedness of Triclosan by two different analytical chemists (Analyst-1and Analyst -2) and
[image:5.612.54.562.529.694.2]the results were recorded in Table 10 and are in the acceptable range for Triclosan. The results showed the % R.S.D. was less than 2% respectively.
TABLE 10: RUGGEDNESS CONCENTRATION PREPARED BY DIFFERENT ANALYST
Ruggedness Analyst -1 Analyst -2
No. of Injection Retention time Peak area Retention time Peak area
Injection-1 5.109 146782 4.921 147445
Injection-2 5.135 149892 5.112 141289
Injection-3 5.140 147888 5.141 142326
Injection-4 5.181 147347 5.128 142276
Injection-5 5.091 149895 5.151 144557
Injection-6 5.172 148654 4.968 147654
Average 5.138 148409.7 5.070 144257.8
Std Dev. 0.03 1304.9 0.099 2766.048
%RSD 0.67 0.879 1.959. 1.91
Forced Degradation Studies: The following are the stress conditions which were followed for forced degradation studies:
Acid degradation
Alkali degradation
Peroxide degradation
UV light degradation
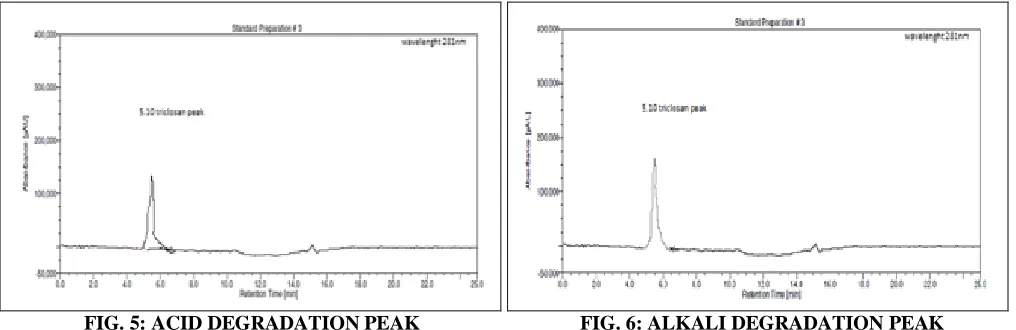
Acid Stress Degradation: Test preparation was subjected to acid stress degradation by treating the sample with hydrochloric acid. The % degradation was evaluated by calculating the % assay and by comparing the assay results with the assay of unstressed sample.
Test Preparation: 50 mg of paste is weighed and extracted with 20 mL of ethanol. This is sonicated, centrifuged and the supernatant liquid is collected.8ml of the extract is transferred flask and
added 1 mL 0.1N Hydrochloric acid, and allowed to stand for 4 h and neutralized with 1mL of 0.1N sodium hydroxide and filtered through syringe filters and injected. Acid degradation peak was shown in Fig. 5.
Alkali Stress Degradation: Test preparation was subjected to alkali stress degradation by treating the sample with sodium hydroxide.
Test Preparation: 50 mg of paste is weighed and extracted with 20 mL of ethanol. This is sonicated, centrifuged and the supernatant liquid is collected. 8 mL 0f extract is transferred flask and added 1 mL 0.1N sodium hydroxide, and allowed to stand for 4 h and neutralized with 1mL of 0.1 N hydrochloric acids and filtered through syringe filters and injected.Degradation peak was shown in Fig. 6.
FIG. 5: ACID DEGRADATION PEAK FIG. 6: ALKALI DEGRADATION PEAK
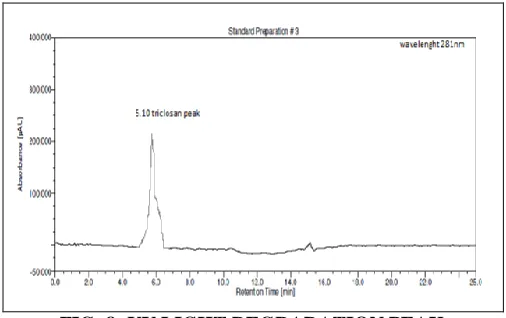
Peroxide Stress Degradation: Test preparation was subjected to peroxide stress degradation by treating the sample with peroxide.
8 mL of extract is transferred flask and add 1 mL of 3% v/v Hydrogen peroxide, allowed to stand for 4 h and filtered through syringe filters and injected.
Degradation peak was shown in Fig. 7.
FIG. 7: PEROXIDE DEGRADATION PEAK
UV Degradation: Test preparation was subjected to UV light for a 4 h time.
[image:6.612.48.300.119.273.2]Test Preparation: 50 mg of paste is weighed and extracted with 20mL of ethanol. This is sonicated, centrifuged and the supernatant liquid is collected. 10mL of the extract is transferred flask and subjected to UV light for 4 h, and filtered through syringe filters and injected. Degradation peak was shown in Fig. 8.
FIG. 8: UV LIGHT DEGRADATION PEAK
Based on the forced degradation studies, the proposed analytical method can be considered as stability-indicating the method and can be used for release and stability studies for effective evaluations. Degradation results for sample 1, sample 2, and sample 3 are shown in Table 11, 12,
and 13, respectively. Drug (triclosan) is stable to acid, alkali, peroxide, and UV light degradation within the range in the ICH guidelines.
TABLE 11: DEGRADATION OF PEPSODENT
SENSITIVE
Parameter Peak area of unstressed
Peak area of the stressed
sample
% sample degraded
Acid 113292 97730 13.8
Base 113292 96945 14.5
Peroxide 113292 92977 17.9 UV light 113292 86933 23.27
TABLE 12: DEGRADATION OF SENOQUEL-F Parameter Peak area of
the unstressed sample
Peak area of a stressed
sample
% degraded
Acid 113292 79593 29.75
Base 113292 88160 22.19
Peroxide 113292 86248 23.81 UV light 113292 100794 11.04
TABLE 13: DEGRADATION OF SHYOR MOUTH WASH
Parameter Peak area of the unstressed
sample
Peak area of the stressed
sample
% degraded
Acid 113292 83640 26.2
Base 113292 89012 21.5
Peroxide 113292 92040 18.8 UV light 113292 85454 27.1
CONCLUSION: The method involves a simple and precise method for the determination of triclosan in the dental formulation. The method was validated according to ICH guidelines. The triclosan was eluted at 5.1 minutes Fig. 3, with linearity in the range of 1-50 µg/mL and correlation coefficient (r2) of 0.997. The limit of detection (LOD) was calculated and found to be 0.101µg/mL and the limit of quantification (LOQ) was found to be 0.338 µg/mL. Intraday precision values of %RSD were found to be in the range of 0.07-0.2% and interday precision values were 0.86-1.69% for triclosan. In degradation study, it showed no additional peaks in the chromatograms Fig. 5, 6, 7
and 8 indicating that triclosan is stable in acidic, alkali, peroxide and photodegradation. Hence the proposed method is more precise, accurate and robust. So. this method can be applied for the estimation of triclosan in quality control studies for routine analysis.
ACKNOWLEDGEMENT: The authors are thankful to the Principal, JSS College of Pharmacy, Mysore for providing facilities to carry out research work.
[image:6.612.47.300.439.598.2]REFERENCES:
1. Chiao-Yin C, Yu-Chen W, Hsin-Chang C and Wang-Hsien D: Simplified derivatization method for triclosan determination in personal care products by gas chromatography-mass spectrometry. Journal of the Chinese Chemical Society 2011; 58: 49-52.
2. Rossner A, Snyder S and A Knappe: Removal of emerging contaminants of concern by alternative adsorbents, Water Research 2009; 43: 3787-96.
3. Van Loveren C, Bujis JF and Ten M: The effect of a triclosan toothpaste on enamel demineralization in a bacterial demineralization modelization. Journal of Antimicrobial Chemotherapy 2000; 45: 153-58.
4. Anger Cale T, Sueper C, Blumentritt D, McNeill K, Engstrom D and Arnold: Quantification of triclosan, chlorinated triclosan derivatives, and their dioxin photoproducts in lacustrine sediment cores. Environmental Science and Technology 2013; 47: 1833-43.
5. Alvarez-Rivera G, Vila M, Lores M, Garcia-Jares C and Llompart M: Development of a multi-preservative method based on solid-phase microextraction-gas chromatography-tandem mass spectrometry for cosmetic analysis. Journal of Chromatography A 2014; 1339: 13-25.
6. Piccoli A, Fiori J, Andrisano V and Orioli M: Determination of triclosan in personal health care products by liquid chromatography (HPLC) Il Farmaco 2002; 57: 369-72. 7. Ming-Jen C, Ya-Ting L, Chiao-Wen L, Ponnusamy VK and
Jen-Fon J: Rapid determination of triclosan in personal care products using new in-tube based ultrasound-assisted salt-induced liquid-liquid microextraction coupled with high-performance liquid chromatography-ultraviolet detection. Analytica Chimica Acta 2013: 767: 81-87.
8. Liu T and Wu D: High-performance liquid chromatographic determination of triclosan and triclocarban in cosmetic products, International Journal of Cosmetic Science 2012; 34: 489-94.
9. Ye X, Bishop AM, Needham LL and Calafat AM: Automated on-line column-switching HPLC-MS/MS method with peak focusing for measuring parabens, triclosan, and other environmental phenols in human milk. Analytica Chimica Acta 2008; 622: 150-56.
10. Ramaswamy BR, Shanmugam G, Velu G, Rengarajan B and Larsson DGJ: GC–MS analysis and ecotoxicological risk assessment of triclosan, carbamazepine and parabens in Indian rivers. Jou of Hazardous Mater 2011; 186: 1586-93. 11. Demkowicz MP, Chauhan V, Stern DA and Vasquez FG:
Simultaneous determination of anions and triclosan in dentifrices by gradient ion chromatography and isocratic high- performance liquid chromatography interfaced with conductivity and ultraviolet detection. Journal of Chromatography A 1994; 671: 351-57.
12. Tae-Wan L, Jin-Chul K and Sung-Joo H: Hydrogel patches containing Triclosan for acne treatment. European Journal of Pharmaceutics and Biopharmaceutics 2003; 56: 407-12. 13. Anger CT, Sueper C, Blumentritt DJ, McNeill K, Engstrom
DR and Arnold WA: Quantification of triclosan, chlorinated triclosan derivatives, and their dioxin photoproducts in lacustrine sediment cores. Environmental Science and Technology Letters 2013; 47: 1833-43.
14. Yinan W, Pengfei L, Yan L, Bing C, Jinyu L and Xikui W: Determination of triclocarban, triclosan and methyl-triclosan in environmental water by silicon dioxide/polystyrene composite microspheres solid-phase extraction combined with HPLC-ESI-MS. Journal of Geosciences and Environment Protection 2013; 1: 13-17.
All © 2013 are reserved by International Journal of Pharmaceutical Sciences and Research. This Journal licensed under a Creative Commons Attribution-NonCommercial-ShareAlike 3.0 Unported License.
This article can be downloaded to ANDROID OS based mobile. Scan QR Code using Code/Bar Scanner from your mobile. (Scanners are available on Google Playstore)
How to cite this article: