2016 International Congress on Computation Algorithms in Engineering (ICCAE 2016) ISBN: 978-1-60595-386-1
1 INTRODUCTION
In today’s fast-paced developing society, each country regards its own country’s valuable resources as treas-ures and even causes territorial sovereignty and other international disputes with its neighboring countries, causing great concern in the world. There are many reasons for these international issues, of which an important reason is the definition ambiguity of each country’s map. On this basis, this paper combines with the adaptive principle and extraction of feature points to establish an adaptive definition model of the fron-tier map based on the special purpose of the fronfron-tier map in order to specify and improve the frontier boundaries. Many predecessors make a lot of contri-butions to the development of the frontier map:
In 2011, in Research of Key Algorithm of Real-time Dynamic Multi-resolution Display of the Large-scale Terrain, Zhang Junfeng researched the local im-portance of the sampling sites starting from the sam-pling sites with different rules and obtained a better three-dimensional Douglas-Peucker algorithm through analogy of the map generalization principle, thus lay-ing the foundation to display the terrain three-dimensional sense of reality [1].
In 2013, in Research of Key Terrain Data
Extrac-tion and ReducExtrac-tion Methods based on DEM Network 3D GIS, Niu Lijuan researched the conversion of 2D GIS into 3D GIS, and combined with the mesh model simplification technique to find that there are some key data points in the two-dimensional topographic data. These key data points play a crucial role in the mesh simplification [2].
In 2011, in Research of Local Nonlinear Variation of Vector Map based on Feature Points, Fu Qianliang proposed two non-linear variation models and applied it to local variation processing of the map, so as to obtain key points of the vector map and achieve im-portant achievements through special processing of key points [3].
In 2012, in Research of Digital Watermarking Al-gorithm and Applications for Vector Geographic Data, Wang Qisheng analyzed the existing defects in the robust watermarking algorithm of the vector geo-graphic data conversion domain, and proposed a new robust watermarking model of the vector geographic data conversion domain, and achieved the digital wa-termarking prototype system of the vector geograph-ical data [4].
Based on the researches of the predecessors, this paper combines the adaptive principle with the extrac-tion of feature points to establish an adaptive
defini-Research of Adaptive Definition Model of Frontier
Map Based on Feature Points
Yanling Jiang1, Fei Gao1 & Lin Yang2
1
College of Geography and Tourism, Yunnan Normal University, Kunming, Yunnan, China 2
Yunnan University, Kunming, Yunnan, China
ABSTRACT: With increasingly tense social development resources, once involved in territorial issues between the countries, there must be fight for every inch of land. Therefore, it is particularly important to develop a fron-tier map. This paper combines with the adaptive principle and extraction of feature points to establish an adaptive definition model of frontier map based on the special purpose of the frontier map. And this paper first obtains a scatter diagram of the relationship between the scale limit and negative load by calculating the negative load of the electronic map, and then obtains a curvilinear equation through the differential fitting, so as to find out key feature points to reflect the variation trend of the curve. This paper finally establishes an adaptive definition model of the frontier map, and establishes seven key scales developed by the frontier defining map, so as to make a significant contribution to develop a perfect electronic map of the national boundary.
tion model of the frontier map. This paper first obtains a scatter diagram of the relationship between the scale limit and negative load by calculating the negative load of the electronic map, and then obtains a curvi-linear equation through the differential fitting, so as to find out key feature points to reflect the variation trend of the curve. And finally, it establishes an adaptive definition model of the frontier map and seven key scales developed by the frontier defining map, so as to make a significant contribution to develop a perfect electronic map of the national boundary and play an important significance in maintenance of the frontier peace.
2 ADAPTIVE DISPLAY PRINCIPLE OF THE
ELECTRONIC MAP
The map is an important means to record, transmit and acquire the geographic information. In the present society, with increasingly fierce resource competition between the countries, there must be fight for every inch of land on the border issue. Therefore, the role of map becomes increasingly important. The develop-ment and design of the traditional electronic map is mostly from the perspective of the professional knowledge of the designer. However, due to the con-straints of the geographical knowledge level, the users are unable to acquire the information on the map well. Therefore, this paper puts forwards the adaptive dis-play of the map from the perspective of users, and considers different user needs and characteristics, and improves the efficiency in recording, transmitting and acquiring information.
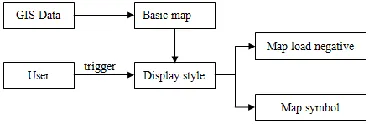
This paper puts forward the adaptive display pro-cess of the electronic map from the perspective of adaption of the electronic map, as shown in Figure 1: First, combine GIS data with the basic requirements of the map for symbolic processing so as to obtain a basic map, and then generate a certain trigger rules when the user operates the electronic map, so as to
[image:2.516.271.456.86.148.2]change the map display style, which is mainly the change of map symbol and load negative.
Figure 1. Adaptive display process.
Combined with the principle of adaptive display process in Figure 1, this paper initially narrows the gap between designers and users (GIS data and user), and then systematically researches the adaptive dis-play of the electronic map from the theory, the tech-nology and application based on the classification of user needs and the establishment and reconstruction of the dynamic database and adaptive symbolic pro-cessing. Its framework principle is shown in Figure 2.
As shown in Figure 2, at the application level of the adaptive display of the electronic map, this paper de-signs adaptive display trigger conditions for the mili-tary purpose combined with the milimili-tary purpose of the frontier map. Through analysis of the user infor-mation, this paper obtains the user needs on the map information, and then establishes targeted trigger con-ditions, so that the content and form displayed by the map is more clear, concise and important.
At the theoretical level, according to trigger condi-tions and cartography theory of the electronic map, it researches the electronic map display theories and methods under appropriate conditions, and also re-searches the scale displayed on the map, the elements in each scale and the symbolic issues. This paper will describe the key technology of the scale in Section III in detail.
At the technical level, it mainly researches the data model, visualization technology and adaptive display implementation mechanism of the electronic map.
[image:2.516.128.385.491.655.2]3 KEY TECHNOLOGY OF SCALE BASED ON FEATURE POINTS
3.1 Calculation of map negative load
As an indicator to measure the level of information’s detail on the screen in unit area, the map negative load is not only an important indicator to affect the clarity of map display, but also an important factor to estab-lish multi-scale display models. And there is a great diversity of methods to acquire the negative load. Furthermore, this paper acquires the negative load through conversion of the negative load on the paper map. The negative load of the map is an important symbol to measure the amount of content in the map. And its calculation method is shown in the Formula 1:
n i i G f F M p 1 2 (1)Where: FG is a total area of mapping area; M is a
denominator of the map scale; n is the number of fea-ture; f is the symbol area; p is the map negative load.
The symbol size of the electronic map is greater than 2.5 to 3 times the symbol size of general drawing. Due to the impact of the symbol size and screen reso-lution, the map negative load is too large under normal circumstances, resulting in symbol congestion. There-fore, in order to weaken the symbol congestion, this paper makes the denominator of the drawing scale multiply by 0.8 and then finds that the screen display scale is the best at this time. At this time, the acquired relationship between the map negative load and the drawing negative load is shown in Formula 2:
PAP G
G
SCR f P
F M f
F M
p (0.8 ) 0.64 0.64
2 2
(2)Next, combined with the negative load data in the Reference [6], and assuming that μ=2.8, this paper acquires the negative load data of the electronic map, as shown in Table 1.
3.2 Determination of key scale based on feature points
Combined with the above calculation formula of the negative load, the negative load of the electronic map is greater than the negative load of the paper map, but the negative load of the electronic map is similar to the trend of the negative load of the paper map with the change rules of the screen. The paper map scale and negative load changes are distributed with S type, so this paper believes that the electronic map scale and negative load changes are also distributed with S type. That is to say, the negative load changes of the elec-tronic map are not linear but gradual and steep. Therefore, this paper establishes a multi-scale display model based on the feature points and obtains the limit negative load of the scale through analyzing the
change laws of the negative load of the electronic map and carries out the data curve fitting process. Next, this paper introduces the implementation process which is combined with Matlab. The first is the data preprocessing procedure. The data preprocessing mainly includes two steps: “equal step length” and “smoothness”. The data processing with equal step length is actually a differential process, which can make data acquire a certain degree of smoothness and tendency. This process is consistent with the principle of data fitting; moreover, the equal step length is also good for establishing and solving the fitting model. Next, this paper will briefly introduce the interpolation method.
The interpolation method adopted in this paper is mainly the object interpolation method, that is, express the object of S2(O(S2)) between the scale S1 and the scale S3. And it can be also understood as using an expression of the differential function of O(S1) and O(S3)by the same geographical entity in the location of S2 to construct the interpolation functions of O(S1) and O(S3) based on S1 and S3, so as to determine the form of O(S2). On this basis, this paper proposes to adopt the object interpolation method to calculate the nega-tive load of the scale. Assuming that the neganega-tive load under S1 is N1, the negative load under S3 is N3, and the negative load under S2 is Nd, the Formula 3 is shown as
follows: 1 3 3 1 2 1
1 lg /lg
S S N N x S S N N x
d
(3)
Next, this paper establishes a coordinate system, taking the logarithm of the denominator of screen scale data in Table 1 as x-coordinate, and the negative load of the electronic map as y-coordinate. Combined with the above interpolation method and Formula 3, taking the step length as 0.1, the limit negative load of the scale can be obtained through calculation after differential processing, as shown in Table 2.
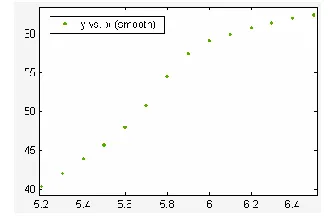
[image:3.516.279.443.501.609.2]According to the data obtained from Table 2, the scatter diagram can be made as shown in Figure 3.
Figure 3. Scatter diagram of limit negative load of the scale.
curve for three points in Figure 4. Through observa-tion, the rational quadratic polynomial fitting program is the best. Therefore, this paper adopts the quadratic rational polynomial for fitting curve. General form of its quadratic polynomial is shown in the Formula 4.
Figure 4. Quadratic fitting result.
1 1 2
2
c x b x
c bx ax y
(4)
Combined with Matlab, the fitted curve is obtained as shown in Figure 4.
Through fitting, the quadratic rational polynomial is obtained as shown in Formula 5:
28 . 32 27 . 11
1613 9 . 578 73 . 52 )
( 2
2
x x
x x
x
f (5)
As can be seen from Figure 4, when x > 6, the nega-tive load of the map no longer increases and it tends to decrease slightly. Therefore, this paper defines the polynomial zone as[5.2,6.47].
3.3 Determination of feature points
Feature points are some points representing the curve characteristics. For S-shape curve in Figure 4, five feature points describe the trend characteristics, which are respectively the starting point A, terminal point B, inflection point G and two maximum curvature points M and N. Through the derivation of the first order and second order by the above fitting curve formula 5, the inflection point and maximum curvature point on
curve can be determined. x-coordinate of the feature points is respectively shown as follows:
966 . 5 , 371 . 5 , 673 . 5 , 47 . 6 , 2 .
5
B G M N
A X X X X
X
[image:4.516.57.462.134.177.2]To display and connect with the main feature points in Figure 4, Figure 5 can be obtained as follows:
Figure 5. Distribution diagram of main feature points.
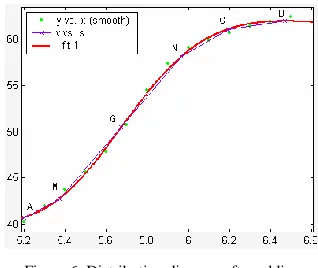
As can be seen from Figure 5, the connection lines between main features points A and N can reflect the variation trend of the curve. However, the curvature difference between the points N, B is too large, so it is difficult to reflect the variation trend of the curve. Therefore, this paper further adds a feature point C XC=6.193 as shown in Figure 6, which can accurately
reflect the variation trend of the curve.
[image:4.516.81.226.250.368.2]Figure 6. Distribution diagram after adding the feature point C.
Table 1. Limit negative load of the drawing and electronic map scale.
Drawing scale (10,000) 1:20 1:50 1:100 1:200 1:400
Area negative load of drawing 25.2 29.8 36.2 38 39
Screen scale 1:16 1:40 1:80 1:160 1:320
Area negative load of electronic map 40.32 47.68 57.92 60.8 62.4
Table 2. Limit negative load of each scale after differential processing.
X 5.2 5.3 5.4 5.5 5.6 5.7 5.8 5.9 6.0 6.1 6.2 6.3 6.4 6.5
Denominator of scale
(10,000) 16 20 25 32 40 50 63 80 100 126 160 200 250 320
[image:4.516.283.441.271.398.2] [image:4.516.282.441.520.654.2]According to above six feature points obtained, taking 10 as a base number, and x-coordinate as an exponent, the denominator of the key scale can be obtained through calculation, as shown in Table 3.
4 ESTABLISHMENT OF ADAPTIVE DEFINITION MODEL OF THE FRONTIER MAP BASED ON FEATURE POINTS
The adaptive definition model is a mathematical mod-el used to suitably and perfectly display the distribu-tion characteristics of the geographic elements on the screen within a certain display range, or considered to be controlled by several display scales within a certain range, so as to ensure the suitability of the electronic map and the clarity of display. If there is (are) n num-ber (s) of key scale Si (i=1,2,…n), its multi-scale
dis-play model can be expressed by Formula 6:
n i U U S U n i S S S S U i n n i i i i i 2 , 1 : ) , ( 1 1 ) ,( 1 1
(6)
Combined with the features points in the Section III and key scale data in Table 3, six display scales can be determined. The adaptive definition model is estab-lished as follows:
1
U = [1 : 3000000, 1 : 1600000] 2
U = [1 : 1600000, 1 : 1000000]
3
U = [ 1 : 1 0 0 0 0 0 0 , 1 : 5 0 0 0 0 0 ]
4
U = [1 : 500000, 1 : 250000]
5
U = [1 : 250000, 1 : 160000] 6
U = [1 : 160000,∞]
For the frontier electronic map, when the display scale is 1: 3,000,000, it shows that, the borders gener-alization is unable to be displayed on a screen, so the minimum display scale must be smaller than 1:300. Therefore, this paper determines two scales of 1:10,000,000 and 1:6,000,000 between 1:3,000,000 and 1:30,000,000.
In this way, it is basically able to demonstrate the basic issues of the national boundary. Through the above researches in this paper, there are a total of seven key scales required by the frontier defining map. The adaptive definition model of the frontier map is displayed as follows:
1
U = [1 : 30000000, 1 : 10000000]
2
U = [ 1 : 1 0 0 0 0 0 0 0 , 1 : 6 0 0 0 0 0 0 ] 3
U = [ 1 : 6 0 0 0 0 0 0 , 1 : 3 0 0 0 0 0 0 ] 4
U = [ 1 : 3 0 0 0 0 0 0 , 1 : 1 6 0 0 0 0 0 ] 5
U = [ 1 : 1 6 0 0 0 0 0 , 1 : 1 0 0 0 0 0 0 ] 6
U = [ 1 1 0 0 0 0 0 0 , 1 : 5 0 0 0 0 0 ]:
7
U = [1 : 500000,∞]
5 CONCLUSION
This paper takes into account the purpose of the fron-tier map from the perspective of the users, and puts forward an adaptive definition model, and improves the traditional electronic map design and display mode, thus improving the information transmission efficien-cy. The adaptive definition has a great significance. First, the map can make a dynamic adjustment along with the scale so that the image is clear, and the con-tinuous change in the negative load is in line with people’s cognitive requirement; second, the adaptive definition allows the designers and users to have uni-form space cognition, thus improving the inuni-formation transmission efficiency.
For map development, this paper puts forward the concept of the electronic map of the national boundary, and combines the adaption with the electronic map of the national boundary to enrich the manifestation of the electronic map about the national boundary and establish an adaptive definition model of the frontier map and the seven key scales of the frontier defining map, so as to make a significant contribution to further improve the electronic map of the national boundary.
REFERENCES
[1] Zhang Junfeng. 2011. Research of key algorithm of re-al-time dynamic multi-resolution display of the large-scale terrain. Wuhan: Wuhan University. [2] Niu Lijuan. 2013. Research of key terrain data extraction
and reduction methods based on DEM network 3D GIS. Shenyang: Shenyang University of Technology. [3] Fu Qianliang. 2011. Research of local nonlinear
varia-tion of vector map based on feature points. Harbin: Har-bin Engineering University.
[4] Wang Qisheng. 2012. Research of digital watermarking algorithm and applications for vector geographic data. Zhengzhou: PLA Information Engineering University. [5] Toepfer. 2013. Cartographic generalization. 1st Edition.
Beijing: Surveying and Mapping Press.
[6] Liu Wenqiang, & Yang Haizhong. 2012. A new method of road feature point extraction application in electronic map. Xi’an: Basic Department of Xijing University. [7] Dai Yazhen. 2007. Research of display template of
mili-tary electronic topographic map. Beijing: Surveying and Table 3. Numerical value of key scale.
X coordinate 5.2 5.371 5.673 5.966 6.193 6.47
Denominator of key scale (10,000) 16 25 50 100 160 300
Mapping Department of PLA Information Engineering University, pp: 4.
[8] Chen Yufen, & Jiang Nan. 2011. Map design principles. Beijing: PLA Publishing House.
[9] Lu Zi, & Wang Ran. 2015. Boundary bias representa-tions faced by China in electronic maps (atlas): reality and solution. Journal of Tsinghua University (Natural Science), 46 (S1): 1178-1184.
[10] Yang Meng. 2011. Research of copyright protection method of remote sensing image map based on feature points. Harbin: Harbin Engineering University. [11] Brusilovsky P. 2008. Methods and Techniques of
Adap-tive Hypemedia. User Modeking and User-Adapted In-teraction, 6(2): 87-129.