Munich Personal RePEc Archive
Some effects of tax information services
reliability and availability on tax
reporting behavior
Vossler, Christian A. and McKee, Michael and Jones, Michael
Department of Economics and Howard H. Baker Jr. Center for
Public Policy, University of Tennessee, Appalachian State
University, Bridgewater State University
June 2011
Online at
https://mpra.ub.uni-muenchen.de/38870/
June 2011
Some Effects of Tax Information Services Reliability and Availability
on Tax Reporting Behavior
1Christian Vossler, University of Tennessee Michael McKee, Appalachian State University
Michael Jones, Bridgewater State University
1. Introduction
To “encourage” correct tax reporting it is likely that enforcement effort, audits and
penalties, will continue to be a primary tool in the tax authority’s arsenal. However, many tax
agencies are exploring complementary instruments of which one is the provision of information
and assistance services to taxpayers. This revised paradigm recognizes that tax administrators
have a role as facilitators and a provider of services to taxpayer-citizens. Almost everyone
agrees that the personal income tax system in the US is complex. It is counterproductive to make
information resolving the complexity costly to obtain and/or unreliable.2 Further, the “service”
paradigm for tax administration fits squarely with the perspective that emphasizes the role of
social norms play in tax compliance (Feld and Frey, 2002).
The effect of such service programs on tax reporting is an open empirical question but
intuitively, more reliable and available service programs will be more likely to positively affect
tax reporting behavior. Testing such a proposition requires an analysis of individual-level data
under alternative information service settings. While some changes in the service programs have
1
Funding provided by IRS under TRNO – 09Z – 00019. The views expressed are those of the authors and do not reflect the opinions of the IRS or of any researchers working within the IRS. An earlier version was presented at the New Perspectives on Tax Administration: An IRS-TPC Research Conference, June 22, 2011. We are grateful to the participants and to Marsha Blumenthal in particular for comments that improved the paper.
2
been undertaken in the past, there is not a full spectrum of such programs in existence and so
field data are incomplete. Just as important, even for taxpayers that undergo a full audit, the
determination of tax liability is vulnerable to audit error.
As an alternative to analyzing field data, our research utilizes controlled laboratory
experiments with human decision makers and salient financial incentives. Within the laboratory,
we determine (hence, know) the true tax liability, and then identify the effects of information
services by systematically varying the setting across groups of players. In particular, our
experimental design varies the degree of accessibility and accuracy of information services. Our
design allows us to observe both the tax reporting behavior as well as the propensity of the
taxpayer to obtain information by making information acquisition a (sometimes costly) choice.
2. Experimental Design and Treatments
Our experimental design includes many of the fundamental elements of the voluntary
reporting system of the U.S. individual income tax. In each decision period of the experiment,
participants earn income by performing a task and self-report their tax liability to a tax authority.
Tax liability is (possibly) uncertain, and is a function of earned income, the tax rate, and tax
credits applied. If an audit occurs, unreported taxes are discovered without error. If the
participant has evaded taxes both the unpaid taxes and a penalty are collected. The participant’s
earnings for the decision period, which are denominated in “lab dollars”, are her earned income
less taxes paid (and penalties, if applicable). The overall earnings for the experiment are the sum
of the lab dollars earned over all decision periods multiplied by a common (and known) lab to
US dollar exchange rate. We discuss further the details of the experiment below.
In each period of the experiment, participants earn income based upon their performance
Those who finish the task the fastest earn the highest income of 1500 lab dollars for the period,
those who finish in the middle of pack earn 1250 lab dollars, and the slowest earn 1000 lab
dollars. Participants are presented information about the distribution of group earnings to ensure
that they believe the relative nature of the earnings. The earnings task is the only source of
interaction and payoff interdependence; the design implements a blind setting among the
participants.
After earning income, participants are presented with a screen that informs them of the
earnings information and the tax policy parameters (tax rate, audit probability, and penalty rate)
which are fixed throughout the experiment.3 The decisions the participants make in the period
are whether to request an information service (if one exists) and how much to claim in tax
credits. Although other institutional details are embedded in the design (e.g. tax rate, taxable
income, etc.), and in particular the tax form, the participant can only manipulate her tax liability
through her credit reporting choice. As there are penalties for tax under reporting if audited, and
foregone earnings associated with over-paying taxes, there is value to resolving any uncertainty
regarding the tax credit. The expected tax credit starts at 1000 for an income of zero and declines
at a rate of 0.5 for each additional dollar of income. The amount of the credit is high relative to
the initial tax liability so that the credit decision is financially salient.
We implement uncertainty in the credit by placing uniform distributions around the
3
expected credit amounts, and then randomly drawing from the distributions to determine the true
credit amounts. In particular, the true credit amount can be anything in the range of the expected
credit plus or minus 100%. With uncertainty, prior to making a credit choice or acquiring
information (if possible), each participant sees the supports of the uniform distribution that
coincides with her income. If an information service is available, participants can acquire the
information with the click of a button.4
The participants are informed of the audit probability and the penalty rate, and know
these values with certainty. In all sessions we fix the tax rate at 50% of earned income, the audit
probability at 30%, and the penalty rate at 300% of unpaid taxes. Our audit rate is much higher
than actual full audit rates in the United States. However, the IRS conducts a range of audits,
and for many types of audits the actual rates are quite high.5 The penalty rate is consistent with
penalties imposed by the IRS for tax underreporting. Enforcement effort is held constant since
the effects of enforcement efforts have been widely investigated and we only need this effort to
be salient in the current setting to give value to the information that resolves tax liability
uncertainty.6 Table 1 reports the key parameters of the experiment.
Participants are able to revise their credit decision prior to filing their return, and the tax
form updates their tax liability as the claimed credit is revised. Thus, they can observe the
potential changes in their reported tax liability for each potential reporting strategy they
4
Such information reduces the cognitive burden of computing tax liabilities. The issue of tax liability uncertainty differs from enforcement uncertainty. As Alm, Jackson, and McKee (1992b) demonstrate, the tax authority may use enforcement uncertainty to increase compliance. Theory predicts that uncertain penalties increase compliance by risk-averse agents and this is borne out in the data from a set of experiments. Alm and McKee (2006) extend this and report on the compliance effects of informing the taxpayer their return will be audited with certainty.
5
While overall audit rates are quite low, among certain income and occupation classes they are more frequent. The oft-reported IRS audit rate (currently less than one percent) is somewhat of an understatement. This reported rate usually refers to full audits. In fact, the IRS conducts a wide range of audit-type activities, including line matching and requests for information, and these activities are much more frequent. For example, in 2005 only 1.2 million individual returns (or less than one percent of the 131 million individual returns filed) were actually audited. However, in that year the IRS sent 3.1 million “math error notices” and received from third parties nearly 1.5 billion “information returns”, which are used to verify items reported on individual income tax returns.
6
investigate. A timer at the bottom of the tax form counts down the remaining time. The
participants are allowed 90 seconds to file and the counter begins to flash when there are fifteen
seconds remaining. Thus, the process in the lab mimics that by which a taxpayer may well
conduct different calculations in the time prior to actually filing her taxes (whether he or she uses
one of the available tax software programs or simply does the tax return by hand). If an
information service is available, this can be requested at any time.
Audits are determined by the use of a “virtual” bingo cage that appears on the computer
screen. A box with blue and white bingo balls appears on the screen following the tax filing.
The ratio of blue to white balls determines the audit probability. The balls begin to bounce
around in the box, and after a brief interval a door opens at the top of the box. If a blue ball
exits, the participant is audited; a white ball signifies no audit. The audit applies only to the
current period declarations, not to previous (or future) periods. The computer automatically
deducts taxes paid and penalties (if any are owed) from participants’ accounts.
When an audit occurs, the true value of the credit is used to determine taxes owed. The
individual’s declarations are examined. If the individual has under-reported her tax liability, she
must make up for the difference as well as pay a penalty. If an individual has over-reported their
tax liability no over payments are returned to the individual.7 Tax revenues and any penalties
paid are not distributed to the participants; tax collections are not used to provide a public good
in order to ensure that the participants focus on the individual income disclosure decision and not
on any public good provision decision. After the tax return is filed and an audit (if any) is
determined, participants see one final screen that summarizes everything that happened during
the period. This process is repeated for a total of 20 paid rounds, but to minimize potential
7
of-game effects the number of rounds is not disclosed.
2.1 Participant pool and detailed procedures
The experiments were conducted at dedicated experimental laboratories at the University
of Tennessee and Appalachian State University, which both utilized the same software and
experimental protocol, and have similar computer networks. The participant pools included
students and non-students (university staff, mostly).8 Student and non-students participated at
separate times, and the lone difference in student versus non-student sessions is that the latter
utilized a higher lab dollar to US dollar exchange rate (375 to 1 versus 750 to 1) in order to
reflect the higher opportunity cost of participation. Recruiting was conducted using the Online
Recruiting System for Experimental Economics (ORSEE) developed by Greiner (2004).
Databases of potential participants were built using announcements sent via email to university
students and staff. Registered individuals were contacted, via email, and were permitted to
participate in only one tax experiment.9 Only participants recruited specifically for a session
were allowed to participate, and no participant had prior experience in this experimental setting.
Methods adhere to all guidelines concerning the ethical treatment of human participants.
Earnings averaged $25 for student participants and $45 for non-students. Sessions lasted between
60 and 90 minutes. A total of 730 participants took part in these sessions.
The experiment session proceeds in the following fashion. Each participant sits at a
computer located in a cubicle, and is not allowed to communicate with other participants. The
instructions are conveyed by a series of computer screens that the participants read at their own
pace, with a printed summary sheet provided and read aloud by the experimenter (see Appendix
for an example). Clarification questions are addressed after the participants have completed the
8
An individual session included only students or non-student participants – they were not mixed in a session. 9
instructions and two practice rounds. The participants are informed that all decisions will be
private; the experimenter is unable to observe the decisions, and the experimenter does not move
about the room once the session starts to emphasize the fact that the experimenter is not
observing the participants’ compliance decisions. This reduces, to the extent possible, peer and
experimenter effects that could affect the decisions of the participants. All actions that
participants take are made on their computer. After the 20 paid decision periods, participants are
asked to fill out a brief questionnaire which collects basic demographics including information
on tax reporting experience. Payments are made privately at the end of the session.
2.2 Treatments
We employ a between-subjects design, where the treatment variables across sessions are
the presence/absence of an information service, the quality of the service if provided, and the
cost of obtaining the information. These are held constant throughout a session. There are five
basic treatments (see Table 2). The first (T1) is a treatment with certain tax liability, which we
use as a baseline for comparison against uncertain information treatment. In this treatment,
participants are automatically given information on their true credit. In the second treatment
(T2), the individual’s tax credit is uncertain and there is no information service available. This
establishes a second baseline for comparison. In the remaining three treatments, there is an
information service available. The status quo in the information service treatments, i.e. if the
information service is not utilized, is identical to the uncertainty baseline.
The “perfect” information service reveals the true credit with certainty (T3). Under the
other two information service types, the service is imperfect in the sense that up to two possible
credit amounts can be provided and each amount has a 50% chance of being correct.
simultaneously provides two credit amounts, one of which is the truth while the other is a decoy.
With the “sequential” information service (T5), the participant can make up to two information
requests and with each request is delivered one possible credit amount. If two requests are made,
then the simultaneous and sequential services reveal the same information. However, the
sequential information treatment leaves the possibility that only one credit amount is delivered,
in which case it still has the same 50% chance of being the truth.
To assess the value of information services, we vary (between sessions) the cost to
acquire information in the information service treatments (see Table 1). The three cost levels are
$0, $50 and $100 for the perfect and the simultaneous information settings. For the sequential
setting, these costs are halved and assessed separately for the two sources.
2.3 Testable hypotheses
To derive testable implications based on economic theory, we draw heavily from the
theoretical model derived in Vossler, McKee and Jones (2010). In particular, the experimental
game described above represents a special case of the theory, one in which the taxpayer makes a
decision on a single “line item” and the taxpayer is required to file a return. With our
experimental parameters, assuming risk neutrality, when the true credit is certain the taxpayer
will optimally choose to report truthfully. When the credit is uncertain, for all levels of earned
income, the taxpayer will over-claim the credit. The extent of the deviation from truthful
reporting increases with the level of uncertainty. As those with the lowest income have the
widest range of possible credits, theory suggests the highest relative amount of over-claiming for
these individuals. Point predictions from the theory have that it is optimal to over-report the tax
credit by 333 lab dollars for those with earned income of 1000, over-report by 250 for those with
Tying in the imperfect information service, when the uncertainty is reduced to two
possible credit outcomes, the optimal decision is to report one of the two possible amounts. With
our chosen parameters it is optimal to choose the higher of the two amounts. Intuitively, it is not
optimal to choose something in the middle of the two amounts as, in expectation, you forego an
allowable credit and pay a larger penalty. Theoretically, although the information is nevertheless
valuable to the player, tax underreporting is actually higher with two information sources than in
the case of no information (i.e. the base uncertainty situation). This is a general theoretical result
that does not depend on our choice of parameters. Intuitively this is driven by the fact that under
full uncertainty one’s decision is driven by the expected value of the underlying credit
distribution – which is the true credit –, whereas the higher (lower) of the two draws is away
from the truth on average. But, to be clear here, the information is valuable to the player.
The decision of whether to request the information service(s) to resolve (some)
uncertainty is driven by the value of information. Theoretically, and quite intuitively, the
taxpayer’s willingness-to-pay (WTP) is increasing in the level of uncertainty as well as the
accuracy of the information. In the context of the experimental design, those with lower incomes
face a larger range of uncertainty and, ceteris paribus, have a higher WTP for information.10
Further, knowing the true credit is more valuable than receiving two possible amounts only one
of which is correct.11 In terms of point predictions, since information has value, in all situations
information should be requested when it is free. At the other extreme, in all situations no
information should be requested at our highest cost amount of 100 (or 50 for one imperfect
information source). At the middle cost amount, those at the lowest income level should request
10
This may be partially offset by the income effect since information is expected to be a normal good. 11
the information (imperfect or perfect), at the middle income level it is beneficial to request
perfect information, and it is not beneficial for those with high income to request information.
The main testable implications of the theory are summarized below as formal hypotheses:
Hypothesis 1. The level of tax underreporting is higher when tax liability is uncertain.
Hypothesis 2. Tax underreporting increases with the level of uncertainty (i.e. decreases with income)
Hypothesis 3. Tax underreporting decreases when information services are provided.
Hypothesis 4.Tax underreporting decreases when information service quality improves.
3. Results of the Data Analysis
In the analysis that follows, we largely let the data “speak” by specifying OLS regression
models that simply allow the mean outcome to differ across unique experiment scenarios. As
such, the purpose of the regression is largely to estimate appropriate standard errors for the
means and to facilitate hypothesis testing. On this note, to control for possible heteroskedasticity
and autocorrelation of unknown form, we use robust standard errors with clustering at the
participant-level. Further, heteroskedasticity and autocorrelation robust t and F statistics are used
when evaluating hypotheses. To more parsimoniously illustrate some key patterns in the data, we
also estimate models that implement some additional structure.
Tables 3 – 5 present three models using the credit decision data.12 In all models we use as
the dependent variable the difference between the credits claimed on the tax form and the
expected amount of the credit. Formulating the dependent variable in this way allows the model
parameters to be interpreted as the average amount of tax underreporting. The expected credit
12
depends upon treatment conditions and is measured from the perspective of the participant.13
That is, in our baseline certainty treatment or when perfect information is obtained in Treatment
3, the expected credit is simply the true credit. In uncertainty treatments where no information is
acquired, the expected credit is simply the midpoint of the uncertainty interval. When two
sources of information are obtained in Treatments 4 and 5, the expected credit is the average of
the two. Finally, with one (imperfect) information source, the expectation is simply the average
between the information draw and the midpoint of the uncertainty interval.
Model I estimates the average level of tax underreporting separately by each income level
and each treatment. Model II extends the analysis to allow the average level of underreporting to
be based on whether an information service was acquired and, if so, the type of service. To
accomplish this, we define four new experiment “conditions”. The first includes observations
from information service treatments where information was not acquired (“No Information”).
The remaining three correspond to observations where information was acquired: “Perfect
Information” is associated with Treatment 3; “Two Information Sources” is associated with
Treatment 4, and those in Treatment 5 who sequentially requested information from both
sources; and “One Information Source” is associated with Treatment 5 for those who obtained
one of the two available services. Finally, the main effects of income and information cost
(where relevant), are estimated by experiment condition in Model III.
One prominent effect, as evidenced by all models, is that the tax underreporting is
increasing in income (i.e. decreasing with the degree of uncertainty). This is in the opposite
direction predicted by theory (Hypothesis 2), but consistent with our earlier findings in a related
13
experiment (Vossler, McKee and Jones, 2010). A second, basic implication of the theory is that
the presence of uncertainty increases tax underreporting (Hypothesis 1). Comparing our certainty
and uncertainty baselines, there is weak evidence of this effect. Underreporting is roughly 60 to
70 lab dollars higher for all income levels, but this difference is only marginally significant at the
middle income level (p-value=0.08; based on Model I or II). Inconsistent with Hypothesis 3,
levels of under reporting do not differ based on the quality of the information service. In
particular, there are no statistical differences across the three information service conditions,
either by income level (Model II: p=0.83 @1000; p=0.55 @1250; p=0.36 @1500) or, based on
the main effects specification, we fail to reject the null hypothesis of equal intercepts, income
effects and cost effects across the three conditions (Model III: F6,729=1.39; p=0.22). Further, even
with all participants pooled regardless of whether they acquired information, there are no
differences across Treatments 3, 4 and 5 (Model I: p=0.78 @1000; p=0.77 @1250; p=0.41
@1500).
Our most important findings are that information services decrease tax underreporting for
those that acquire the information and – even though services are acquired roughly 58% of the
time – for the service treatments as a whole (i.e. Hypothesis 4 is supported). The joint finding is
most important since information acquisition is a choice, and it could simply serve to sort the
players into inherently compliant and non-compliant groups – with the overall effect of
information being a wash. Model II illustrates that those who access the information service have
the lowest levels of underreporting. In fact, those receiving information under report roughly
80%, 70% and 60% less, across the respective income levels, as compared to those in the
uncertainty baseline. The differences in tax underreporting levels is statistically significant
baseline, uncertainty baseline or no information condition (at any income level). Also evident
from Model II, participants in the information service treatments who do not acquire information
(i.e. the “No Information” subgroup) tend to have reasonably high levels of underreporting,
albeit similar to the levels of underreporting in the uncertainty baseline.
Model I supports the finding that there is overall less tax underreporting in the
information service treatments. Comparing Treatments 3, 4 and 5 with the uncertainty baseline
suggests overall tax under reporting is cut in half. In eight of the nine possible cases,
underreporting is significantly different – and lower – for the information service treatment
relative to the uncertainty baseline. The lone exception is when comparing Treatment 4 and the
uncertainty baseline at the high income level, where the effect is in the expected direction but
marginal (t=1.62; p=0.11). We summarize the results based on our analysis of the credit decision
succinctly below:
Result 1.Tax underreporting decreases with the level of uncertainty (i.e. increases with income).
Result 2.The quality, as measured by accuracy, of the information service has no effect on tax underreporting.
Result 3.Those who acquire information underreport significantly less than those who do not. Further, unconditional on whether the information service was acquired, the
availability of information services has the overall effect of reducing tax underreporting.
4. Concluding remarks
Our most important finding is that, as predicted by economic theory, the provision of
information – even when the quality is low – significantly increases tax compliance. Other
hypotheses are not fully supported by the data and undoubtedly more about taxpayer behavior
effects for these treatments but other work using data from similar experimental settings suggests
that observed behavior is broadly consistent across pools (Alm, Bloomquist, and McKee,
2011).14 Further research is being undertaken with the data reported in this paper to investigate
the decision to acquire information as well as the factors affecting the propensity to take a second
“draw” in the sequential information setting.
When the tax system is complex taxpayers are predicted to respond positively to the
provision of information services that reduce the costs of computing true tax liabilities. The
results reported here demonstrate that, first, with tax uncertainty the level of underreporting
increases, second, when information services are provided the level of underreporting is lowered,
and third, that the aggregate level of underreporting is lowered even when only a fraction (58%)
of the participants avail themselves of the information service. The experimental setting does
not incorporate a cost of the service to the tax agency but the improved underreporting behavior
suggests a potential for a positive return from this service. As a final observation, the
participants respond to the costs of the service in a predictable fashion. While the “costs” in the
experimental setting are monetary, we would expect a similar response to higher costs in the
form of transaction costs, including waiting time. We are currently researching this topic.
14
Further, as noted above, Alm, Bloomquist, and McKee (2011) demonstrate the external validity of the
experimental setting through a series of comparisons with field data results. This effectively addresses the criticisms of some who have questioned the use of lab experiments in tax compliance research (see Gravelle, 2008
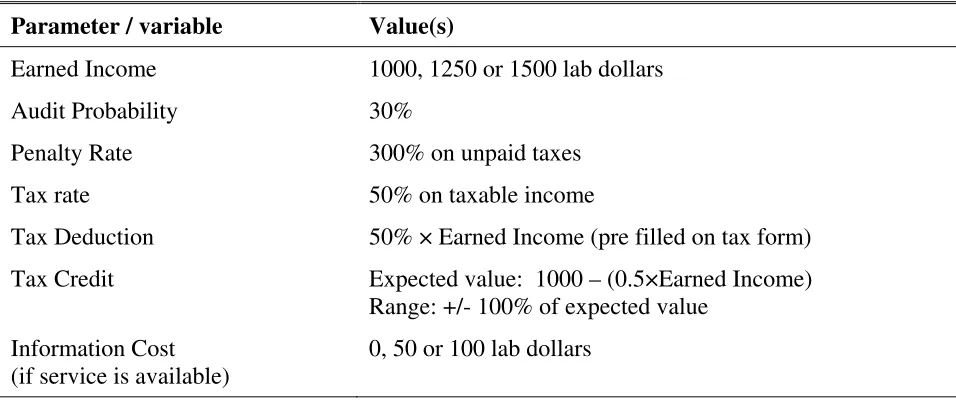
Table 1. Experiment Parameters
Parameter / variable Value(s)
Earned Income 1000, 1250 or 1500 lab dollars
Audit Probability 30%
Penalty Rate 300% on unpaid taxes
Tax rate 50% on taxable income
Tax Deduction 50% × Earned Income (pre filled on tax form)
Tax Credit Expected value: 1000 – (0.5×Earned Income) Range: +/- 100% of expected value
Information Cost (if service is available)
0, 50 or 100 lab dollars
Table 2.Experiment Treatments
Tax Liability Uncertain
Service Provided?
No
One Source (Complete and Correct)
Two Simultaneous Sources (One
Correct)
Two Sequential Sources (One
Correct)
No T1 N/A N/A N/A
Yes T2 T3 Price of
Information: $0, $50, $100
T4 Price of Information: $0, $50, $100
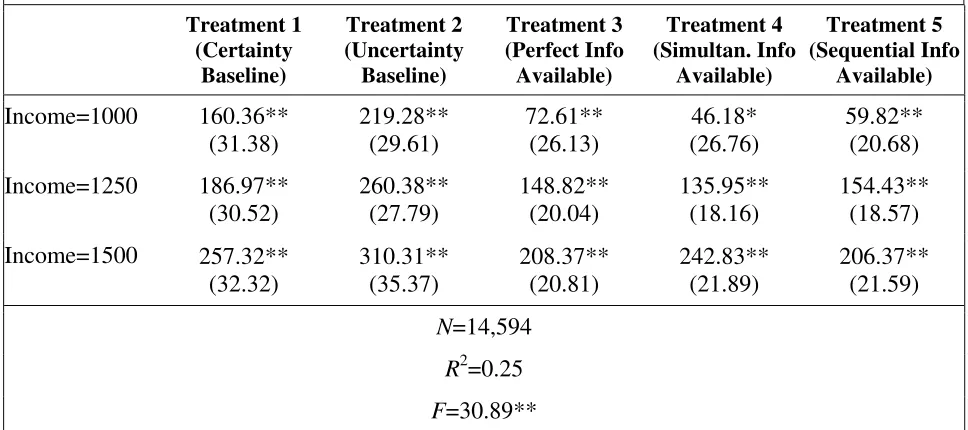
[image:16.612.62.504.366.521.2]Table 3.Credit Decision Model I
Dependent Variable: Credit claimed – (Expected) credit
Treatment 1 (Certainty Baseline) Treatment 2 (Uncertainty Baseline) Treatment 3 (Perfect Info Available) Treatment 4 (Simultan. Info Available) Treatment 5 (Sequential Info Available)
Income=1000 160.36** (31.38) 219.28** (29.61) 72.61** (26.13) 46.18* (26.76) 59.82** (20.68) Income=1250 186.97** (30.52) 260.38** (27.79) 148.82** (20.04) 135.95** (18.16) 154.43** (18.57)
Income=1500 257.32** (32.32) 310.31** (35.37) 208.37** (20.81) 242.83** (21.89) 206.37** (21.59) N=14,594
R2=0.25
F=30.89**
[image:17.612.73.555.431.680.2]Note: * and ** denotes estimates that are statistically different from zero at the 10% and 5% significance levels, respectively. Cluster-robust standard errors are in parentheses.
Table 4.Credit Decision Model II
Dependent Variable: Credit claimed – (Expected) credit
Experiment Condition Certainty Baseline Uncertainty Baseline No Information Perfect Information Two Information Sources One Information Source
Income=1000 160.36** (31.38) 219.28** (29.61) 76.67** (24.83) 46.79** (22.45) 45.21** (16.75) 22.82 (36.57) Income=1250 186.97** (30.52) 260.38** (27.79) 218.84** (19.07) 72.20** (20.10) 98.21** (12.59) 91.50** (27.16) Income=1500 257.32** (32.32) 310.31** (35.37) 363.36** (21.01) 111.39** (17.52) 143.04** (14.43) 117.73** (44.99) N=14594
R2=0.29
F=28.79**
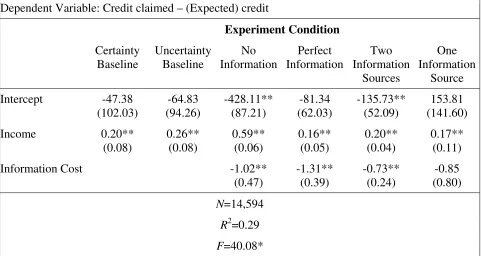
Table 5. Credit Decision Model III
Dependent Variable: Credit claimed – (Expected) credit
Experiment Condition Certainty Baseline Uncertainty Baseline No Information Perfect Information Two Information Sources One Information Source Intercept -47.38 (102.03) -64.83 (94.26) -428.11** (87.21) -81.34 (62.03) -135.73** (52.09) 153.81 (141.60)
Income 0.20** (0.08) 0.26** (0.08) 0.59** (0.06) 0.16** (0.05) 0.20** (0.04) 0.17** (0.11)
Information Cost -1.02**
(0.47) -1.31** (0.39) -0.73** (0.24) -0.85 (0.80) N=14,594
R2=0.29
F=40.08*
References
Alm, James, Kim Bloomquist, and Michael McKee, 2011, “On the External Validity of Tax Compliance Experiments,” prepared for presentation at 2011 IRS Research Conference, Washington, DC.
Alm, James, Todd Cherry, Michael Jones, and Michael McKee, 2008. “Encouraging Filing via Tax Credits and Social Safety Nets,” The IRS Research Bulletin: Proceedings of the2008 IRS Research Conference, pp 43 – 57.
____________________________________________, 2010.“Taxpayer Information Assistance Services and Tax Reporting Behavior.”Journal of Economic Psychology 31 (4): 577-586.
Alm, James, Betty R. Jackson, and Michael McKee. 1992a. “Estimating the Determinants of Taxpayer Compliance with Experimental Data.” National Tax Journal 65 (1): 107-114.
__________________________________. 1992b. “Institutional Uncertainty and Taxpayer Compliance,” American Economic Review, 82 (4): 1018-1026.
Alm, James and Michael McKee. 2006. “Audit Certainty and Taxpayer Compliance.” National Tax Journal 59 (4): 801-816.
Cadsby, C. Bram, Elizabeth Maynes, and Viswanath Umashanker Trivedi. 2006. “Tax Compliance and Obedience to Authority at Home and in the Lab: A New Experimental Approach,” Experimental Economics, 9 (4): 343-359.
Feld, Lars and Bruno Frey. 2002. “Trust Breeds trust: How Taxpayers are Treated,” Economics of Governance, 3: 87-99.
Gravell, Jane, 2008, “Comments,” The IRS Research Bulletin: Proceedings of the2008 IRS Research Conference, pp 59-60.
Greiner, Ben, 2004. “The Online Recruitment System ORSEE 2.0 - A Guide for the
Organization of Experiments in Economics,” Working Paper Series in Economics 10, University of Cologne, Department of Economics.
Plott, Charles R. 1987. “Dimensions of Parallelism: Some Policy Applications of Experimental Methods.” In Alvin E. Roth (ed.), Laboratory Experimentation in Economics: Six Points of View. New York, NY: Cambridge University Press.
Smith, Vernon. 1982. “Microeconomic Systems as an Experimental Science.” The American Economic Review 72 (5): 923-955.
Appendix. Example Experiment Summary Sheet (Treatment 3, Cost of $50)
Experiment Overview
You will be participating in a market simulation that lasts several decision “rounds”. In each round, you first play an earnings game and then face a tax reporting decision.
In the earnings game, you sort the numbers 1 through 9. Your Income earned is determined by how fast you sort the numbers relative to others. The participant in your group with the fastest time receives the highest Income earned.
In the tax reporting stage, you fill out and file a tax form. How much you earn from the tax reporting decision depends on how much you claim in Tax Credit and whether or not you are audited. Note that the on-screen instructions do not specify the tax policy parameters (e.g. tax rate, penalty rate, etc.), but those specified below will be in effect for this experiment.
Each round is completely independent from the others, which means your decisions in one round in no way affect the outcome of any other round.
How your earnings are determined each round
On the tax form, your Initial Taxes will be calculated automatically. This amount is determined by multiplying your Income earned by a tax rate of 50%.
You decide how much to claim in Tax Credit on the tax form. Each dollar you claim in credits reduces your Final taxes by one dollar. This amount is subtracted from the Initial Taxes to determine your Final Taxes. If Final Taxes is a negative number, this reflects a tax refund.
You will be shown a range of tax credits (this range is highlighted in white on the left side of the decision screen), which depends on your Income earned. Each amount within the range has an equal chance of being your actual tax credit, which is the highest amount you can claim without possible penalty. You can choose to claim any amount between 0 and 1000.
You have an information service available to you at a cost of $50. By clicking on the “Request Information” button you will know the exact amount of your actual tax credit.
You have a 30% chance of being audited. Audits are determined completely at random and do not depend on how much you or anyone else claims in tax credits.
If you are not audited, your earnings for the round are your Income earned minus Final taxes.
If you are audited, but claimed less than or equal to the actual tax credit, your earnings for the round are your Income earned minus Final taxes. Know that if you under-reported the credit you will not receive additional money through the audit process.
If you are audited, and claimed more than the actual tax credit, you pay back the extra tax credit you claimed and also pay a penalty.
o The penalty is equal to 300% multiplied by the amount of extra tax credit you
claimed. Thus, if you claimed an extra $100 your penalty is $100*300% or $300.
o Your earnings for the round are then Income earned minus Final taxes minus the extra