Munich Personal RePEc Archive
An epsilon-based measure of efficiency in
DEA - An alternative method for the
affinity index
Cheng, Gang and Qian, Zhenhua
China Center for Health Development Studies, Peking University, 38
Xueyuan Rd, Beijing, China, University of Science and Technology
Beijing, 30 Xueyuan Rd, Beijing, China
6 November 2011
An epsilon-based measure of efficiency in DEA - An alternative method for the
affinity index
Gang Cheng
China Center for Health Development Studies, Peking University, 38 Xueyuan Rd, Beijing, China
Zhenhua Qian
University of Science and Technology Beijing, 30 Xueyuan Rd, Beijing, China
ABSTRACT
Tone & Tsutsui (2010) introduced a hybrid model (epsilon-based measure, EBM),
which combines both radial and non-radial measures in a unified framework [Tone, K., &
Tsutsui, M. (2010). An epsilon-based measure of efficiency in DEA - A third pole of
technical efficiency. European Journal of Operational Research, 207, 1554-1563.]. We find
that their method to construct the affinity matrix may be questionable. Their method may
not reflect the true degree of scattered distribution of inputs or outputs. Based on Tone &
Tsutsui’s idea, we introduced an alternative method of constructing the affinity matrix,
which overcomes the drawback of their method.
KeyWords: Data Envelopment Analysis; Epsilon-based Measure (EBM); Affinity Index
1.Introduction
Data envelopment analysis (DEA) is a linear programming methodology to evaluate
the technical efficiency for each member of a set of peer decision making units (DMUs)
with multiple inputs and multiple outputs. There are mainly two types of approaches to
measuring technical efficiency in DEA: radial and non-radial. The radial measure was first
introduced by the CCR model developed by Charnes, Cooper, & Rhodes (1978). The
non-radial model is represented by the widely used slacks-based measure (SBM model)
developed by Tone (2001). On the basis of these two types of measures, Tone & Tsutsui
(2010) introduced a hybrid model (epsilon-based measure, EBM), which combines both
epsilon-based measure of efficiency in DEA - A third pole of technical efficiency. European
Journal of Operational Research, 207, 1554-1563.]. In the EBM model, there are two
parameters that need to be determined: a scalar named as epsilon indicating the relative
importance of the non-radial measure over the radial measure, and a vector indicating the
weights of inputs or outputs. To compute these two parameters, Tone & Tsutsui (2010)
constructed an affinity matrix and then the largest eigenvalue of the defined affinity matrix
was used to compute the epsilon, and its associated nonnegative eigenvector was used to
compute the weights of inputs or outputs. However, we find their method to construct the
affinity matrix may be questionable. Their method may not reflect the true degree of
scattered distribution of inputs or outputs. Based on Tone & Tsutsui’s idea, we introduced
an alternative method of constructing the affinity matrix, which overcomes the drawback
of their method.
2.An epsilon-based measure (EBM) of efficiency
The input-oriented EBM model under constant returns to scale technology is used for
demonstration. It can be easily extended to out-orientation and variable returns to scale.
The EBM model is defined as follows:
*
1 0
min
m i i x
i
w s x
0 0,
subject to x Xs
0,
Y y
0,s 0.
where wi is the weight (relative importance) of input i and satisfies
1 1 ( 0 )
m
i i
i w w i
,and εx is a key parameter which indicates the relative importance of the non-radial slacks
over the radial θ. Parameters εx and wi must be supplied prior to the efficiency
measurement, and they should be units-invariant values.
To determine the two parameters, Tone & Tsutsui (2010) constructed an affinity index
between two input vectors instead of the Pearson’s correlation coefficient. The affinity
(P1) Identical: S(a,a) = 1,
(P2) Symmetric: S(a,b) = S(b,a),
(P3) Units-invariant : S(ta,b) = S(a,b) (t > 0), and
(P4) 1≥S(a,b)≥0.
The ‘‘affinity index” S(a,b) was defined as follows:
S(a,b)=1-2D(a,b)
D(a,b) is a diversity index, which indicates the degree of scattered distribution, and
was defined as follows:
1 max min max min max min | | ( ) ( , ) ( )
0 ( )
n j j c c
if c c
D a b n c c
if c c
,where ln j j
b j a
c , 1
1ln
j
j
n b n j a
c
, cmax max( )cj , and cmin min( )cj .The largest value of eigenvalue ρ of the affinity matrix S was used to compute the
epsilon, and its associated nonnegative eigenvector wx was used to compute the weights, as
follows. max( ) 1 x x m m
, and
1 x m xi i w w w
.As discussed in the paper by Tone & Tsutsui (2010), in the narrow range case, the
affinity index should approximate to 1; and in the widely scattered case, the affinity index
should approximate to 0. In their paper, they give an widely scatted example (example 2 in
their paper), the computed affinity index between x1 and x2 is 0. However their example is
too simple to illustrate the rationale of the index, it has only 2 SBM-efficient DMUs. When
we apply their method to a completely scattered case which has more than 2 efficient
DMUS, we get questionable results.
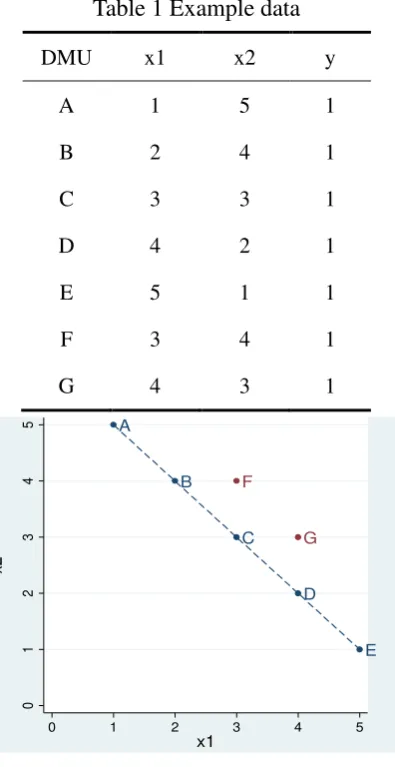
The following example data have two inputs (x1 and x2) and one output (Table1). For
the 5 efficient DMUs (A-E), a decrease in x1 is always accompanied by an equal amount
of increase in x2, which shows the complete substitutability between the two inputs. The
Table 1 Example data
DMU x1 x2 y A 1 5 1 B 2 4 1 C 3 3 1 D 4 2 1 E 5 1 1 F 3 4 1 G 4 3 1
A
B
C
D
E F
G
0
1
2
3
4
5
x2
0 1 2 3 4 5
[image:5.595.192.390.80.464.2]x1
Figure 1 Example data (completely scattered)
According to the rationale of the affinity index, its value should be 0 in such an
scattered case. However using the above method, the computed value of the affinity index
between x1 and x2 is 0.428, and the epsilon is 0.572. This result contradicts the rationale of
the affinity index. (Table 2 and table 3)
Table 2 Diversity matrix for the example data
DMU x1 x2 x1 0 0.286 x2 0.286 0
Table 3 Affinity matrix for the example data
x2 0.428 1
3. An alternative method of computing the affinity index
The questionable result of the affinity index using the method proposed by Tone &
Tsutsui (2010) makes us turn back to the traditional Pearson’s correlation coefficient. The
Pearson’s correlation coefficient conforms to the first three properties (P1-P3), but violates
the last property (P4). Although the range of the Pearson’s correlation coefficient is [-1, 1],
it can be adjusted into [0, 1] according its relationship between the Pearson’s correlation
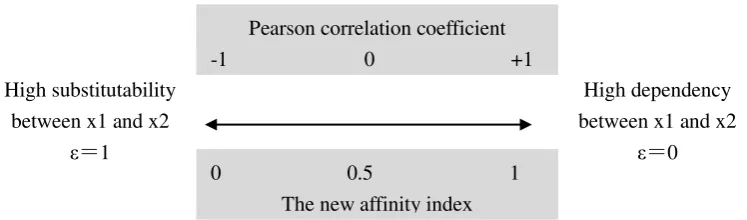
coefficient and the rationale of the affinity index(Figure 2). In the narrow range case, the
two inputs are highly dependent on each other, the Pearson correlation coefficient is equal
to or approximate to 1, and the affinity index should be equal to or approximate to 1; while
in the widely scattered case, the two inputs are highly substitutable for each other, the
Pearson correlation coefficient is equal to or approximate to -1, and the affinity index
should be equal to or approximate to 0. According to the relationship, the new affinity
index can be defined as
S(a,b)=0.5+0.5r(a,b),
where r(a,b) is the Pearson correlation coefficient between a and b.
The new affinity index conforms to all the 4 properties, and overcomes the
[image:6.595.104.478.494.604.2]shortcoming of the method proposed by Tone & Tsutsui (2010) .
Figure 2 Relationship between the Pearson correlation coefficient and the new affinity index
The new affinity index between x1 and x2 of the example data in table 1 is
S(x1,x2)=0.5+0.5 r(x1, x2)=0.5+0.5(-1)=0.
The new affinity matrix is listed in table 4.
Table 4 New affinity matrix for the example data
DMU x1 x2
Pearson correlation coefficient -1 0 +1
0 0.5 1 The new affinity index High substitutability
between x1 and x2 ε=1
High dependency between x1 and x2
x1 1 0 x2 0 1
The largest eigenvalue and eigenvector of the new affinity matrix are max(ρx) = 1. So
we have max( ) 2 1 1
1 2 1
x x
m m
. This result conforms to the rationale of the affinity
index defined by Tone & Tsutsui (2010).
References
Charnes, A., Cooper, W. W., & Rhodes, E. (1978). Measuring the efficiency of decision
making units. European Journal of Operational Research, 2, 429-444.
Tone, K. (2001). A slacks-based measure of efficiency in data envelopment analysis.
European Journal of Operational Research, 130, 498-509.
Tone, K., & Tsutsui, M. (2010). An epsilon-based measure of efficiency in DEA - A third
pole of technical efficiency. European Journal of Operational Research, 207,