EUR 4909
e
COMMISSION OF THE EUROPEAN COMMUNITIES
POST-IRRADIATION ANALYSIS OF
TRINO VERCELLESE REACTOR
FUEL ELEMENTS
1972
Joint Nuclear Research Centre Ispra Establishment - Italy
and
LEGAL NOTICE
This document was prepared under the sponsorship of the Commission of the European Communities.
Neither the Commission of the European Communities, its con-tractors nor any person acting on their behalf :
make any warranty or representation, express or implied, with respect to the accuracy, completeness, or usefulness of the information contained in this document, or that the use of any information, apparatus, method or process disclosed in this document may not infringe privately owned rights; or
assume any liability with respect to the use of, or for damages resulting from the use of any information, apparatus, method or process disclosed in this document.
This report is on sale at the adresses listed on cover page 4
at the price of B.Fr.
150.-Commission of the European Communities
D.G. XIII - C.I.D.
29, rue Aldringen Luxembourg December 1972
EUR 4909
e
COMMISSION OF THE EUROPEAN COMMUNITIES
POST-IRRADIATION ANALYSIS OF
TRINO VERCELLESE REACTOR
FUEL ELEMENTS
by
A.M. BRESESTI, M. BRESESTI, S. FACCHETTI, F. MANNONE,
P. BARBERO, C. CERUTTI, F. MARELL, A. PEIL, R. PIETRA
( Chemistry Division)
R. KLERSY, A. SCHURENKA.MPER, A. FRIGO, E. GHEZZI,
J.P. MEERSCHMAN, A. POLLICINI, K.H. SCHRADER
(Materials Division)
J. BITEA U (Essor Division)
A. CRICCHIO, L. KOCH
(Transuraniun1 Institute, Karlsruhe)
1972
Joint Nuclear Research Centre Ispra Establishment - Italy
and
Joint Nuclear Research Centre
ABSTRACT
Under the joint EURATOM-ENEL research program for the development of water reactor technology, post-irradiation analyses were carried out on three fuel assemblies irradiated at 8,000 to 14,000 MWd/t (U) in the TRINO VERCELLESE pressurized water reactor.
Visual and photographic examinations of selected fuel rods and metallography of fuel and canning materials showed a very good irradiation behaviour of the fuel elements.
The main objective of the program was the determination of burnup and isotopic composition of selected fuel samples in order to evaluate the accuracy of the calculation methods developed by FIAT NUCLEARE. Radioactive fission products have been measured by gamma spectro-metry. The fission product Nd-148 and the uranium and plutonium nuclides have been determined by mass spectrometry combined with isotopic dilution techniques.
The experimental data obtained for burn-up and for the concentra-tions of uranium and plutonium nuclides have been compared with theoretical predictions obtained by means of computer codes.
KEYWORDS
SELNI REACTOR
FUEL ELEMENT CLUSTERS IRRADIATION
PHOTOGRAFIC FILM DOSEMETERS PHOTOGRAFIC FILMS
METALLOGRAPHY FUEL CANS
BURNUP
ISOTOPE RATIO FISSION PRODUCTS GAMMA SPECTROSCOPY PLUTONIUM
GAMMA FUEL SCANNING URANIUM
ALPHA SPECTROSCOPY MECHANICAL DECLADDING COMPUTER CALCULATIONS NEODYMIUM 148
1 •
2.
3.
4.
5.
3
-TABLE OF CONTENTS
INTRODUCTION. 9
FUEL CHARACTERISTICS AND SELECTION OF FUEL SAMPLES. 11
2.1. Description of the reactor core and the fuel assemblies. 11
2.2. Irradiation history. 12
2.3. Selection of fuel assemblies, rods and samples.
DISMANTLING OF FUEL ASSEMBLIES AND VISUAL EXAMINATION OF
THE FUEL RODS.
METALLOGRAPHY OF FUEL AND SHEATH MATERIALS.
DETERMINATION OF BURNUP AND ISOTOPIC COMPOSITION.
5. 1 • Experimental analysis.
5.1.1. Non destructive gamma spectrometry.
5.1.1.1. Gamma scanning equipment.
16
18
22
24
24
25
26
5.1 .1.2. Gross gamma scanning. 26
5.1.1.3. Measurement of fission product concentrations2s
s.1.2.
5.1.3.
5.1.4.
5.1.5.
Destructive gamma spectrometry.
Radiochemical processes.
Mass spectrometry.
Alpha spectrometry.
5.2. Processing of the experimental data and theoretical
predictions.
5.2.1. Processing of the experimental data.
5.2.2. Theoretical predictions.
34
40
44
49
53
53
Table 1
Table 2
Table 3
Table 4
Table 5
Table 6
Table 7
Table 8
Table 9
Table 10
Table 11
Table 12
Table 13
Table 14
Table 15
Table 16
5
-LIST OF TABLES
Core thermo-hydraulic characteristics.
Core mechanical data.
Summary of cycle 1 operation.
Selected fuel samples.
Gamma ray intensities.
Calibration of gamma scanning measurements.
Precision of estimated fission products concentrations
using the calibrations of Table 6.
Nuclear data of the radioactive fission products.
Specific activity of the fuel samples at the
reactor shutdown.
Errors in the determination of the specific activity
of the fuel samples.
Comparison between Cs-137 determinations at Karlsruhe
and Ispra.
Isotopic atom ratio of uranium and plutonium.
Plutonium/uranium and Nd-148/uranium mass ratios.
Comparison of the results for uranium and plutonium
isotopic atom ratios obtained at Karlsruhe and
Ispra laboratories.
Americium isotopic atom ratios.
Table 17
Table 18
Table 19
Table 20
Table 21
Table 22
Table 23
Table 24
Table 25
Table 26
Table 27
Table 28
6
-Percent of activity for alpha emitting nuclides
of plutonium, americium and cerium.
Techniques used for the burnup determination from
experimental data.
Burnup values, MWd/t(U), obtained by different
experimental techniques. Comparison between results
obtained at Ispra and Karlsruhe.
Burnup values, MWd/t(U), obtained by different
experimental techniques.
Comparison between burnup values, MWd/t(U),
determined by means of Cs-137 and Nd-148.
Results of the regression analysis.
Errors of the regression estimate.
Comparison between experimental (average) and
theoretical burnup values.
Comparison between experimental (Cs-137) and
theoretical burnup values.
Rod average burnup. Comparison between experimental
and theoretical values.
Comparison between experimental and theoretical
values of U-235 depletion and U-236 production.
Comparison between experimental and theoretical
FIG. 1
FIG. 2
FIG. 3
FIG. 4
FIG. 5 to 9
FIG. 10
FIG. 11
FIG. 12
FIG. 13
FIG. 14
FIG. 15 FIG. 16 FIG. 17 FIG. 18
FIG. 19 to 26
7
-LIST OF FIGURES
S.E. quarter core showing location of assemblies
dismantled and of rods examined.
Load diagram and cumulative burnup.
Fuel assembly showing positions of grids and
axial locations of samples examined.
Arrangement of the equipment in the pool.
Photographs of rods showing surface defects.
Cross section of the cladding showing a defect
produced by fretting corrosion.
Cross section of the cladding in the position
of a deposit spot shown in Fig.
7.
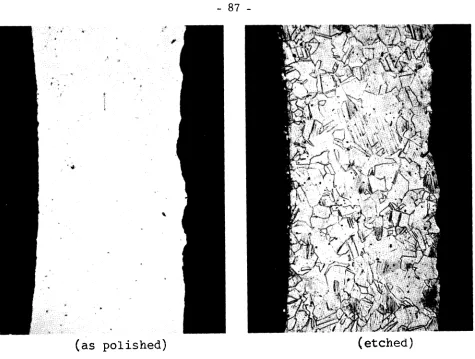
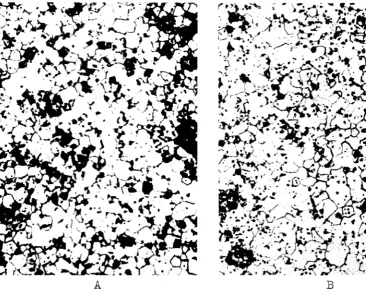
Cross section of the fuel rod No.8 (low burnup).
Microstructure of the fuel.
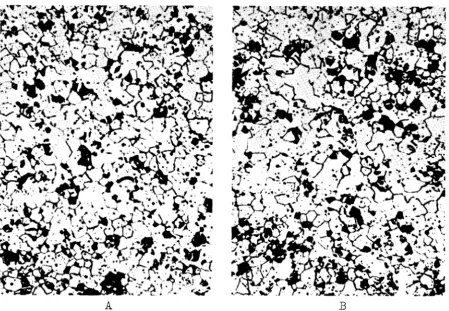
Cross section
of
the fuel rod No.4 (high burnup).Microstructure of the fuel.
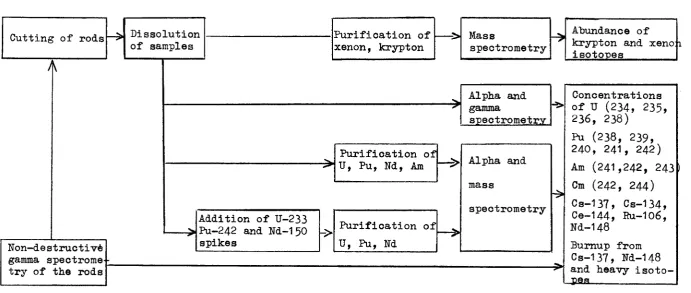
Flow diagram of the post-irradiation analyses.
Gamma scanning equipment.
Typical gamma activity distribution, part of
rod No.1.
FIG. 27
FIG. 28
FIG. 29
FIG. 30
FIG. 31
FIG. 32 FIG. 33
FIG. 34
FIG. 35
FIG. 36
FIG. 37
FIG. 38
8
-Gamma spectrum of fission products from a
fuel rod.
Gamma spectrum of fission products from a
dissolved fuel sample.
Correlation between burnup and U-235/U-238.
Correlation between U-235/U-238 and Pu-240/
Pu-239.
Correlation between uranium depletion and
Kr-84/Kr-83.
Correlation between Pu/u and Xe-131/Xe-134.
Correlation between Pu/u and Cs-137, Ce-144,
Ru-106 specific activities.
Correlation between Pu/U and Cs-134/Cs-137
activity ratio.
Correlation between burnup and Cs-134/Cs-137
activity ratio.
Isotopic production and depletion vs. burnup
for the inner core region.
Isotopic production and depletion vs. burnup
for the intermediate core region.
Isotopic production and depletion vs. burnup
9
-1. INTRODUCTION.
In the framework of the EURATOM-ENEL research contract
No. 071-66-6 TEEI-RD, post-irradiation analyses on the spent
fuel of the Trino Vercellese reactor core one were performed
at the Ispra and Karlsruhe Establishments of the EURATOM Joint
Research Center.
The main objective of the post-irradiation examination
program was the measurement of the burnup and the isotopic
composition of selected fuel samples in order to evaluate the
accuracy of the calculation methods developed by FIAT NUCLEARE
in the framework of the EURATOM-FIAT research contract No.
098-66-6 TEEI-RD.
The other objective of the program was the metallographic
analysis of the
uo
2 fuel and of the stainless steel cladding.
The fuel assemblies selected for the analyses were
dis-mantled at Ispra, in the pool of the ESSOR reactor. The removed
fuel rods were subjected to visual examination. Gamma-scanning
measurements were then made on the fuel rods in order to determine
the axial distribution of the radioactive fission products, and,
consequently of the burnup.
Fuel and cladding samples were cut from the rods in selected
positions for radiochemical and metallographic analyses.
The fuel samples for the radiochemical analyses were
dissolved and aliquots of the solutions were subjected to
radio-chemical processes and to gamma, mass and alpha spectrometry
determinations.
Gamma spectrometry was used mainly to determine the Cs-137
activity, from which the burn-up was derived; mass spectrometry,
combined in some cases with isotope dilution techniques, was used
to determine the concentrations and isotopic compositions of the
heavy isotopes uranium, plutonium and americium, of Nd-148 and of
the krypton and xenon fission gases; alpha spectrometry was used
to determine the activities of some nuclides of plutonium,
10
-The concentrations of the heavy isotopes and Nd-148 were then
utilised for separate evaluations of the burnup.
The experimental values of burnup and uranium and plutonium
isotopic contents were extensively compared with the theoretical
11
-2. FUEL CHARACTERISTICS AND SELECTION OF FUEL SAMPLES.
2.1. Description of the reactor core and the fuel assemblies.
The Trino Vercellese Nuclear Power Plant, operated by Ente
Nazionale per l'Energia Elettrica (ENEL), is equipped with a
pressurized water reactor rated at 825 MW(th). Westinghouse
Electric Corp. is the designer and manufacturer of the nuclear
steam generating plant, fuel included.
The reactor was first brought to criticality on June 21, 1964.
During the first cycle of power operation (October 23, 1964
-April 28, 1967) the fuel reached an average burnup level of 11,590
MWd/t(U).
The reactor core for cycle 1 was composed of 120 square fuel
assemblies, divided into three radial zones of 40 assemblies each
(initial enrichments 2.72, 3.13, 3.90%) and 52 cruciform assemblies
(initial enrichment 2.72%)~ Of the 52 cruciform assemblies 28 are
connected as "fuel bearing followers" to 28 cruciform control rods
(absorbing material Ag - In - Cd). A cross section showing a
quarter of the core is shown in Fig. 1.
Ten control rods act as a control group slightly inserted in the
core during power operation; the remaining 18 rods act as
shut-down rods and are fully withdrawn at power. The total initial
weight of
u
in the core is 39.9 metric tons. The core is operated with chemical shim (boric acid dissolved in the coolant).The core thermo-hydraulic characteristics are presented in
Table 1.
A square fuel assembly consists of a 15 x 15 array of fuel
rods. Portions of the peripheral rows of fuel rods are omitted to
provide slots for the passage of the control rod blades. The
central rod is also omitted to provide space for an in-core
instrumentation thimble. The number of fuel rods for assembly
is therefore 208. The fuel rods are kept in place by ten spacer
grids welded to the perforated steel can which surrounds the fuel
12
-Table 1 Core thermo-hydraulic characteristics.
Power output
Coolant pressure
Coolant effective flow rate
Coolant inlet temperature
Coolant average temperature
Coolant outlet temperature
Core average power density
Max. design linear power density
Max. rod surface temperature
825 MW(th)
140 kg/cm2
16,000 t/h
266.5°c
282°C
297.5°c
64.4 kW/1(21kW/kgU)
12.4 kW/ft
340°c
The cruciform fuel assemblies, of which 24 are permanently
inserted in the core and 28 are attached to the 28 control rods,
contain 26 fuel rods each. The control rods contain 32 absorber
rods containing Ag, In, Cd in the ratio 80: 15 : 5. The cladding
material for the fuel and the absorber is stainless steel.
The main data relative to the fuel assembly and the control
rod are presented in Table 2.
2.2. Irradiation history.
The post-irradiation analyses were performed on fuel
irradiated during the first cycle of reactor operation (Oct. 23, 64
-Apr. 28, 67). Core average burnup at the end of the cycle was
11,590 MWd/t(U).
During the cycle two extended shut downs took place: the first
.fbr installation of a second TG unit, which allowed a power
increase from 615 to 825 MW(th) and the second for maintenance
and inspection of the TG unit No. 1. As a result the cycle may
13
-Table 2 Core mechanical data.(*)
CORE
Equivalent diameter
Active height
249.9 cm
264.9 cm
Number of square fuel assemblies 120
Number of cruciform fuel assemblies 52
Number of regions 3
Initial enrichments (square assemblies) 2.72-3.13-3.90%
Initial enrichment (cruciform assemblies) 2.72%
Number of control rods 28
uo
2 in square fuel assemblies 42,321 kguo
2 in cruciform fuel assemblies 2,313 kgTotal
uo
2 weight 44,634 kgTotal U weight 39,873 kg
SQUARE FUEL ASSEMBLY
Rod array
Number of fuel rods
Side of square cross section
Total length
uo
2 weight
FUEL PELLET
uo
2 densityDiameter
Length
Dishing depth
Number of pellets per rod (approx.)
Length of pellet stack in fuel rod
Clad-pellet clearance
(*)
Nominal data, cold condition15 X 15
208
20.00 cm
320.88 cm
353.81 kg
96.5
%
T.D.0.890 cm
1.53 cm
0.33 mm
173
264.1 cm
0.114 mm
Table 2
FUEL CLAD
Inside diameter
Wall thickness
Material
CRUCIFORM FUEL ASSEMBLY
Number of fuel rods
Fuel length
Rod outer diameter
uo
2 weight
CONTROL ROD
Absorbing material
Cladding material
Number of absorber rods
Absorber length
Absorber rod diameter
Clad outer diameter
Clad thickness
14
-(continuation)
0.902 cm
0.383
mm
SS AISI 304
26
240.3 cm
1 .092 cm
44.00 kg
5% Cd-15% In-80% Ag
Type 304 SS
32
269.2 cm
1 .001 cm
1.095 cm
15
-Table 3 Summary of cyle 1 operation.
Period I
I I I I I
Date 23.10.64-5.6.65 31.8.65-20.5.66 11.7.66-28.4.67
Max.power level 615 825
825 (MWth)
Coolant
(oc) avg.temp. 282 278 278
Control group 30% 4%
4%
insertion
Approx. boron 1300 + 1050
concentration 1150 + 650 650 + 0
(ppm)
Core burnup 2260 4085
5245 (MWd/t (U) )
At the end of the cycle (with practically no boron in the
coolant) a stretch-out operation was performed in two steps :
first, rods were completely withdrawn and the full power level
was maintained for 11 days by letting the average coolant
temperature drop from 278°C to 274°C; 'finally the TG unit No.1
was shut down and the reactor power level was cut down to
300 MW(th) allowing two more weeks of operation.
16
-2.3. Selection of fuel assemblies, rods and samples.
At the end of the first cycle, in addition to the 40 assemblies
of the inner core region (enrichment 2.719 w/o), some assemblies
of the intermediate and outer region (enrichment 3.130 and 3.897%)
were also discharged from the reactor for reprocessing. Thus
assemblies of the three enrichments were available for
post-irradiation examinations. Therefore three fuel assemblies were
selected, one for each initial enrichment.
The criteria for selection of assemblies, rods and samples
have been the following:
- wide range of initial enrichment (2.719 + 3.897 w/o)
- wide range of burnup values (8000 + 14000 MWd/t(U) for the
average of whole assemblies; 3000 + 18000 MWd/t(ti-) for the
single samples).
- different assembly location within the core (center,
inter-mediate, periphery; near and away from control rods, etc.)
- different rod location within the assemblies (corner rods,
rods near the central water hole provided for in-core
instrumentation thimble, rods from normal positions)
corresponding to different neutron spectra (perturbed and
asymptotic)
- different axial location of samples along the rods in
order to obtain axial profiles of burn-up and isotopic
composition and to investigate the effect of the axial
temperature gradient.
The core map showing assemblies and rods selected is given
in Fig. 1.
The identification of sampling positions along the height
17
-A total of 8 rods and 21 samples were selected. The rods and samples selected for examination are summarized in Table 4.
Table "4 Selected fuel samples.
Assembly Average Initial Rod Axial
Location burnup Enrichment Number Locations Comments
(MWd/t (U)) (w/o) (see Fig .1) (see Fig. 3)
1 1-4-9 Asymptotic
spectrum
G-7 12380 2.719 2 1-4-7-9 Intermediate
spectrum (near water hole)
3 1-7-9 Perturbed
spec-trum(corner rod)
4 1-4-7-9 Asymptotic
spectrum
H-10 14170 3.130 5 4-7-9 Intermediate spectrum (near water hole)
6 7 Perturbed
spec-trum(corner rod)
L-7 8660 3.897 7 7 Asymptotic
spectrum
8 1-7 Perturbed
"' 1 8
-3. DISMANTLING OF THE FUEL ASSEMBLIES AND VISUAL EXAMINATION
OF THE FUEL RODS.
The dismantling of the fuel assemblies and the recuperation
of the selected fuel rods have been done in the water pool of
the ESSOR reactor. The operation was performed by means of a
special device designed by ENEL
['"1J
and installed inthese-cond tank of the pool (see Fig. 4 ). It consists of a tubular
welded frame levelled on the bottom of the tank by four
adjust-able and stadjust-able feet. This frame supports a tilting basket
containing the fuel assembly during cutting operations and
allow-ing the basket to rotate after the fuel rod extraction, and a
cutting device composed of a miller tool actuated by a pneumatic
motor. The tilting basket is a long, square cross-section box,
with flanged ends, on which the upper and lower special covers
were mounted. It keeps the fuel assembly exactly in position
with reference to the frame and hence to the cutting device.
It may, after the cutting of the upper part of the cans, be
substituted by a transportation cover; after rotation it presents
a standard lifting end for manipulation and storage. The
pneuma-tic motor is fixed on a support mounted on a slide movable on
two cylindrical guides in a direction parallel to the face to
be cut. The support can be regulated in a direction
perpendi-cular to the movement of the slide to follow the shape of the
cans with the cutting tool. All of the movements were actuated
by long rods and a tubular spanner from the pool plateform.
A chip suction water-ejector system actuated by a centrifugal
pump with suitable filters to retain the radioactive chip was
installed in the pool; the suction device was fixed on the
19
-Operating procedures.
After the shipping cask containing the fuel assemblies
was opened into the pool, the three fuel assemblies were drawn
out by means of the lifting tool and stored in a storage rack.
Each of the three assemblies was grabbed by the lifting tool
already fitted with the "upper-cover" and transferred into the
tilting basket. The upper cover is shaped as a stirrup in order
to allow the cutting tool to enter from two opposite sides. It
keeps the fuel assembly centered inside the basket to prevent
vibrations during cutting operation.
The cutting device was then slid into position and actuated.
The travel of the miller was manually actuated at a speed of
three revolutions per minute, corresponding to 10 mm/minute.
Once the first face had been cut, the tilting basket with its
covers and the contained assembly was rotated by 180° around
its vertical axis to present the opposite face to the cutting
device. Beforecutting the remaining two faces of the can, it
was necessary to separate the lifting tool and the upper cover
from the tilting basket and the fuel assembly, to rotate it by
90° and to fix it again in the new position. Then the tilting
basket was rotated by 90° to present the third face to the
cutting device. The cutting of the two remaining faces was
performed in the same way as for the others.
After removal of the top end plate, the selected fuel rods
were withdrawn and transported in the storage basket.
After the fuel assembly was closed with the perforated cover,
the basket was closed by a temporary cover and inverted by
rotating it on its trunnions. After removing the lower cover,
the fuel assembly was grappled by means of the standard head,
drawn out of the tilting basket and deposited directly in the
- 20 ..
Visual and photographic examination of the fuel rods.
Following their removal from the fuel element itself and
their storage in the storage basket, the fuel rods were
trans-ferred in a specially designed transfer basket from the pool
to the main examination cell of the ADECO.
Each rod was fixed on a support, which could slide in front of
the lead windows of the cell. It was examined visually very
care-fully by means of a high magnification monocular periscope, a
questar telescope and a special binocular. Then pictures were·
taken by means of a SINAR camera equipped with a 500 mm focal
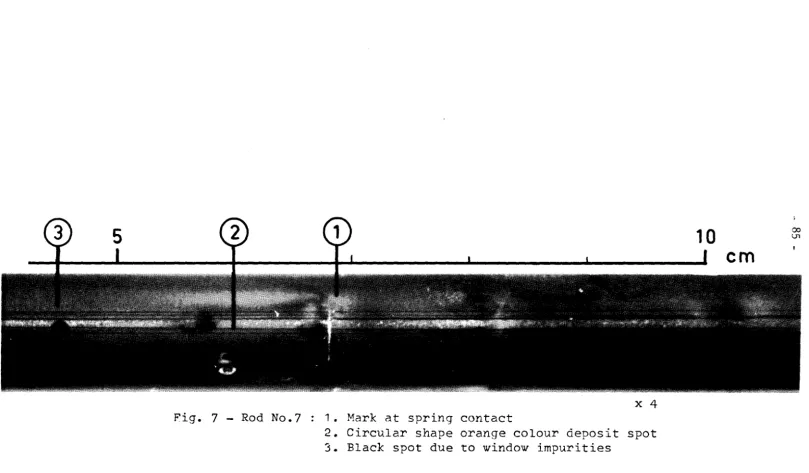
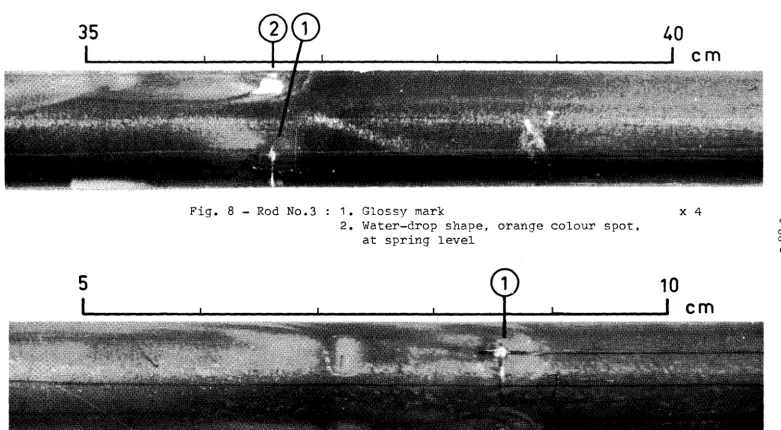
length lens. Four types of marks could be observed on the
stain-less steel fuel cans, which are illustrated by the following
pictures
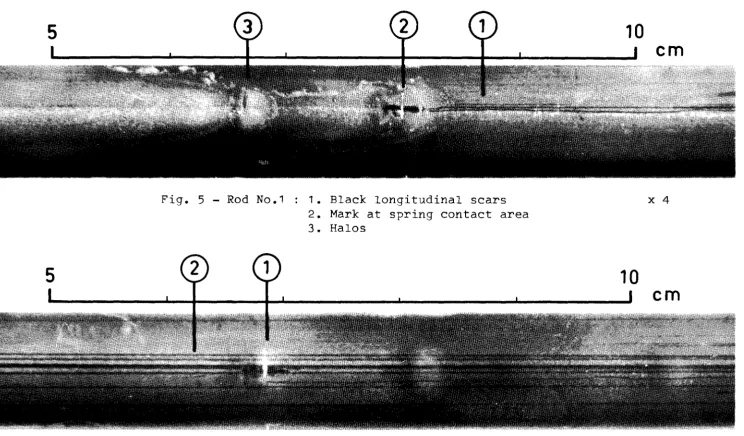
a) Halos localized at the level where the flow regime of the
coolant is modified by the springs of the grids (Fig. 5).
These halos are brown coloured and lengthened with the
coolant flow.
b) Black longitudinal scars which correspond to the spring
positions (Fig. 6). These marks seem to have been produced
by the spring during the assembly of the element and then
filled by black deposits during the time in the reactor
core.
c) Orange deposit spots. Fig. 7 shows an example of such a
spot located between two grid levels. It has an almost
perfectly circular shape: there is no attack of the clad
in this position as the micrograph made at this point
shows (Fig. 11).
d) Bright circumferential scars and points of fretting corrosion
at the contact of the spring with the can. These defects are
illustrated in Fig. 8 and 9. The micrograph of a cross section
at the position (1) of Fig. 5 and 6 shows an attack of the
21
-In conclusion, the visual and optical examination of the
fuel rod? showed only a few small defects on the cans.
After examination, the fuel rods were cut in three parts
23
-in the microstructure, which could be attributed to
tempera-ture or irradiation. This confirmed the result of temperatempera-ture
calculations on the fuel, which predicted a maximum temperature
of about 1500°c. For this temperature no change of the
24
-5. DETERMINATION OF BURNUP AND ISOTOPIC COMPOSITION.
5.1. Experimental analysis.
The selection of rods and pellets to be subjected to
expe-rimental determination of fission products and heavy isotopes ...
has been presented in Section 2.
The program of analyses can be broadly divided into
non-destructive measurements for the determination of radioactive
fission products and destructive measurements for the
determi-nation of fission products and heavy isotopes.
Eight rods have been measured by means of non-destructive
gamma spectrometry techniques in the laboratories of the Joint
Research Center at Ispra.
In the selected positions, the eight fuel rods were cut and
samples 10 mm thick were prepared for destructive analyses.
The cutting positions were determined with an uncertainty 0£
+ 3 mm. The fuel samples were dissolved with nitric acid in
hot cells. Small aliquots of the fuel solutions, which can be
handled without heavy shielding, are transferred to
glove-boxes for radiochemical processes.
In the laboratories of the Joint Research Center at Karlsruhe
the fission gases are collected during the fuel sample
disso-lution.
The analyses were performed at Ispra (18 samples) and
Karlsruhe (3 samples+ 5 for cross check).
At Ispra radioactive fissi.::m products have been determined
by means of gamma spectrom,etry; Nd-148 and plutonium and
uranium nuclides have been determined by isotopic dilution
and mass spectrometry. In .addition to these determinations,
at Karlsruhe the isotopic compositions of the Kr and Xe
25
-of mass spectrometry and the concentrations -of some plutonium,
americium and curium isotopes have been determined by alpha
spectrometry.
In the present report, the experimental procedures adopted
at Ispra are presented in detail and only a short description is
given of the experimental procedures adopted at Karlsruhe. These
latter procedures are described in detail in reference
L-2~.
A flow sheet of the experimental determinations is reported
in Fig. 16.
5.1.1. Non destructive gamma spectrometry.
Gamma scanning measurements of fuel rods give information
about the axial distribution of radioactive isotopes in the fuel.
Total gamma activity measurements needing a very simple
experi-mental equipment can be considered as an overall inspection of
the fuel. The activity will be very roughly proportional to the
burn-up of the fuel after a long cooling time. Cracking of the
fuel or sintering between different fuel pellets may be indicated
by the gross gamma scanning.
Using a Ge-Li crystal, the axial distribution of the gamma
activity of single isotopes can be determined. If, during
reactor operation, no significant migration of fission products
occurred, the measured activities should be proportional to the
concentration of the corresponding isotopes. In this case, all
conclusions which can be drawn from a destructive gamma
spectro-metry can also be made from the non-destructive gamma scanning
measurements. In particular, if the burnup of the fuel can be
inferred from Cs-137, the gamma scanning allows a burnup
26
-5.1 e1 .1. Gamma scanning equipment.
The apparatus used consists of a mechanical part installed
inside a hot cell (Fig. 17), a collimator system mounted in the
concrete wall of the cell and the equipment for gamma-ray analysis
which is installed outside the hot cell. An electronic control
unit allows measurements to be run automatically following a
preselected program for the displacement of the fuel rod and
counting time. During counting the rod was rotated, but its
vertical axis was fixed. The collimator had an aperture of 0.5
mm height and 20 mm width.
To analyse the gamma-rays, a NaI crystal and a Ge-Li drifted
detector have been used with a 400 channel analyser.
5.1 .1.2. Gross gamma scanninq.
The maximum length of a fuel rod which could be mounted
on the mechanical scanning system was 130 cm. Therefore, the
fuel rods of 3 m length had to be cut in three parts, which
have been analysed separately.
The distribution of the total gamma activity in the energy
range from 50 KeV to 2500 KeV was measured using the NaI crystal.
These activities were deter'mined in steps of 0.5 mm in an axial
direction. Due to the rotation of the rod, mean values of the
different sections were obtained. Fig. 18 shows a typical
result of the measured activity distribution of a part of a
fuel rod .. One can see a numbeir of equidistant well-pronounced
minima. They are due to the interfaces between two fuel pellets
14.8 mm long. The scattering of the activity between two of
these minima has to be considered as a statistical one. The
less pronounced decrease of activity extended over a rather
large region is due to the presence of structure material in
27
-Results.
In Fig. 19 to 26 the results for the eight fuel rods
examined are shown. The three parts of the rods, measured
separately, are reassembled in the figures, with the exception
of the rod number 3, which has been cut in two parts.
Evidently, the decrease of the activity near the cutting
sections is caused by the experimental arrangement and is not
due to a local decrease of the concentration of fission products.
The points of the rods where gamma spectrometry has been
carried out (1,2,4,7,8,9) (see also Fig. 3), are indicated as
well as the location of fuel samples cut off for the isotopic
analysis by mass spectrometry.
The following conclusions may be drawn from the results
we have obtained (Fig. 19-26) ;
- All the fuel rods show well pronounced minima of
acti-vity due to the interface of different fuel pellets. This
indicates that no metallurgical interaction between different
pellets occurred during irradiation and confirms the
metallo-graphic examination of the fuel.
- All fuel rods show a decrease of activity near the grid
positions (Fig. 19). This corresponds to a real decrease of
the burnup due to the flux depression caused by the
displace-ments of water by the grids.
- The fuel rods from the angular positions (No. 3 and 6)
show flux depressions due to the mechanical structure of the
fuel box (see Fig. 21 and 24).
Fig. 26 shows the influence of the formersof the fuel
element on the burnup distribution of fuel rod number 8,
(peripherical position of the external zone of the core).
The displacement of water by these formers leads to a flux
28
-5.1.1.3. Measurements of fission product concentrations.
Gamma ray intensities of Cs-137, Cs-134 and Ru-106 have
been determined using a Ge-Li crystal. The activity of
Ce-Pr-144 has been measured using a NaI crystal. Fig. 27 shows
a typical gamma spectrum obtained with the Ge-Li crystal.
Measurements of the reproducibility of the areas of the peak
led to a dispersion of 1.5% for the Cs-137, of 2.5% for the
796 rev ray of the Cs-134 and to 3% for the 513 KeV ray of
Ru-106. The gamma scanning measurements have been carried
out over a long period. In this time the crystal changed its
characteristics a little. Therefore, the precision of the areas
measured, may be worse than indicated previously~
Results ..
The experimental results obtained are listed in Table 5.
Activities are expressed in counts per minute. All values are
corrected for decay, the reference time is the end of reactor
operation. All the measurements have been made using the same
geometry with the same counting equipment.
Gross gamma scanning and metallographic examination
indi-cated that there was no significant migration of fission products.
Therefore, the observed activities should be proportional to the
concentration of the corresponding isotopes. On 18 samples these
concentrations have been determined in a destructive test.
A statistical analysis has been carried out, to compare the
values from the gamma scanning measurements with the values
from the destructive tests.
For the four isotopes a regression equation
y = b X + C ( 1 )
Table 5 Gamma ray intensities (counts/min).
Fuel element · G-7 H-10
Fuel rod 1 2 3 4 5 6
Axial Pos.
1 312.3 333.9 331.2 289.0 330.3 368.6
2 469.6 474.8 499.2 479.5 508.0 495.1
4 552.7 566.4 605.8 554.6 627.6 630.1
7 543.8 581.5 620.8 574.6 693.6 636.0
8 533.2 566.9 569.0 565.3 527.8 635.6
9 430.2 410.5 432.8 461.5 472.2 519.6
1 172. 5 172.7 184.4 132 .1 167 .6 207.1
2 352.3 409.3 406.3 356.6 427 502.7
4 486 532.9 541.5 533 593.5 617.1
7 480.6 510 560.5 518 635 665.5
8 434.7 438.6 485.5 486.9 496 592
9 290 257.2 310.5 347.3 337.6 447
1 359.9 431.5 375 323 296.9 388.2
2 579.5 690.8 632 541.8 601.5 725.7
4 723.7 701 820 734 848 864.7
7 718.8 772.3 807.2 774.7 708 918. 5
8 676.5 609 755.4 579.2 625.4 853.8
9 501.3 408.6 531.9 531 .3 490.3 648.2
1 1200 1354 1300 1201 1485 1472
2 1708 1915 1878 1915 2181 2134
4 1920 2015 2093 2105 2323 2401
7 1889 2044 2227 2097.8 2304 2546
8 1820 1955 2126 2032 2220 2458
9 1593 1512 1878 1715 1921 2097
7 227.5 302.6 453.9 479.1 440.5 339.8 78.7 163 276.4 334 284.3 174 138 217. 6 313 300.1 282.3 223.8 1051 1335 1817 1848 1742 1371 L-7 8 140.8 196 .6 259.1 288.5 244.6 202.3
1 8. 3 52.3 75 94 80.3 46 .1 71.8 65.6 183.9 180.1 185.6 162 .6 717 967 1122 1211 1046 953 Cs-137
662 KeV
Cs-134
796 KeV
Ru-Rh-106
513 KeV
Ce-Pr-144 2180 KeV
(NaI-crystal)
N
30
-x is the activity in counts/min from gamma scanning
measurement ;
y is the concentration of the isotopes expressed in
Curies per gram of initial uranium.
Results are given in Table 6.
In addition to the regression equation, the correlation of x
versus y and the standard error of bis indicated. The
equa-tions can be used for the determination of fission product
concentrations. To get information about the precision, the
standard error of the estimated values (given by the equations
of Table 6) for given x values has been calculated. This standard
error depends on the value of x. It is a minimum for the mean
values~ of the 18 values used for the regression analysis.
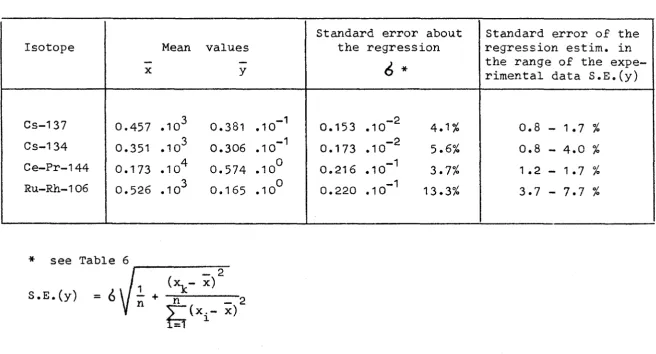
In Table 7 results are listed. One can see that the standard
error in the range of experimental x-values is smaller than
1.7% for Cs-137, 4% for Cs-134, 1.7% for Ce-Pr 144 and 7.7%
for Ru-Rh 106, if one excludes the extremely low values of the
rod number 8.
The results of the destructive and non-destructive
measu-rements of Cs-137 are in good agreement. Therefore, a direct
comparison of the burnup determination with the Cs-137 activity
measurements has been made. Taking the results of the burnup
determination obtained by measuring the heavy elements and the
Nd-148 concentration (Table 20) and the results of gamma scanning
measurements, a regression analysis leads to the following
rela-tionship
where
y
=
27, 7x- 663 (2)x is the activity of Cs-137 in counts/min obtained from gamma scanning, and
Table 6: Calibration of gamma scanning measurements.
Isotope Correlation Regression Equation Standard error of
Coefficient Regression Coefficient S.E.(b)
Cs-137 0.992 y =
o.
865 .10 -4 X -0.109 .10 -2 0.252 .10 -5 (3.0%)Cs-134 0.995 y = 0.889 .10 -4 X -0.641 .10-3 0.213 .10 -5 (2 .. 5%)
Ce-Pr-144 0.990 y
=
0.313 .10 -3 X +0.312 .10 -1 0.109 .10 -4 (3 %)Ru-Rh-106
o.
951 y=
0.294 .10 -3 X +0.106 .10 -1 0.239 .10 -4 (8.1%)x : gamma activity in counts/min
y fission product concentration in Curies/g initial uranium
n - 2 2n - 2
~
(y.- y) -
bI::
(x. - x)· 1 l. · 1 1.
l.= l.=
S.E.(b)
\In
-
2V.L(xi-x)
l.=1
6
with62=
n - 2
x, y : mean values of the experimental observations
Table 7 Precision of estimated fission product concentrations using
the calibration of Table 6.
Isotope
Cs-137
Cs-134
Ce-Pr-144
Ru-Rh-106
*
see TableS. E. (y)
= 6
Mean values
-
X-
y0.457 .10 3 0.381 .10-1
0.351 .1
o
3 0.306 .10 0.173 .10 4 0.574 .100.526 .10 3 0.165 .10
1 - +
n
( ~ - x) - 2
n
~ ( x . - x)2
t;;;- J.
-1
0
0
Standard error about Standard error of the the regression regression estim. in
6
*
the range of the expe-rimental data S.E.(y)0.153 .10 -2 4.1 %
o.s -
1.7 %0.173 .10 -2 5.6%
o.s -
4.0 %o.
216 .10 -1 3.7% 1.2 - 1.7 % 0.220 .10 -1 13.3% 3.7 - 7.7 %w
[image:32.875.85.741.268.622.2]33
-The standard deviation of the regression coefficient is
0.623 or 2.3%. The correlation coefficient is 0.988. In the
interval of the measured Cs-137 acti"I.Zi:ties the calibration
line gives the burnup values with a standard deviation between
0.7 and 2.0% for a fixed value of x (if one excludes the
extreme low values of the rod number 8). That means that,
in the case of the Trino Vercellese fuel elements, the
measu-rement of Cs activity by non-destructive gamma scanning gives
quite a good method for the burnup determination. The
discuss-ion of the burnup values has been dealt with in the chapter
5.3.2.
In Table 25 the experimental results obtained are
compared with theoretical calculated values.
It may be mentioned that the linear relationship
y
=
8.51 X - 2722 (3)has been found between the Ce-144 activity (counts/min) and
the burnup in MWd/t(U). The standard deviation of the
regression coefficient is 2.8%, the correlation coefficient
34
-5.1.2. Destructive gamma spectrometry.
The aim of these measurements is the evaluation of the
burnup level by determining the specific activities of
radio-active fission products in the fuel solutions. For this purpose,
known aliquots of the diluted fuel solution were subjected to
gamma spectrometry, with Ge(Li) and NaI(Tl) detectors connected
through a preamplifier and an amplifier to a multichannel
analy-ser. Two Ge(Li) detectors
.
.
1 ) Ge(Li) coaxial type 20 cm3 FWHM "-3. 5 KeV at 1.33 MeV
2) Ge(Li) coaxial type 20 cm 3 FWHM o,,i2 KeV at 1.33 MeV
and one 3" x 3" NaI(Tl) detector were utilized for the
measure-ments. Fig. 28 shows a gamma spectrum of fission products in
the energy range 100-900 KeV obtained with the Ge(Li) detector
No. 2. The isotopes and gamma lines selected for the
measure-ments are reported in Table 8.
Table 8: Nuclear data of the radioactive fission products.
ISOTOPE ENERGY (KeV) HALF-LIFE
Ce-144 134 and 2186 284 d
Ru-106 512 367 d
Cs-137 662 30.5 y
Cs-134 796 + 802 2.05 y
In the case of the isotope Ce-144, at the beginning of the
measurements both the gamma photopeaks at 134 KeV -measured with
Ge(Li) and at 2186 KeV- measured with NaI(Tl)
detector-were evaluated. The two independent measurements detector-were in a very
good agreement and so it was decided to evaluate only the gamma
line at 134 KeV.
In the case of the isotope Cs-134 the gamma line at 605 KeV
was not considered, in order to avoid interference from the
35
-This interference was evaluated to be between about 7% (for
low burnup level) and 3% (for high burnup level) at the date
of measurements (June 1970).
For the determination of the burnup level, only the
results of Cs-137 were utilized. The results of the
measure-ments on the fission products Cs-134, Ce-144, Ru-106 were
uti-lized for studies of isotope correlations in irradiated fuels
which are of interest both for problems of fissile material
management and for problems of nuclear safeguards. Some of the
most interesting correlations obtained during the
post-irradia-tion analyses are presented in Secpost-irradia-tion 5.3.
Another possibility of the utilisation of the data on the
fission products, is as a check of the accuracy of the neutron
code calculations of the different types of fissions. In fact,
the fission yields of Ce-144 and Ru-106 differ for fissions of
U-235, U-238 and Pu-239. This check, which would require an
additional processing of the neutron code output data, will
possibly be made in the future within the framework of studies
for nuclear safeguards.
Experimental.
For each fuel cross section solution, three weighed samples
were taken and each sample was counted two or three times.
The spectra obtained with the multichannel analyser were
stored on a punched tape and elaborated by an IBM 360/65
computer with a computer code that gives the net area of the
gamma photopeaks. The absolute activity of the selected
isotopes was determined by comparison with reference sources
of known activity and a similar geometry, supplied by the
Radiochemical Center, Amersham.
The resulting counting rate (dis/sec) was corrected for
36
-The uranium concentration in the solution was determined by
isotopic dilution and mass spectrometry (see sections 5.1.3
and 5.1.4). In this way it was possible to calculate the
specific activity of the selected isotopes expressed as
dis/sec. g final uranium.
Results of the measurements and evaluation of the errors.
The specific activities of the fuel samples expressed as Ci/g
final uranium at the reactor shutdo~m for the four selected
isotopes are reported in Table 9. We notice that, for the
calculation of the burnup values, it is necessary to correct
for the small amount of uranium burnt during the irradiation.
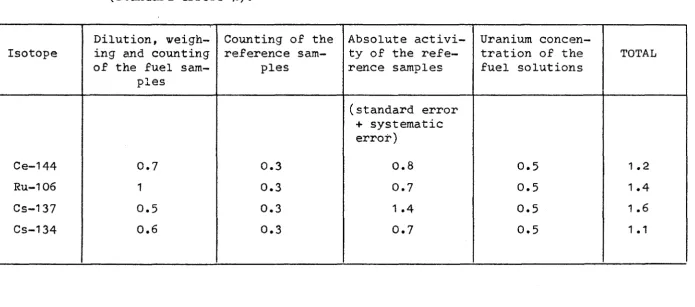
An evaluation of the errors made in the determination of
the specific activity of the four selected isotopes is
report-ed in Table 10. In the last column the square root of the sum
of each squared coefficient is reported.
Eight fuel cross-sections, five of which were adjacent
to those analysed at Ispra, were analysed at the Karlsruhe
Research Center. In these laboratoriEis only the activity of
the fission product Cs-137 was determined using the techniques
described in Ref'erence
(_-2J.
At Karlsruhe the uranium concen-tration in the fuel solution was determined by weighing thefuel sample and the fuel solution, so that the resulting data
are the specific activities of Cs-137 expressed as Ci/g
initial uranium.
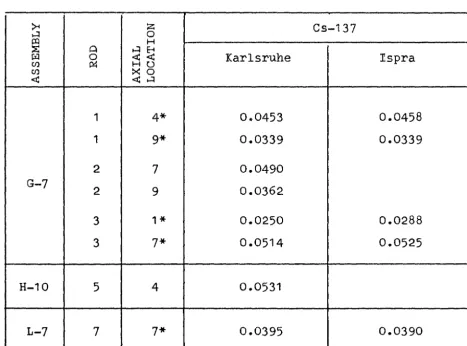
All of the results obtained at Karlsruhe and the data
obtained at Ispra for the five adjacent fuel cross-sections
are reported in Table 11. The agreement between the data of
the two laboratories is satisfactory with the exception of
the samples G-7-3-1. For these samples a disagreement in the
same sense was also observed for the measurements on uranium
37
-deviation does not derive from experimental errors, but from
a real difference in the burnup of the two pellets. We wish
to point out that all of the data reported in Table 9 and 11
are not corrected for the in-core decay.
Table 9
>-i H
IX!
~ Q
rxl 0
CJ) Pc:: CJ)
<t:
1 1 1
G-7 2
2 3 3 3 4 4 4
H-10 4
5 5 6
7
L-7 8
8
Specific activity of the fuel samples at the reactor
shutdown (Ci/g final uranium).
z
0 Ce-144 Ru-106 Cs-137 Cs-134
H
HE-4 <t: <t:
HO
:>< 0
<t! H
1 0.429 0.104 0.0256 0.0137
4 0.669 0.222 0.0468 0.0427
9 0.531 0.149 0.0345 0.0231
1 0.456 0.112 0.0273 0.0158
4 o.689 0.237 0.0486 0.0459
1 0.485 0.122 0.0292 0.0165
7 0.738 0.266 0.0537 0.0517
9 0.610 0.177 0.0392 0.0287
1 0.438 0.0843 0.0243 0.0123
4 0.734 0.217 0.0507 0.0477
7 0.719 0.232 0.0514 0.0505
9 0.567 0.158 0.0370 0.0276
7 0.787 0.246 0.0568 0.0569
9 0.642 0.172 0.0403 0.0305
7 0.829 0.250 0.0590 0.0609
7 0.589 0.143 0.0397 0.0278
1 0.238 0.0295 0.0120 0.00221
Table 10
Isotope
Ce-144
Ru-106
Cs-137
Cs-134
Errors in the determination of the specific activity of the fuel samples.
(standard errors%).
Dilution, weigh- Counting of the Absolute activi- Uranium
concen-ing and countconcen-ing reference sam- ty of the refe- tration of the TOTAL
of the fuel sam- ples rence samples fuel solutions
ples
(standard error
+ systematic error)
0.7 0.3
o.8
o.s
1 • 21 0.3 0.7 0.5 1.4
0.5 0.3 1 .4 0.5 1.6
0.6 0.3 0.7 0.5 1 .1
w
[image:38.871.42.737.274.581.2]Table 11
>-i H
~ ~ µJ
Cl) Cl)
<X!
G-7
H-10
L-7
39
-Comparison between Cs-137 determinations at rarlsruhe
and Ispra. Specific activity of the fuel samples at
the reactor shutdown (Ci/g initial uranium).
z
Cs-1370
H
0 H 8
0 <X! <X! Karlsruhe !spra
P4 H C)
>< 0
<X! H
1 4* 0.0453 0.0458
1 9* 0.0339 0.0339
2 7 0.0490
2 9 0.0362
3 1* 0.0250 0.0288
3 7* 0.0514 0.0525
5 4 0.0531
7
7*
0.0395 0.0390 [image:39.710.54.522.205.551.2]- 40 ,
5.1.3. Radiochemical processes.
The main purpose of the radiochemical processes was to
obtain from the original fuel solution after an isotopic
dilu-tion step, a purified soludilu-tion of uranium, or plutonium or
neodymium, in a suitable condition to be analysed by mass
spectrometry.
At Ispra, uranium and plutonium were individually
puri-fied from interfering materials by means of solvent extraction
techniques. At Karlsruhe, an ion-exchange technique was
utili-sed to reduce the ratio between uranium and plutonium and to
purify both the elements in the same step.
Radiochemical processes have also been utilized at
Karlsruhe for the purification of americium and fission gases
to be measured by mass spectrometry.
A detailed description is only given for the radiochemical
procedures utilized at Ispra. A description of the procedures
utilized at Karlsruhe can be found in Reference
L-2:}.
Uranium purification procedure.
Known aliquots of the diluted sample solution (about 10/ug
of uranium) and of the spike solution (about 5/ug of U-233)
were mixed and evaporated to dryness in order to allow the
conditioning of the solution to 1 M nitric acid.
After addition of 1 M nitric acid, the plutonium was
reduced to the trivalent state by hydroxylamine hydrochloride
and stabilized by ferrous sulphamate. The pH of the solution
was then adjusted by dropwise addition of ammonium hydroxide,
to the yellow form of metacresol-purple indicator corresponding
- 41 ...
After addition of aluminium nitrate, the solution (6.5 ml)
was extracted (1 min) with 1.5 ml of 10% tributylphosphate (TBP)
in iso-octane. The aqueous phase containing plutonium and fission
products was discarded and the uranium was stripped (3 min) from
the organic phase by 1 ml of an aqueous solution 0.9 Nin
sul-phuric acid and 0.1 Nin nitric acid.
After centrifugation the aqueous phase containing uranium was
carefully separated from the TBP-phase and evaporated to
dry-ness; 1 M nitric acid solution was then added to the residue
in order to have a total uraniwn concentration of about 150)1g/g,
suitable for mass spectrometry analyses.
For each dissolved fuel cross-section, three U-233 spiked
and three unspiked samples was purified for subsequent mass
spectrometry analyses.
Plutonium purification procedure.
Known aliquots of the diluted sample solution (about 1/1g
of plutonium) and of the spike solution (about 0.25
yg
of Pu-242)were mixed with concentrated nitric acid and carefully evaporated to dryness in order to insure the depolymerization of Pu and to
allow the conditioning of the solution to 0.5 M nitric acid.
After addition of 0.5 M nitric acid, the plutonium was
reduced to the trivalent state by hydroxylamine hydrochloride
at 80°C for 10 min. and then oxidized to the tetravalent state
by sodium nitrite. This redox treatment was made in order to
have all the Pu in an extractable form and to promote its
iso-topic exchange.
After adjustment to 1 M nitric acid, the solution was
extracted (10 min) with an equal volume of 0.5 M
thenoyltri-fluoroacetone ( TTA) in xylene. The aqueous pha:3e containing
uranium and fission products was discarded and the organic
42
-volume of 1 M nitric acid in order to remove uranium traces.
After separation from the aqueous phase, the plutonium was
then stripped (5 min) from the organic phase with an equal
volume of 8 M nitric acid.
After centrifugation the main part of the 8 M nitric
acid containing plutonium was removed very carefully from
the T.T.A.-phase.
In order to eliminate eventual traces of organic
solvent which interfere with mass spectrometry measurements,
the aqueous phase containing plutonium was evaporated twice
to dryness after addition of small aliquots of concentrated
perchloric acid. The 11!:Sidue was dissolved in 1 M nitric acid
in order to have a total plutonium concentration of about
15 )1g/g of solution, suitable for mass spectrometric analyses.
As in the case of uranium, for each dissolved fuel
cross-section three Pu-242 spiked and three unspiked samples were
purified for subsequent mass spectrometric analyses.
Neodymium purification procedure.
Known aliquots of the sample solution (1-2)1g of Nd-148,
about 7 Min nitric acid) and of the spike solution (about 1
)1g
of Nd-150) were mixed with 40% HF in order to have a 6 M nitric and 6 M hydrofluoric acid solution.The solution was loaded onto anhydrous manganese dioxide
(AMD) column, 0.7 cm internal diameter and 3 cm long, in order
to separate the rare earths from the main part of the most
important gamma-ray emitters. The flow rate was 1 ml/minute.
Uranium, plutonium and fission products (except the rare
earths) were eluted with 6 M HF, and the rare earths
43
-Another important gamma~emitter is Ce-144.
To separate Ce-144 from other rare earths, the nitric acid
solution from the previous step was percolated through a
DOWEX 1x8 (100 - 200 mesh) resin column containing lead
dioxide (Pb0
2) mixed with the resin. The size and flow rate were the same as mentioned for the AMD column.
Cerium, oxidized to the tetravalent state, remained fixed on
the resin together with Pu traces during the subsequent
washing step with 8 M HN0 3•
The solution containing rare earths and transplutonium
elements was evaporated to dryness and the residue dissolved
in 0.05 M hydrochloric acid (0.5 ml). Selective separation of
neodymium from its neighbouring rare earths and Am-241, was
carried out utilizing the method described by L. Koch and
coworkers
L-3~.
The 0.05 M HCl solution was percolated through a DOWEX 50x8 (200 - 400 mesh) resin column (0.3 cm internaldiameter and 6.5 cm long) with a flow rate of 0.013 ml/min.
The column was then washed with 0.05 M HCl (0.2 ml) and water
(0.15 ml). Rare earths were then eluted with 0.05 M
alpha-hydroxy-isobutirric acid (7 ml) at pH= 4.6 and collected in
0.5 ml fractions.
In order to identify the fractions containing only
neodymium isotopes, an additional sample spiked with Nd-147
was purified at the same time together with the unknown
samples. The 530 KeV gamma photopeak of Nd-147 and
scintilla-tion gamma ray spectrometry were utilized to locate, in the
sequence of collected fractions, the position of the fractions
containing only Nd-147; in a similar way it was possible to
identify, and subsequently to combine, the corresponding
unknown fractions containing only neodymium isotopes.
After adjustment to 1.5 M HN0
3, the combined neodymium fractions were adsorbed on a DOWEX 50x8 (200 - 400 mesh)
resin column (0.55 cm internal diameter, 3 cm long) with a
44
-(4 ml), the neodymium was eluted with 6 M HN0
3 (3 ml). The neodymium solution was then ev~porated to dryness
and the residue redissolved in 1 M HN0
3 in order to have a suitable solution for M.S. analyses (20-40/ug Nq/g). A total
of seven samples were purified for each dissolved cross
section; three unspiked, three Nd-150 spiked plus one Nd-147
spiked.
5.1.4. Mass spectrometry.
At the Ispra laboratory, mass spectrometric measurements
have been performed on uranium, plutonium and neodymium. The
mass spectrometric measurements were carried out on instruments
(Varian Mat type CH4 and AEI MS-503) equipped with
thermal-ionization double filament sources for most of the experiments.
Only a part of neodymium determinations were performed with ion
sources in a single filament arrangement. The mass spectra were
obtained by the scanning of the analyzing magnet current.
For all of the fuel samples, three spiked and three
unspi-ked, independently purified solutions hare been prepareq.. In
general, the third solution of each group was analyzed only in
case of a poor agreement in the results; for each fuel sample
a minimum of two mass spectrometric runs for the different
types of solutions were carried out. Finally for each run the
number of soans of the isotopes group was at least equal to
ten.
Corrections have been introduced for mass discrimination
effects as determined by isotopic standards of the National
Bureau of Standards (USA).
The ratios of the minor isotopes to the most abundant one
(e.g. U-234, U-235, U-236 to U-238 and Pu-240, Pu-241, Pu-242
to Pu-239) determined at the Ispra and Karlsruhe Research
Table 12 Isotopic atom ratio of uranium and plutonium.
MEASURED VALUES
ASSEM- ROD AXIAL
BLY LOCAT. 235/238 RSD 236/238 RSD 234/238 RSD 240/239 RSD
1 0.02068 0.5 0.00170 1.0 0.000136 1.0 0.1421 o.6 4 0.01597 0.5 0.00256 1. 8 0.000152 1.5 0.2218 0.6 4I 0.01573 1 .1 0.00254 4.6 0.22295 0.2 9 0.01844 0.4 0.00221 1.0 0.000163 2.6 0.1758 0.4
9K 0.01823 0.2 0.00214 o.8 0.1786 0.4
1 0.01945 0.7 0.00186 1.5 0.000144 3.0 0.1546 0.8 2 4 0.01466 0.5 0.00263 2.0 0.000139 3.0 0.2423 0.9
G-7 7I 0.01463 1.0 0.00270 1.4 0.2417 0.3
9I 0.01748 0.5 0.00224 2.6 0.1931 0.4
1 0.01938 0.3 0.001847 0.4 0.000148 1.5 0.1646 0.4
1K 0.02015 0.7 0.001810 2.2 0.1512 0.3 3 7 0.01409 0.45 0.00281 0.7 0.000173 1.5 0.2592 0.4 7K 0.01428 0.7 0.00281 1 .6 0.2555 0.3 9 0.01698 0.3 0.00233 0.8 0.000139 1.0 0.2020 o.6
1 0.02451 0.4 0.00171 2.5 0.000223 3.5 0.1265 0.7 4 4 0.01831 0.6 0.00299 2.0 0.000246 3.0 0. 211 5 0.4 7 0.01760 o.6 0.00289 1 .5 0.000150 3.0 0.2163 0.7 9 0.02129 0.6 0.00263 1.5 0.1747 0.4 H-10
4K 0.01773 0.4 0.00315 0.7 0.2332 1.0 5 7 0.0173 o.6 0.00320 2.0 0.000160 3.0 0.2372 0.5 9 0.0202 0.6 0.00255 1. 5 0.000180 3.0 0.1867 0.5
6 7 0.01593 0.6 0.00328 2.0 0.000125 3.0 0.2600 0.6 7 7 0.02811 0.45 0.00288 0.8 0.1555 0.8
7K 0.02858 0.5 0.00292 1 • 1 0.1563 0.3 L-7
8 1 0.0370 0.5 0.00124 2.0 0.000230 3.0 0.0630 o.6 7 0.0327 o.6 0.00204 2.0 0.000210 3.0 0.1154 0.4
K = KARLSRUHE LABORATORY
241/239 RSD
0.0466 1.0 0.0975 0.8 0.10064 0.4 0.0666 0.8 0.0686 0.3
0.0522 1 • 1 0.1064 1 .1 0.1067 0.5 0.0740 0.7
0.0578 o.65 0.0478 0.4 0.1166 1.2 0.1153 0.4 0.0805 1.5
0.0405 0.9 0.0962 0.9 0.0974 o.8 0.0690 0.9
0.1079 0.4 0.1094 o.8 0.0760 1.2
0.1157 1 • 2 0.0627 1.0 0.0629 0.5 0.0080 1.2 0.0265 0.8
46
-standard deviations.
The concentrations of uranium and plutonium nuclides have
been determined by means of the isotopic dilution techniques,
utilizing as spiking isotopes, U-233 and Pu-242. The spike
so-lutions were calibrated against standards of the National
Bureau of Standards with a relative error in the concentration
values between 0.3 and 0.5%, which includes also the
uncertain-ties due to the isotope dilution procedures.
The concentration of Nd-148, the chosen burnup indicator,
was determined again by the isotopic dilution technique with
Nd-150 as a spike. A correction has been introduced.fur the
contamination due to natural neodymium on the basis of the
determination of Nd-142.
The presence of Ce-142 and Sm-150 has been verified and
suitable corrections have been introduced by taking into
account the peaks at masses 140 due to cerium, 149 and 152
due to samarium. The spike solution of Nd-150 has been
cali-brated against a standard of natural neodymium supplied by
the Central Bureau of Nuclear Measurements of Euratom in Geel.
The error in the calibration, inclusive of the uncertainties
due to the isotope dilution procedures, was between 0.6 and
0.8%.
The plutonium/uranium and Nd-148/uranium ratios are
reported in Table 13, together with the relative percentual
differences for the pairs of adjacent pellets analyzed at
Ispra and Karlsruhe laboratories. The u and Pu isotopic ratios for these adjacent pellets and the relative percentual
diffe-rences between the two laboratories are reported in Table 14.
The agreement between the two groups of data is satisfactory
with the exception of the sample G 7-3-1. This deviation may
be due to the severe power and temperature gradients, because
47
-Table 13 Plutonium/Uranium and Nd-148/Uranium mass ratios.
I
-3Pu U X 10 Nd-148/U X 10-4
SAMPLE
ISPRA KARLSRUHE /j °/o ISPRA KARLSRUHE
Ll
%!
I
I
G-7-1-1 4.362
I
G-7-1-4 6.895 6.857 0.6 1 • 619 1 • 657 2.3
I
G-7-1-9 5.179 5.316 2.6 1 .160
G-7-2-1 4.437 0.992
I
I
G-7-2-4 6.698 1. 688
I
I
II
G-7-2-7 6. 921 I 1.737 I
I
G-7-2-9 5.479 1 .268
G-7-3-1 4.412 4.183 5.2 1 • 012 0.889 I 1 2 .1
I
G-7-3-7 6.913 7.016 1.4 1.774
G-7-3-9 5.464 1.374
H-10-4-1 4.131 0.824
H-10-4-4 7 .1 51 1.760
H-10-4-7 7.157 1 • 821
H-10-4-9 5.638 1 • 315
H-10-5-4 7.234 1.896
H-10-5-7 7.355 1.998
H-10-5-9 5.735 1 • 411
H-10-6-7 7.168 2.063
L-7-7-7 5 .601 5.657 1
.o
1 • 361 1.390 2 .1L-7-8-1 1.577 0.390