http://www.scirp.org/journal/ajibm ISSN Online: 2164-5175 ISSN Print: 2164-5167
A Study of the Influencing Factors of the Export
Trade of Beijing’s Cultural Creativity Industry
Jishun Niu
Business School, Beijing Institute of Fashion Technology, Beijing, China
Abstract
Based on existing research results and the gravity model, the present paper constructs a gravity model of the export trade of Beijing’s cultural creative products and services. This paper also analyzes the main influencing factors of the export trade of Beijing’s cultural creativity using the gravity model.
Keywords
Export Trade, Gravity Model, Cultural Creativity Industry, Gravity Model
1. Introduction
The gravity model is a theoretical hypothesis introduced by Tingderben and Poyhonen, who applied Newton’s law of universal gravitation to explain the in-teraction between international trade flow and the related influencing factors [1]. The gravity model shows that the trade flow between two countries is af-fected by the size of their economy and geographic distance. Usually, the GDP will produce positive effects on trade flow, whereas geographic distance will cause negative effects. In international trade, the gravity model is often used to study the effects of influencing factors on international trade, such as the size of economy, geographic distance, and cultural background. The basic equation of the gravity model is presented as follows:
(
)
1 2
ij i j ij
X = ⋅α β GDPGDP β D (1-1)
ij
X represents the trade flow between country i and country j; GDPi and
j
GDP represent the economic level of country i and country j; Dij represents
the geographical distance between country i and country j; α is a proportio-nality constant. In the latest theory of international trade, many scholars have added other influencing factors, such as per capita GDP and cultural distance, to the gravity model. Thus, the equation can be optimized as follows:
How to cite this paper: Niu, J.S. (2017) A Study of the Influencing Factors of the Export Trade of Beijing’s Cultural Creativ-ity Industry. American Journal of Industrial and Business Management, 7, 69-77. http://dx.doi.org/10.4236/ajibm.2017.71006
Received: March 28, 2016 Accepted: January 21, 2017 Published: January 24, 2017
Copyright © 2017 by author and Scientific Research Publishing Inc. This work is licensed under the Creative Commons Attribution International License (CC BY 4.0).
http://creativecommons.org/licenses/by/4.0/
1 2 3 4
lnXij = ⋅α β lnGDPi+β lnGDPj+β lnDij+β lnTij+µij (2)
Gravity model is an important tool to analyze international trade. Some spe-cial factors, particularly cultural factors, are considered. Therefore, some Chi-nese scholars have used the gravity model to analyze cultural trade. Chen Xiaoqing and Zhan Zhengmao conducted empirical analysis on the influencing factors of the American cultural trade under the theory of gravity model [2]; Qu Xiaoli and Han Lili analyzed the influencing factors of the Chinese cultural trade using the gravity model [3]. The gravity model is one of the best methods to analyze the influences of cultural factors on international trade.
This paper constructs a gravity model for the export trade of Beijing’s Cultural Creativity Industry. Then it analyzes the choices of variables, including inde-pendent variables and deinde-pendent variable, and influence of various factors on Beijing’s Cultural Creativity Industry.
2. Construction of the Gravity Model
Based on economic level and geographic distance, four other factors, namely, per capita GDP, cultural distance, resident’s education, and language differences are considered. Thus, Tij in Formula (1 - 2) is set as PGDPi (per capita GDP in region i), PGDPj (per capita GDP in region j), Culij (cultural distance),
i
Edu (resident’s education in region i), lnEduj (resident’s education in region
j), Lanj (language differences), and some other factors.
Export party Beijing is denoted by i, and j represents its trade partner. Thus, the gravity model used in this paper is presented as:
1 2 3 4
5 6 7 8 9
ln ln ln ln ln
ln ln ln ln ln
ij i j i j
i j ij ij ij ij
Ex GDP GDP PGDP PGDP
Edu Edu Cul Lan D
α β β β β
β β β β β µ
= × + + +
+ + + + + + (3)
In addition to the four variables, namely, GDP, geographic distance, per capita GDP, and cultural distance, this formula includes two independent variables, namely, resident’s education and language differences because these variables are considered related to the value of the creative products. The export of these products can be promoted by influencing the supply and demand of trade part-ners. The exports of Beijing’s cultural creativity industry to the top ten trade partners (Hong Kong, USA, Japan, Korea, Singapore, England, Germany, the Netherlands, Canada, and Australia) are set as independent variables. GDP, per capita GDP, resident’s education, cultural distance, language differences, and geographic distance are set as dependent variables. The regression of the panel data is studied under the gravity model. Empirical studies are conducted based on the results.
3. Choice of Variables
3.1. Independent Variables
3.3.1. Economic Level
economic level [4]. These needs can be obtained from cultural creative products and services. So the economic level, which is an important variable to measure the purchase capacity in a country or region, is often used in empirical analysis. Usually, per capita GDP is an indicator of the measure of economic level in a country or region. This paper predicts that the economic level of the trade coun-terpart is an important factor that influences the export of China’s cultural crea-tivity industry. They have positive correlation. GDPi indicates Beijing’s GDP, whereas GDPj indicates the importer’s GDP; PGDPi indicates the per capita GDP in Beijing, and PGDPj indicates the importer’s per capita GDP.
3.1.2. Education
The cultural creative products and services that can be exported combine in-tangible multiple cultures with in-tangible forms through unique and creative technology. Generally, consumers of cultural creative products and services need certain cultural knowledge and their cultural literacy is improved with the de-velopment of their education. This finding indicates that consumers with higher education are more likely to accept, understand, and seek for such products and services. This paper predicts that the education of trade importers can promote cultural exchange, and has positive correlation with the export of Beijing’s cul-tural creativity industry. Edui and Eduj represent education in Beijing and j (country or region). The data resource is the proportion of the population that has received higher education to the total population in accordance with the standard of UNESCO.
3.1.3. Cultural Distance
Introduced by Seelmann Eggerbert, culture discount theory holds that the value and acceptance of cultural products are influenced by the differences of cultural background, values, and customs of trading partners [5]. Several methods are used to measure cultural distance. The most popular method is the cultural dis-tance index introduced by Professor Hofstede, a Dutch psychologist. The index measures cultural distance from six different dimensions, which Kogut and Singh used as a basis to propose a formula for calculating cultural distance. In 2005, Lingders applied this formula to the calculation of trade influence.
The formula:
(
)
2 6
1 1 6
hj hi
ij h
h
I I
Cul
V
= −
=
∑
(4)ij
Cul indicates cultural distance between exporter i and importer j; and Ihj
and Ihi indicate the grades calculated from dimension h; Vh is the variance
calculated from dimension h;
(
)
2 hj hih
I I
V
−
presents the differences of these
di-mensions.
cultural creative products and services caused by the differences of trade part-ners. Trade partners that have similar cultural background have better accep-tance of cultural creative products. Thus, this paper preliminarily predicts that cultural distance plays a negative role on the export of cultural creative products. Cultural distance data were obtained from the official website of Hofstede [6]. Beijing’s cultural distance to other countries or regions is presented in Table 1.
3.1.4. Language Differences
Language is the communicative carrier of cultural creative products and services, and directly affects the receivers’ understanding and acknowledgement of prod-ucts and services. Usually, if trade partners use the same or similar language, more resonance can be aroused among the consumers in an import country or region, which can reduce cultural discount. In the cooperation of a local enter-prise with a foreign one, culture plays an effective role on the establishment of trade partnership, the reduction of the trade cost, and the risk of the commercial negotiation. For instance, the cultural creative products and services exported by the USA are widely accepted and loved by people from other countries. There-fore, the United States has become one of the most influential countries in cul-tural creativity industry. English as the official language has made a significant contribution in this process. This paper predicts that a different language will hinder trade increase, and language differences and cultural creativity industry are negatively correlated. Lanij indicates the difference between Beijing and import countries and regions. Suppose the interval of language difference is [0,1], the more similar the languages of the trade partners are, the more closely the difference value tilts to zero or vice versa.
3.1.5. Geographic Distance
[image:4.595.59.540.529.739.2]Geographic distance in the gravity model is in the primitive form. When the gravity model is used to analyze the influencing factors of an industry, it is
Table 1. Beijing’s cultural distance to other countries or regions.
Countries and
regions Power distance Individualism Masculinity Pragmatism Constraint uncertainty Evasion of Cultural distance
Beijing 80 20 66 87 24 30 -
Hong Kong 68 25 57 29 61 17 28.09
USA 40 91 62 26 68 46 45.47
Japan 54 46 95 88 42 92 14.26
South Korea 60 18 39 100 29 85 10.62
Singapore 74 20 48 72 46 85 9.41
Britain 35 89 66 51 69 35 27.8
Germany 35 67 66 83 40 65 19.38
Netherland 38 80 14 67 68 53 54.83
Canada 39 80 52 36 68 48 33.22
indispensable in the analysis of a critical factor, that is, geographic distance. Modern scholars universally agree that the farther the trade parties or regions are, the more transportation cost is required, which will hinder the increase of the trade scale. Usually, geographic distance negatively affects trade flow. Dij indicates the linear distance between Beijing and exporters. Geographic distance and the export scale of the cultural products are negatively correlated. The data were obtained from Google Mapsp [7].
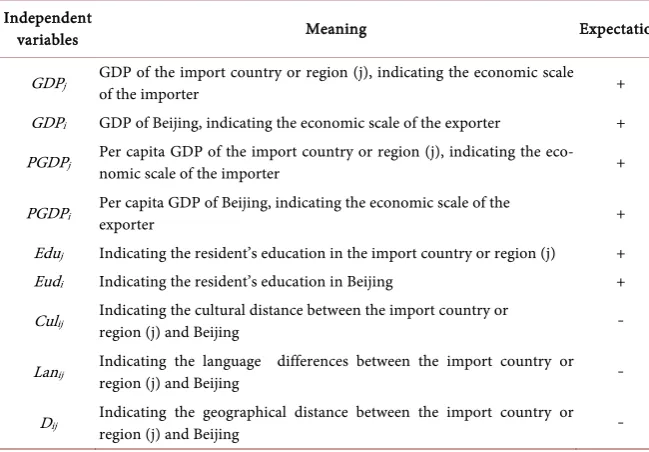
The meanings of the five variables and the expected mode of action that can influence the export of Beijing’s cultural creativity industry
3.2. Dependent Variables
In accordance with Directory for the Export of Cultural Products and Services and the classification standard of Beijing’s cultural creativity industry, this paper sets the export (Exij) of Beijing’s cultural creativity industry as dependent varia-ble.
4. Analysis of Metering Results
4.1. Correlation Analysis of the Variables
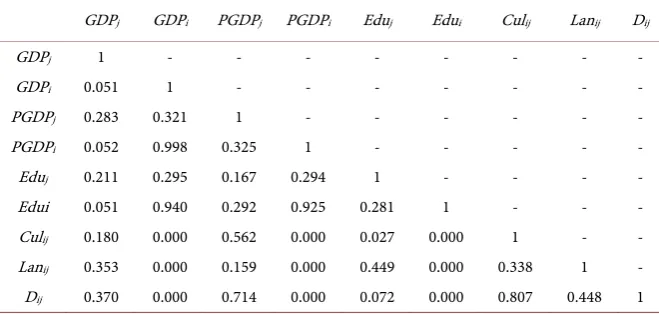
According to the main factors that influence Beijing’s cultural creativity indus-try, this paper concludes that relevant factors interact in different fields of rele-vant products and services. The macro-environment, which includes politics, economy, culture, science and technology, can also interact with countries and regions. To measure and describe the predicted influencing factors presented in the model proposal, this paper uses the analysis method of bivariate correlation to check the correlation among these factors. The results are shown in Table 2.
Results of the correlation analysis of independent variables
[image:5.595.208.538.576.733.2]1) The correlation coefficient of the GDP and the per capita GDP in Beijing is 0.998, which indicates strong positive correlation. The correlation coefficient of the per capita GDP in Beijing and its trade partners is 0.325, which indicates strong positive correlation. The residents’ consumption level of Beijing and its trade partners increases with economic growth.
Table 2. Correlation Analysis of Independent Variables.
GDPj GDPi PGDPj PGDPi Eduj Edui Culij Lanij Dij
GDPj 1 - - - -
GDPi 0.051 1 - - - -
PGDPj 0.283 0.321 1 - - - -
PGDPi 0.052 0.998 0.325 1 - - - - -
Eduj 0.211 0.295 0.167 0.294 1 - - - -
2) The correlation coefficient of the GDP, per capita GDP, and residents’ education in Beijing is 0.940, which indicates strong positive correlation. This result means that economic growth is indispensable in talent cultivation. Eco-nomic development can enrich educational resources, which is beneficial to the increase of talents. Thus, education improvement and economic development in Beijing mutually promote its international competitiveness.
3) The correlation coefficient of cultural distance (Cul) and geologic distance (D) of Beijing and its trade partners is 0.807, which means they have strong pos-itive correlation. This result indicates that the farther Beijing and its trade part-ners are, the more defined their cultural differences become. Trade partpart-ners in different regions will lead to differences in cultural background, customs, and values, which may cause cultural discount.
4) The correlation coefficient of cultural distance (Cul) and language differ-ences (D) of Beijing and its trade partners is 0.807, which means they have strong positive correlation. As a carrier, the information transmitted by language can influence cultural background, customs, and values. Language differences also influence the transmission of Beijing’s culture. Thus, the more different the language used in a country or region is from Chinese, the less similar they are.
5) The correlation coefficient of language differences (D) and geologic dis-tance (D) of Beijing and its trade partners is 0.448, which means they have strong positive correlation. Thus, the more different the language used in a country or region is from Chinese, the less similarity there is.
4.2. Analysis of Regression Results
The panel data of exports and relevant variables from 2006 to 2012 between Bei-jing and ten trade countries or regions in the cultural creativity industry are substituted into the gravity model (1.3) using Stata 12.0. Regression analysis is conducted using the fixed effect model and random effect model to determine whether the random effects of significant judgment are obvious. When P is 0.0000, it indicates that the random effects are quite significant in checking the effect model by Hausman. When P is 0.0747 > 0.05, the original is the random effect model, which cannot deny the random effect. The random effect model is used to conduct valuation to determine the coefficient of the variables through mixed regression. The results are shown in Table 3.
Analysis of Regression Results
1) The Ln(GDPj) coefficient of Beijing’s trade partners is 1.245. When p = 0, it
indicates significant differences. This figure means that if the trade partner’s GDP increases by 1%, the exports of Beijing’s cultural creativity industry will grow by 1.245%, as expected in Table 4. Thus, the economic growth of a country or region will promote its demand on cultural creative products and services, which is good for the export of Beijing’s cultural creativity industry. The Ln(GDPi) of Beijing is 2.151, which is high above the confidence level 1%. This
Table 3. Coefficients of the regression model.
VARIABLES ln(ex)
Mixed Regression Model Fixed Effect Model Random Effect Model
coef. std.Err P coef. std.Err P coef. std.Err P
Ln(GDPj) 1.245 0.04 0.000 0.043 0.185 0.816 0.907 0.123 0.000
Ln(GDPi) 2.151 1.482 0.018 0.853 0.807 0.295 0.217 1.022 0.009
Ln(PGDPj) 2.044 0.435 0.002 −0.566 0.396 0.159 1.248 0.222 0.000
Ln(PGDPi) 0.541 1.862 0.058 0.487 1.093 0.048 0.349 −1.384 0.012
Ln(Eduj) 0.347 0.257 0.036 0.171 0.127 0.184 0.032 0.156 0.005
Ln(Edui) 1.848 1.643 0.290 0.064 0.728 0.931 0.448 0.926 0.628
Ln(Culij) 0.019 0.095 0.047 - - - 1.139 0.272 0.607
Ln(Lanij) −1.906 0.114 0.000 - - - −1.436 0.193 0.000
Ln(Dij) 0.408 0.15 0.024 - - - 0.028 0.206 0.893
_Cons −1.161 2.81 0.058 0.106 2.195 0.014 −1.050 1.665 0.031
Table 4. The Meaning of variables and the expected mode of action.
Independent
variables Meaning Expectation
GDPj GDP of the import country or region (j), indicating the economic scale
of the importer +
GDPi GDP of Beijing, indicating the economic scale of the exporter +
PGDPj Per capita GDP of the import country or region (j), indicating the eco-nomic scale of the importer +
PGDPi Per capita GDP of Beijing, indicating the economic scale of the exporter +
Eduj Indicating the resident’s education in the import country or region (j) + Eudi Indicating the resident’s education in Beijing +
Culij Indicating the cultural distance between the import country or region (j) and Beijing ﹣
Lanij Indicating the language differences between the import country or region (j) and Beijing ﹣
Dij Indicating the geographical distance between the import country or
region (j) and Beijing ﹣
of Ln(GDPj) and Ln(GDPi) shows that when GDP increases by 1% both in
Bei-jing and its trade partners, BeiBei-jing’s cultural creativity industry will acquire more percentage of its total exports.
2) The Ln(PGDPj) coefficient of Beijing’s trade partners is 2.044. P indicates
[image:7.595.207.532.323.549.2]consumption in Beijing does little good to the exports of the cultural creativity industry.
3) The Ln(Eduj) coefficient of Beijing’s trade partners is 0.347. P indicates
sig-nificant differences at the 1% confidence level. This finding means that if the education of Beijing’s trade partners increases by 1%, the exports of Beijing’s cultural creativity industry will grow by 0.347%, as expected in Table 4. This re-sult means that with the development of purchasers’ education, they will prefer the cultural creative products and services of different countries or regions. Cul-tural creative products and services attract consumers from countries or regions that have better education status. Education in Beijing did not pass significance testing, which indicates that the education of Beijing residents does not have a significant influence on Beijing’s cultural creativity industry. The main reasons for this finding are provided below.
The increase of cultural creativity industry depends on trade partners, whereas the critical factor in the improvement of the core products and services is talent. Educational development will increase the number of talents. However, the cul-tivation of creative talents is costly and requires a considerably long period. Moreover, educational development does not necessarily produce creative tal-ents. Additionally, the chosen period (2006 to 2012) is shorter than the normal period of educational development, which is also the reason for the insignificant relationship between educational development and the exports of cultural crea-tivity industry.
4) The Ln(Culij) coefficient of Beijing and its trade partners is 0.019, which
passed the test of significant differences at the 1% confidence level. This result means that cultural distance will bring more opportunities for Beijing’s cultural creativity industry. The result is contrary to expectations in Table 4. People’s curiosity at present is increasingly being inspired. Thus, the cultural products and services of different historical cultures, values, and customs are more likely to attract consumers.
The main cultural creative products and services of Beijing that are exported overseas are visual arts, Chinese art paper, writing brush, instrument, copyright, and films with significant Chinese culture. These products are quite different from its trade partners. Thus far, the dominating export destination is not Asia where cultural distance is small, but the United States and Britain where cultural distance is large. However, the main consideration should be the number of overseas Chinese in these countries and regions. Their cultural background, reli-gious beliefs, and “complex of Chinese culture” can influence their consump-tion. Thus, the export of cultural creativity industry will be less affected by cul-tural discount.
Cultural distance will not bring many obstacles to the export of Beijing’s cul-tural creativity industry. However, if the influence of emigration is not consi-dered, it does not significantly promote the export of Beijing’s cultural creativity industry.
passed the test of significant differences at the 1% confidence level as expected he result is contrary to expectations in Table 4. Language differences can block the export of cultural creative products and services. Trade partners that share the same language can improve the acceptance of products and services in trade partners. Language sharing can also reduce the cost of language transfer, as well as the trade risk caused by linguistic obstacles.
6) The Ln(Lanij) coefficient of Beijing and its trade partners is 0.408, and P
in-dicates significant regression results. This result is contrary to expectation he result is contrary to expectations in Table 4. As for the export of Beijing’s cul-tural creative products and services, most of the trade partners are developed countries from North America and Europe, which have far geologic distance from Beijing. This finding indicates that geologic distance will not reduce the export of Beijing’s cultural creativity industry.
5. Conclusion
Based on the above analysis results, we can safely conclude that economic growth in Beijing can promote the increase of export of Beijing’s cultural crea-tivity industry on the one hand. However, the improvement of residents’ con-sumption and education does not significantly promote the export of Beijing’s cultural creativity industry. On the other hand, trade partners with stronger economic power, higher consumption capacity, and better education are more likely to accept Beijing’s cultural creative products and services. The cultural distance between Beijing and its trade partners does not block the export Bei-jing’s cultural creative products and services. This result indicates that consum-ers in developed countries attach more attention to the cultures in Beijing. They are more willing to accept oriental culture. Notably, language differences be-tween Beijing and its trade partners will hinder the export of Beijing’s cultural creativity industry. Thus, using proper translation to express the cultural marrow is necessary when exporting Beijing’s cultural creative products and services.
References
[1] Wang, W. (2008) Analysis of China and South Korea Cultural Commodity Trade Demonstration. HLJ Foreign Economic Relations & Trade, No. 6, 14-17.
[2] Chen, X.Q. and Zhan, Z.M. (2008) An Empirical Analysis of the Influencing Factors of International Cultural Trade—In the United States 1996-2006 Foreign Cultural Trade Bilateral Data as an Example. Cultural Studies, No. 4, 90-92.
[3] Qu, R.X. and Han, L.L. (2010) An Empirical Study on the Influencing Factors Chi-nese Cultural Commodity Trade. China Soft Science, No. 11, 19-31.
[4] Maslow, A.H. (1943) A Theory of Human Motivation. Psychological Review, No.50, 370-396.
[5] Yan, Y.G. (2008) Cultural Discount and Chinese Foreign Trade and Cultural Prod-uct Strategy. Modern Economic Research, No. 2, 53.
[6] http://geert-hofstede.com/, 2015.
Submit or recommend next manuscript to SCIRP and we will provide best service for you:
Accepting pre-submission inquiries through Email, Facebook, LinkedIn, Twitter, etc. A wide selection of journals (inclusive of 9 subjects, more than 200 journals)
Providing 24-hour high-quality service User-friendly online submission system Fair and swift peer-review system
Efficient typesetting and proofreading procedure
Display of the result of downloads and visits, as well as the number of cited articles Maximum dissemination of your research work
Submit your manuscript at: http://papersubmission.scirp.org/