Study on Effect of Angularity on Hydraulic Conductivity of Mixtures of
Materials
Heena Malhotra
1Janmeet Singh
2Himanshu Jaiswal
31,2
Research Scholar
3Executive
1,2
Punjab Engineering College Chandigarh
3DFFCIL
Abstract—The knowledge of hydraulic properties of soils such as hydraulic conductivity is very important in many physical situations such as flow in an aquifer, flow through filters in water purification, sewage treatment plant and flow in packed bed chemical reactors. It is a key parameter in diagnosing the potential for widespread groundwater contamination by pollutants, and is the basis for design of drainage and irrigation systems. The size and shape of soil particles reflect the formation history of the grains. In turn, the macro-scale behaviour of the soil mass results from particle level interactions which are affected by particle shape. Sphericity, Roundness and Smoothness characterize different scales associated to particle shape. Hence, to investigate the effect of Shape factors of sediments on hydraulic conductivity through porous media, the present study has been conducted on Constant Head Permeameter with appurtenances to measure discharge, pore pressure differences and temperature. Four number of materials such as 6.3 mm White Marble chip, 6.3 mm Crushed Quartzite, 10 mm River Washed Gravel, 16 mm Glass Spherical Glass balls and making a mixture of these above mentioned materials in fixed proportion and then conducting Hydraulic Conductivity tests on it. On the basis of experimental results a positive correlation between Permeability (K), Shape factor ƞ (angularity) and Volume Mean diameter (dv) has been developed.
Key words: Hydraulic Conductivity, Grain Size Analysis, Angularity
I. INTRODUCTION
Information about the soil permeability is vital to the success of many geotechnical works. Various predictive equations based on Volumetric and Grain Size parameters have been proposed to estimate the permeability. Permeability is one of the most important yet variable properties in Geotechnical Engineering. Conventionally, permeability is evaluated either by In-situ or laboratory tests. In-situ tests are costly and difficult to interpret because of the complex boundary conditions involved. Laboratory tests also present formidable problems, the most troublesome being obtaining representative samples. To circumvent the testing problems, methods of estimating permeability from volumetric characteristics and grain size have previously been attempted. These predictive equations had limited success for coarser soils, and have proved to be completely unsatisfactory for fine-grained soils. The fundamental problem with these equations is that permeability is extremely sensitive to subtle changes in soil structure, a property which bulk volumetric parameters do not accurately reflect.
II. HYDRAULIC CONDUCTIVITY
Permeability (or hydraulic conductivity) refers to the ease with which water can flow through a soil. Hydraulic conductivity or permeability is the rate at which soil will transmit water under a unit hydraulic gradient. Various factors such as fluid properties, grain-size distribution, void ratio, roughness of mineral particles and degree of soil saturation affect the hydraulic conductivity. Hydraulic conductivity can be estimated by using methods based on grain size analysis or determined by the use of experimental in situ- or laboratory methods. The grain-size methods use coefficients that are estimated from empirical data, as well as some kind of representative value of the grain size. The experimental methods measure the flow in a soil material and calculate the hydraulic conductivity or transmissivity from the flow in different ways.
A key aspect of hydraulic conductivity is that a very wide range of values exist in natural soils and rocks, perhaps a range from 10-2 m/s (for very open gravels and cobbles) to 10-11 m/s (fissured clays or massive un-fractured rock). This is a huge range – a factor of a billion! This is a much greater range than would be expected for most other geotechnical parameters such as shear strength or compressibility. It is also important to realise that the way that a fluid (such as water) passes through a soil or rock mass depends not only on the properties of the soil/rock but also on the properties of the permeating fluid. This means that a given soil or rock will behave differently if it is permeated by different fluids – for example water or hydrocarbons (oil). The problem with the term ‘permeability’, widely used in geotechnical engineering, is that in other industries (such as the oil and gas industry) it is taken to mean the ‘intrinsic permeability’ which is independent of the permeating fluid-Intrinsic permeability has the SI units of m2, although it is commonly described in Darcy’s (where 1 Darcy = 1 x 10-12 m2) – and is a significantly different parameter to hydraulic conductivity.
III. EXPERIMENTAL WORK
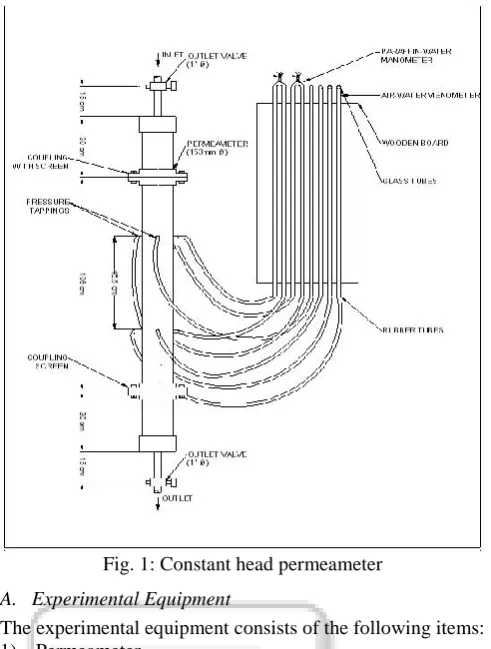
Fig. 1: Constant head permeameter
A. Experimental Equipment
The experimental equipment consists of the following items: 1) Permeameter
2) Discharge measuring device 3) Weighing Balance
4) Pycnometer 5) Manometer 6) Thermometer 7) Source of supply 8) Oven
1) Permeameter
The constant head vertical flow type permeameter was used for hydraulic tests in this work. The main permeameter section consisted of a 10.16 cm internal diameter GI tube with a total length of 1.06 m and a test length of 46.5 cm.
2) Discharge measurement
The discharge was measured by volumetric method. The water was collected in a bucket for a certain period, which was recorded with a stopwatch and collected water was then measured with the help of a 2000 cc capacity glass jar. Volume of water collected at a particular duration will give the discharge.
3) Weighing balance
Electronic weighing balance were used for measuring the weight during specific gravity test
5) Manometer
To cover the desired range of flow, two types of manometer were used:
1) Air-water manometer 2) Paraffin water manometer
6) Thermometer
I.S. Mercury Thermometer measuring temp from 0oC to 80oC was used for measuring the temperature of water.
7) Source of supply
The permeameter receives its water supply from an overhead tank at a height of 2.65 m above the permeameter outlet. The tank receives its supply from a recirculating tank so that a constant head is maintained in the overhead tank.
8) Oven
Oven was used to dry out the soil samples collected from different boreholes before performing the sieve analysis.
B. Materials Used
The various materials used in the present study have been listed below:
1) Marble Chips: 6.3mm uniform sizes were used. 2) Crushed Quartzite: 6.3 mm uniform sizes were used 3) River washed Gravel: 10 mm uniform sizes were used. 4) Spherical Glass balls: 16 mm uniform sizes were used. 5) Mixtures of Marble chips, Crushed Quartzite, River
washed gravel, and Spherical glass balls in fixed proportions were used
IV. EXPERIMENTAL PROCEDURE
The various tests and procedure conducted during the course of this study have been illustrated below .
A. Sieve Analysis Test
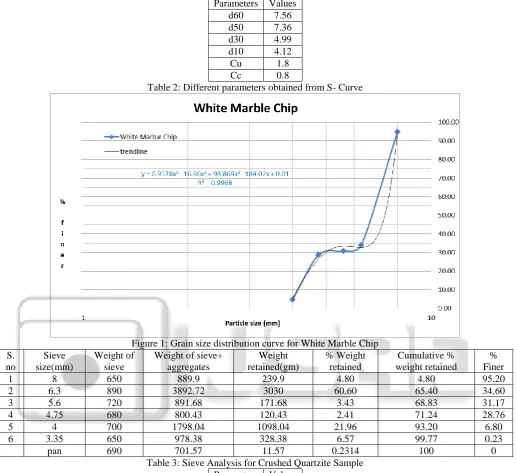
[image:2.595.37.560.658.757.2]Parameters Values
d60 7.56
d50 7.36
d30 4.99
d10 4.12
Cu 1.8
Cc 0.8
[image:3.595.42.559.57.530.2]Table 2: Different parameters obtained from S- Curve
Figure 1: Grain size distribution curve for White Marble Chip S.
no
Sieve size(mm)
Weight of sieve
Weight of sieve+ aggregates
Weight retained(gm)
% Weight retained
Cumulative % weight retained
% Finer
1 8 650 889.9 239.9 4.80 4.80 95.20
2 6.3 890 3892.72 3030 60.60 65.40 34.60
3 5.6 720 891.68 171.68 3.43 68.83 31.17
4 4.75 680 800.43 120.43 2.41 71.24 28.76
5 4 700 1798.04 1098.04 21.96 93.20 6.80
6 3.35 650 978.38 328.38 6.57 99.77 0.23
pan 690 701.57 11.57 0.2314 100 0
Table 3: Sieve Analysis for Crushed Quartzite Sample Parameters Values
d60 7.4
d50 7.11
d30 5.42
d10 3.86
Cu 1.91
Cc 1.03
Figure 2: Grain size distribution curve for Crushed Quartzite S.
no
Sieve size(mm)
Weight of sieve
Weight of sieve+ aggregates
Weight retained(gm)
% Weight retained
Cumulative % weight retained
% Finer
1 12.5 850 980.43 130.43 2.56 2.56 97.44
2 10 810 4248.54 3438.54 67.42 69.98 30.02
3 8 650 1675.87 1025.87 20.12 90.09 9.91
4 6.3 890 970.33 80.33 1.58 91.67 8.33
5 5.6 720 854.87 134.87 2.64 94.31 5.69
6 4.75 680 799.67 230 4.51 98.82 1.18
7 pan 690 749.96 59.96 1.18 100.00 0.00
Table 5: Sieve Analysis for River Washed Gravel Parameters Values
d60 11.48
d50 11.11
d30 10.09
d10 7.67
Cu 1.5
Cc 1.16
B. Angularity Tests
The size of the angular materials used in the present investigation was 0.3 mm minimum to 1.6 cm maximum. The size of the cylinder used was 15.0 cm in diameter and 30.5 cm deep. This size fulfilled the requirement that D/dg~8.0. As Recommended by B.S.0812:1967.(Here D is the diameter of the cylinder and dg is the geometric mean size of the material.)
All tests were performed in accordance with B.S. 812:1967. The aggregates in the cylinder shall then be weighed to the accuracy of one place of decimal after gram using electronic weighing balance.
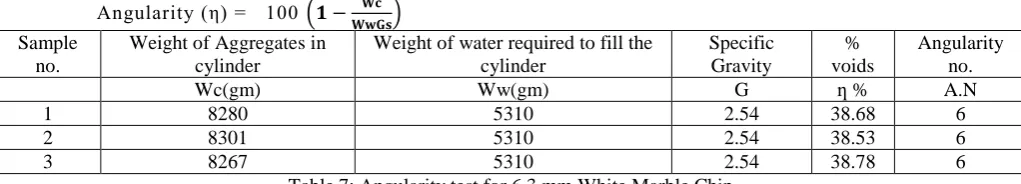
Angularity (η) = 100 (𝟏 − 𝐖𝐜 𝐖𝐰𝐆𝐬)
Angularity number (A.N.) = percentage voids – 33 Or, A.N. = η– 33
where,
Ƞ = porosity or percentage voids when the material is compacted in a standard manner prescribed by B.S. 812:1967
Wc = weight of the aggregate in the cylinder Ww = weight of the water required to fill the cylinder Gs = specific gravity of the aggregates
The % voids&Angularity number obtained for different sizes & different proportion of 6.3mm White Marble chip is tabulated in table 7.
Sample no.
Weight of Aggregates in cylinder
Weight of water required to fill the cylinder
Specific Gravity
% voids
Angularity no.
Wc(gm) Ww(gm) G ƞ % A.N
1 8280 5310 2.54 38.68 6
2 8301 5310 2.54 38.53 6
[image:5.595.42.553.201.293.2]3 8267 5310 2.54 38.78 6
Table 7: Angularity test for 6.3 mm White Marble Chip
C. Hydraulic Tests
The hydraulic tests were conducted to study the effect of resistance to flow of water in a given sample of material. The method of carrying out these tests are as follows.
Preparation of the Bed: Before filling the permeameter with the material to be tested, the inlet portion of the permeameter was taken off. It was proposed in the present study to keep the porosity constant for all runs of the materials. Therefore, the weight of the material needed to fill the permeameter was calculated as:-
𝐖𝐬 = (1-n) 𝐕𝐓𝐆𝐒𝛄𝐰
Where,
𝐖𝐬 is weight of the material ,n is porosity,𝐕𝐓 is volume of
the tube ,𝐆𝐒 is specific gravity of the material ,𝛄𝐰 is
specific weight of the water
TEST RUN: This involved three main operations 1) Measuring the discharge through the permeameter. 2) Reading the pressure drop across the test length of the
material.
3) Reading the temperature of water
In all the runs, observations were taken in receding order of magnitude of discharge and hydraulic gradient. The test was started with maximum discharge so that if there was any settlement of the bed due to the impact of the jet of incoming water, it was secured in the beginning. The bed was then checked at the end of each run for settlement, if any. The porosity of the bed was determined after making due allowances for settlement. The discharge was measured by collecting the water in a bucket for a certain period, which was recorded with a stopwatch. The flow was then reduced for the next observation of the run. This operation was continued till the discharge was decreased from maximum to a certain measurable minimum discharge.
V. ANALYSIS OF RESULT
The present study focuses on investigating and developing a relationship between the Hydraulic conductivity, mean diameter and angularity of the materials used. .
A. Relationship between Angularity and Size of Particles
As already discussed in chapter 2 and chapter 3, the angularity of the particles can be used as a measure of the Shape factor of the particles. The angularity number tests were, therefore, conducted on the various materials.The angularity of any material depends on its size. In order to investigate the relationship between the angularity of any material (defined as the percentage voids in a material when it is compacted in standard manner prescribed by B.S. 812:1967) and its size, the experimental data of angularity number tests were analysed.
From a study of these results, it is seen that the angularity of any material decreases with an increases in the size. These results are plotted using log of angularity (log η) against the corresponding log of geometric mean diameter (log dv) of the material. All the data appear to follow a straight- line law given by:
log ƞ = 𝐧̅ log dv + log C' (1) Eq. (1) can be simplified as:
ƞ = C′ 𝐝𝐯𝐧 (2)
The value of index 𝐧 in this equation was found to be constant at - 2.54547 for all the materials from The value of C varies with the shape of particles. The value of C, for various materials are obtained.
The Eq. (2) can be written as:
C ' = ƞ 𝐝𝐯𝟐.𝟓𝟒 (3)
where,
Fig. 4: Curve of log ƞ v/s log dv
B. Relationship between Permeability and Angularity Granular Material
The results of experimental investigation for white marble chips used can therefore be plotted on log-log graph as Friction factor vs Reynolds number as shown in Fig. 5. . The variation was found to follow a straight line which shows that the flow is in linear regime. These results follow an equation of the form:
Re 1
C
Fr (4)
Or
VdvC
V
gidv 1
2 2
As per Darcy Law,
V =Ki Putting this value ,we get
1 2
2
C
g
dv
K
= C (5)
where,
C1 = constant for given porosity depends only on the shape of particle
C = parameter defining the permeability of the material
Ν = kinematic viscosity of fluid dv = volume mean diameter of particles.
K = coefficient of permeability ( hydraulic conductivity )
Others parameters were same as mentioned earlier. Similarly, factor C in Eq. (5), which defines the permeability of material is also dependent on shape only provided that the porosity and other factors are constant. Therefore, we can write that, C' is a function of C.
Mathematically, this can be expressed as:
C' = F (C) (6) To obtain the required porosity of 40% in each case, it was found necessary to compact the material with a heavy rammer, which could have crushed the material. No attempt was therefore made to compact the material with a heavy rammer to get the proposed porosity. The tests had been conducted at different suitable porosity for each material.
All the points in appear to follow the straight-line law given by:
Log C' = log B + m log C (7) Eq. (6) can be simplified as :
C' = B Cm (8)
The value of B and m in the above equation are obtained. The final equation can be written as:
C'= 54075.43 C3.067 (7) or,
C-3.067 = 𝟓𝟒𝟎𝟕𝟓.𝟒𝟑
𝐂′ (8)
Putting the value of C and C' respectively, the above equation can be expressed as:
[𝐊 𝐝𝐯²]
−𝟑.𝟎𝟔𝟕
= 𝟓𝟒𝟎𝟕𝟓.𝟒𝟑 Ƞ𝐝𝐯𝟐.𝟓𝟒 K = 𝟎.𝟎𝟐𝟖𝟔
Ƞ−𝟎.𝟑𝟐𝟔𝐝𝐯𝟎.𝟐𝟏𝟒 (9) where,
K = coefficient of permeability (cm/s) dv = Volume mean diameter of particles (cm) Ƞ = Angularity of the particles (%)
From the above equation, it is obvious that by conducting Angularity number tests and Volume Mean Ddiameter test & Hyddraulic Conductivity test, an idea about the permeability of a given material can be obtained.
Material: White Marble Chip Size of Material (dv): 0.6875 cm
Weight of Material(Ws) : 13.1kg Temperature of fluid : 25° C
Porosity ( Ƞ) : 38.66% Test Length (L): 46.5 cm
[image:6.595.42.556.385.758.2]Fig. 5: Curve of Friction factor v/s Reynolds number for 6.3 mm Marble chip
VI. CONCLUSIONS
From the discussion related to analysis of results, an important conclusion drawn on the basis of this study refects that Hydraulic resistance decreases as the porosity increase thus increasing the hydraulic conductivity. On the basis of experimental results, the relationship between K, dv and ƞ of the materials are as under:
K = 𝟎.𝟎𝟐𝟖𝟔
Ƞ−𝟎.𝟑𝟐𝟔𝐝𝐯𝟎.𝟐𝟏𝟒
This equation is applicable for the different shape particles at a porosity of 40% and temperature 250 C.The plots of Friction factor and Reynold’s number on log-log scale shows a linear variation at low Reynold’s number and deviates in curvilinear form at higher Reynold’s number, for different materials used. The seepage velocity increases resulting in an increase in Reynold’s number.In the present work a systematic experimental investigation is carried out to explore the relationship between the angularity and the size of particles for a given shape. It is found that the relationship between the angularity and size of particles follows the law:
η = C'dv
ƞ is found to be same for all the shapes studied but C' changes with the shape of the material. Hence, it is concluded that C' depends upon the shape of the particle. It is seen that the angularity of any material decreases with increase in its size.
REFERENCES
[1] Alyamani., M. S. & Sen., Z ,1993 ,Determination of hydraulic conductivity from complete grain size distribuition curves, Ground Water, 31(4), pp. 551-555. [2] Bakhmeteff, B. A. & Feodoroff, N. V.,1937, Flow
through granular media'. Journal of Applied Mechanics, Vol. 4(A).
[3] Carman, P. C. ,1937, Fluid Flow through Granular Beds.In: Trans.Inst.Chem. Eng.. s.l.:s.n., pp. 15,150. [4] Carman, P. C. ,1956, Flow of Gases through Porous
Media, London: Butterworths Scientific Publications. [5] Freeze, R. A. & Cherry, J. A. ,1979,Groundwater,
Englewood Cliffs, New Jersey: Prentice Hall Inc.. [6] Hazen, A. , 1892,Some Physical Properties of Sands
and Gravels, with Special Reference to their Use in
Filtration 24th Annual Report, Massachusetts State Board of Health,Pub.Doc. No.34, pp. 539-556.
[7] Kay , J.M .,1957, An introduction to fluid mechanics and heat transfer' , Cambridge university press , New York , p 241
[8] Kozeny, J., 1927 , Uber Kapillare Leitung Des Wassers
in Boden. Sitzungsber Akad. Wiss.Wien
Math.Naturwiss.Kl. (In German), Volume 2, pp. 136,271-306.
[9] Leva, M. et al.,1957 ,Fluid flow through packed and fluidised systems, U.S. Bureau of Mines, Volume 504, p. 149.
[10]Scheidegger A E.,1957 , Physics of flow through porous media , University of Toronto Press , p 91 [11]Taylor D.W ., 1948 ,Fundamentals of soil mechanics ,
John wiley and sons , Inc, NewYork , p111
[12]Terzaghi, K. & Peck, R. B., 1964,Soil Mechanics in Engineering Practice, New York: Wiley.
[13]Todd, D. K. & Mays, L. W., 2005, Groundwater Hydrology ,New York: John Wiley & Sons.
[14]Uma, K. O., Egboka, B. C. & Onuoha, K. M., 1989,New statistical grain-size method for evaluating the hydraulic conductivity of sandy aquifers , Journal of Hydrology, Volume 108, pp. 343-366.
[15]Wadell, H., 1933,Sphericity and roundness of rock Particles, Journal of Geology, 41(3), pp. 310-331. [16]Wadell, H., 1934, Shape determination of large