Hydrol. Earth Syst. Sci., 17, 1589–1606, 2013 www.hydrol-earth-syst-sci.net/17/1589/2013/ doi:10.5194/hess-17-1589-2013
© Author(s) 2013. CC Attribution 3.0 License.
EGU Journal Logos (RGB)
Advances in
Geosciences
Open Access
Natural Hazards
and Earth System
Sciences
Open AccessAnnales
Geophysicae
Open AccessNonlinear Processes
in Geophysics
Open AccessAtmospheric
Chemistry
and Physics
Open AccessAtmospheric
Chemistry
and Physics
Open Access DiscussionsAtmospheric
Measurement
Techniques
Open AccessAtmospheric
Measurement
Techniques
Open Access DiscussionsBiogeosciences
Open Access Open Access
Biogeosciences
Discussions
Climate
of the Past
Open Access Open Access
Climate
of the Past
Discussions
Earth System
Dynamics
Open Access Open Access
Earth System
Dynamics
DiscussionsGeoscientific
Instrumentation
Methods and
Data Systems
Open Access
Geoscientific
Instrumentation
Methods and
Data Systems
Open Access DiscussionsGeoscientific
Model Development
Open Access Open Access
Geoscientific
Model Development
DiscussionsHydrology and
Earth System
Sciences
Open AccessHydrology and
Earth System
Sciences
Open Access DiscussionsOcean Science
Open Access Open Access
Ocean Science
Discussions
Solid Earth
Open Access Open Access
Solid Earth
Discussions
The Cryosphere
Open Access Open Access
The Cryosphere
DiscussionsNatural Hazards
and Earth System
Sciences
Open Access
Discussions
McMaster Mesonet soil moisture dataset: description and
spatio-temporal variability analysis
K. C. Kornelsen1and P. Coulibaly1,2
1School of Geography and Earth Science, McMaster University, Hamilton, Canada 2Department of Civil Engineering, McMaster University, Hamilton, Canada
Correspondence to: P. Coulibaly ([email protected])
Received: 16 November 2012 – Published in Hydrol. Earth Syst. Sci. Discuss.: 19 December 2012 Revised: 20 March 2013 – Accepted: 3 April 2013 – Published: 29 April 2013
Abstract. This paper introduces and describes the hourly,
high-resolution soil moisture dataset continuously recorded by the McMaster Mesonet located in the Hamilton-Halton Watershed in Southern Ontario, Canada. The McMaster Mesonet consists of a network of time domain reflectome-ter (TDR) probes collecting hourly soil moisture data at six depths between 10 cm and 100 cm at nine locations per site, spread across four sites in the 1250 km2watershed. The sites for the soil moisture arrays are designed to further improve understanding of soil moisture dynamics in a seasonal cli-mate and to capture soil moisture transitions in areas that have different topography, soil and land cover. The McMas-ter Mesonet soil moisture constitutes a unique database in Canada because of its high spatio-temporal resolution. In or-der to provide some insight into the dominant processes at the McMaster Mesonet sites, a spatio-temporal and temporal stability analysis were conducted to identify spatio-temporal patterns in the data and to suggest some physical interpre-tation of soil moisture variability. It was found that the sea-sonal climate of the Great Lakes Basin causes a transition in soil moisture patterns at seasonal timescales. During win-ter and early spring months, and at the meadow sites, soil moisture distribution is governed by topographic redistribu-tion, whereas following efflorescence in the spring and sum-mer, soil moisture spatial distribution at the forested site was also controlled by vegetation canopy. Analysis of short-term temporal stability revealed that the relative difference be-tween sites was maintained unless there was significant rain-fall (>20 mm) or wet conditions a priori. Following a distur-bance in the spatial soil moisture distribution due to wetting, the relative soil moisture pattern re-emerged in 18 to 24 h. Access to the McMaster Mesonet data can be provided by visiting www.hydrology.mcmaster.ca/mesonet.
1 Introduction
soil moisture distribution. An area that requires further re-search (Vanderlinden et al., 2012).
Bl¨oschl and Sivapalan (1995) discussed the scale of hy-drological observations as being characterized by a scal-ing triplet consistscal-ing of extent, spacscal-ing and support. Ex-tent refers to the areal size represented by the observations, spacing to the distance between observation points and sup-port the area that is represented by each observation. They similarly dissected the spatial (temporal) scale of hydrolog-ical processes into spatial extent (duration), space (time) period and integral scale (correlation length) (Bl¨oschl and Sivapalan, 1995). Over the past decade(s) many soil mois-ture monitoring efforts have been undertaken to character-ize the spatial-temporal distribution of soil moisture and its processes at a particular scale of interest. Intensive short-term monitoring efforts for large areas such as the South-ern Great Plains (SGP) (Familglietti et al., 1999; Mohanty et al., 2000b; Martinez-Fernandez and Ceballos, 2003; Ryu and Famiglietti, 2005, 2006) and Soil Moisture Experiments (SMEX) series (Cosh et al., 2004; Bosch et al., 2006; Choi and Jacobs, 2007; Das et al., 2008) were designed to mon-itor soil moisture at both a large spatial extent with mod-erate spacing for process description, but were limited by a moderate period and short duration. Large-scale monitoring whether of short (SMEX, SGP) or long duration (Ceballos et al., 2005; Albergel et al., 2008; Lebel et al., 2009) for cali-bration/validation of radiometer-scale (∼40 km) soil mois-ture products, use multiple observations of wide spacing to increase the extent of soil moisture observations. While coarse resolution (large spacing/extent) soil moisture is rel-atively abundant and has been shown to enhance hydrologi-cal and atmospheric modelling, the advantage of high reso-lution datasets is increasingly recognized (Wood et al., 2011) and the importance of small-scale heterogeneity has been demonstrated (Merlin et al., 2006; Alavi et al., 2010; Minet et al., 2011). Efforts to characterize soil moisture data at high spatial resolution (hillslope scale) can be described as hav-ing a moderate period (daily) and duration (days-months) (Famiglietti et al., 1998; Mohanty et al., 2000a; Hupet and Vanclooster, 2002) or are sampled at low to moderate pe-riodicity (Grayson and Western, 1998; Wilson et al., 2003; Western et al., 2004; Brocca et al., 2010). To monitor hy-drological processes, soil moisture has also been monitored at very short periods (minutes) for short durations (hours) (Torres et al., 1998). The McMaster Mesonet was designed to provide appropriate soil moisture information needed for process understanding and modelling, and developing soil moisture retrieval and extension algorithms by monitoring soil moisture with both a short (hourly) period and long du-ration (years) at a small extent and spacing.
With respect to spatial soil moisture distribution, some studies have found that soil moisture variability increases in wet conditions (Famiglietti et al., 1998; Vivoni et al., 2008), while others have found variability increases in dry con-ditions (Jacobs et al., 2004; Bosch et al., 2006; Choi and
Jacobs, 2007; Brocca et al., 2010). Analysing the results from many studies Brocca et al. (2007) found that in hu-mid climates, spatial variability is greater when conditions are dry, whereas semi-arid environments have the highest variability in wet conditions. These relationships are also subject to considerations of scale and topography. For ex-ample, scale is important as homogenous rainfall tends to decrease soil moisture variability and heterogeneous rain-fall increases it (Cosh et al., 2004), whereas Famiglietti et al. (1998) found that following a rainstorm upper portions of a hillslope were more variable than lower portions of the hillslope, causing an overall increase in variability when the entire landscape was considered. At smaller extents, precipi-tation is generally homogenous and the redistribution of soil moisture by topography, soil texture and vegetation become important post-precipitation (Wilson et al., 2003; Famiglietti et al., 2008). During wetting, soil moisture variability is dom-inated by the soils’ infiltration capacity and topographic re-distribution (Famiglietti et al., 1998; Western and Bl¨oschl, 1999; Western et al., 2004; Vivoni et al., 2008; Heathman et al., 2009), while under dry conditions variability is main-tained by the soil water holding capacity and concavity of the surface (Famiglietti et al., 1998; Peters-Lidard et al., 2001; Vivoni et al., 2008). Vegetation is also a potentially important predictor of soil moisture distribution that can redistribute soil moisture affording a homogenizing effect (Ivanov et al., 2010) or partially explain soil moisture spatial variability in some landscapes (Hupet and Vanclooster, 2002; Bosch et al., 2006), whereas others have found that the role of vegeta-tion in soil moisture distribuvegeta-tion is only minor (Cosh et al., 2004). Vachaud et al. (1985) noticed that the relative rank of soil moisture at a particular location with respect to similar nearby locations was persistent in time, leading to the as-sertion of temporal stability, or more appropriately rank sta-bility (Chen, 2006). The presence of temporally stable soil moisture patterns has been noted during several soil moisture campaigns (Martinez-Fernandez and Ceballos, 2003; Cosh et al., 2004; Bosch et al., 2006; Vivoni et al., 2008) and has also been found to result from soil, topographic and vegetation in-fluences (Vivoni et al., 2008). However, flat topography and soil moisture redistribution have also been observed to result in poor temporal stability (Mohanty et al., 2000b; Mohanty and Skaggs, 2001). None of those soil moisture dynamics analysis studies were conducted in Canada because of the lack of appropriate soil moisture data. The role of seasonal effects on soil moisture variability and stability in cool and snowy climates remains an open research area. The McMas-ter Mesonet database will help to fill that gap as well.
validation, hydrological data assimilation, and process un-derstanding. The unique aspect of this dataset is the multi-ple soil moisture profiles that are collected at each site for both an hourly period and long duration. This will allow for the characterization of hillslope-scale soil moisture variabil-ity at event, seasonal and inter-annual temporal scales, and will provide insight into the influence of topography, vegeta-tion and atmospheric condivegeta-tions on small-scale soil moisture dynamics. Also, most soil moisture experiments described in the literature are from the USA, Europe and Australia and so, to the best knowledge of the authors, this paper repre-sents the first attempt to describe long-term soil moisture dynamics in Canada and specifically the Great Lakes re-gion. It is expected that the McMaster Mesonet will moni-tor hillslope-scale processes that are representative of those occurring in the southern Great Lakes region of Canada in general and the Hamilton-Halton watershed in particular. Due to the limited spatial extent of the monitoring sites, it is surmised that the dataset is better representative of re-gional temporal trends than rere-gional spatial soil moisture. The main dataset consists of a series of four high-resolution soil moisture arrays collecting hourly distributed soil mois-ture profile information since 2006 with an expected lifes-pan of fifteen years. The soil moisture data is supplemented by six weather stations and nine rain gauges distributed throughout the watershed. This dataset can be made available to the broader research community by visiting the website www.hydrology.mcmaster.ca/mesonet and plans are under-way to include the dataset in the International Soil Moisture Network (Dorigo et al., 2011). This paper would serve as an essential reference for the McMaster Mesonet data users.
2 McMaster mesonet
2.1 Hamilton-Halton Watershed
[image:3.595.308.548.62.245.2]The Hamilton-Halton Watershed (Fig. 1) is part of the Lake Ontario drainage basin in Ontario, Canada, and has approxi-mately 980 km2rural agricultural/forested land and 270 km2 of urbanized/industrial land. The urbanized land in the wa-tershed is concentrated within a band that extends approx-imately 7.5 km from the Lake Ontario shoreline, with the notable exception of the Town of Milton which covers an area of 25 km2, in the northern–central part of the water-shed. The major geographic features include the Lake Iro-quois Plains, which are an ancient glacial extension of the current Lake Ontario shoreline and the Niagara Escarpment. The area surrounding the Niagara Escarpment is primarily mixed deciduous/coniferous woodland, and agriculture dom-inates the remainder of the rural area. The primary crops are maize, soy and grains with some tender fruit crops. The wa-tershed is subdivided into six primary subwawa-tersheds, Six-teen Mile Creek, Bronte Creek, North Shore, Grindstone Creek, Spencer Creek and Red Hill Creek, each with their
Fig. 1. Location map of the Hamilton-Halton Watershed includ-ing subwatersheds and the locations of the soil moisture arrays and hydro-meteorological stations.
own network of tributaries. Sixteen Mile Creek is the north-ernmost subwatershed and covers an area of 357 km2and is predominantly agricultural. The Bronte Creek Watershed en-compasses an area of 304 km2 and has the largest propor-tion of forested area around the Niagara Escarpment. Grind-stone Creek has a catchment area of 99 km2 and is largely rural agricultural with forest and some urban area in the south-east. Both North Shore Creek (44 km2)and Red Hill Creek (93 km2)are predominantly urban areas and have been modified to accommodate urban storm-water management. Spencer Creek encompasses an area of 260 km2and is pre-dominantly rural/agricultural and includes part of the City of Hamilton and forested area around the Niagara Escarpment in the south-eastern portion of the subwatershed. It is im-portant to note that areas reported herein are consistent with what is portrayed in Fig. 1, however, in reality the subwater-sheds as reported also contain small waterways which drain directly into Lake Ontario but are not distinguished herein.
0 0.5 θ (c m 3cm -3)
2006 2007 2008 2009 2010 2011 2012
Date 0 50 Pre ci p (mm) -500 50
Temp (°C)
0 5000 10000 S. Ra d (Wm -2) 0 5 10
[image:4.595.49.287.63.191.2]ETo (mm)
Fig. 2. Daily time series plot of 10 cm site averaged soil moisture from K1 and daily time series of meteorological data collected at Kelso.
similar to the climate normals, with the exception of 2007, which had considerably lower than normal summer precipi-tation. Consequently, a prolonged period of low soil moisture can be seen throughout the summer of 2007 in Fig. 2, which is nearly two standard deviations below the mean soil mois-ture for the study period. A similar dry spell occurred during the summer of 2011, but was compensated for annually by a wetter-than-normal spring and autumn in that same year. The climatic variability in the watershed during the course of study is ideal for studying soil moisture variability as a large variety of conditions have been observed within a relatively short period of study, by climatological standards.
2.2 Data description
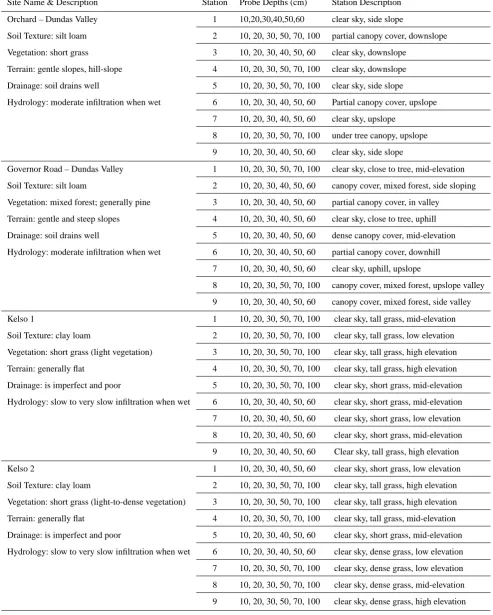
A soil moisture “site” refers to the location of an entire soil moisture array, i.e. Kelso 1 (K1), Kelso 2 (K2), Governor Road (GR) or Orchard (OR). Each site contains nine stations which are numbered from 1 to 9, where a “station” refers to a vertical soil moisture profile at a particular geographic loca-tion (Figs. 3, 4). A staloca-tion has six associated measurements for each sampling period for the six depths indicated in Ta-ble 2. Soil moisture characterized as “daily” refers to the mean value, and its variance, of a discrete 24 h period mea-sured using Eastern Standard Time.
The McMaster Mesonet provides long-term hourly soil moisture data at four sites, Kelso 1, Kelso 2 , Governor Road and Orchard, which have been collecting data continu-ously since 2006. Each site contains 54 Campbell Scientific CS616 multiplexed time domain reflectometry (TDR) probes attached to a CR10X data logger through nine soil mois-ture profile stations with six TDR probes each. Each pro-file station collects measurements at six depths between 10 to 100 cm, with specific depths given in Table 2. At each of the four sites, the nine profile stations are distributed in a grid pattern, where a 100 cm pit was dug at each station and six TDR probes were inserted horizontally into the soil. The majority of probes were inserted at 10, 20, 30, 50, 70 and 100 cm depths in order to capture the change in soil
0.5 1 1.5 2 2.5 3 3.5 0.5 1 1.5 2 2.5 3 3.5 0 0.5
1 6 5
3 1 7 8 9 2 Governor Road Drainage: Good Soil Texture: Silt Loam Vegetation: Mixed/Pine Forest Terrain: Gentle and Steep Slopes
Hydrology: Moderate Infiltration 4
0.5 1 1.5 2 2.5 3
3.5 0.5 1 1.5 2 2.5 3 3.5 0 0.5 1 Orchard
8 7 6
9 1 5
2 3 4
Drainage: Good Soil Texture: Silt Loam Vegetation: Short Grass Terrain: Gentle Slope
Hydrology: Moderate Infiltration
0.5 1 1.5
2 2.5 3 3.5 0.5 1 1.5 2 2.5 3 3.5 0 0.5 1 Kelso 1
Terrain: Generally Flat Soil Texture: Clay Loam Vegetation: Short Grass Drainage: Imperfect and Poor
Hydrology: Slow to Very Slow Infiltration 4 3 2 5 1 9 6 7 8 0.5 1 1.5 2 2.5 3 3.5 0.5 1 1.5 2 2.5 3 3.5 0 0.5 1 Kelso 2
Terrain: Generally Flat Soil Texture: Clay Loam Vegetation: Short Grass Drainage: Imperfect and Poor
Hydrology: Slow to Very Slow Infiltration
[image:4.595.309.548.63.240.2]4 5 3 2 1 9 6 7 8 Kelso Gov Rd Orchard
Fig. 3. Three dimensional schematic representation of the McMas-ter Mesonet. Note: the vertical dimensions are to scale, whereas spa-tial dimensions are not (see Fig. 4). The symbols in the centre map are consistent with Fig. 1.
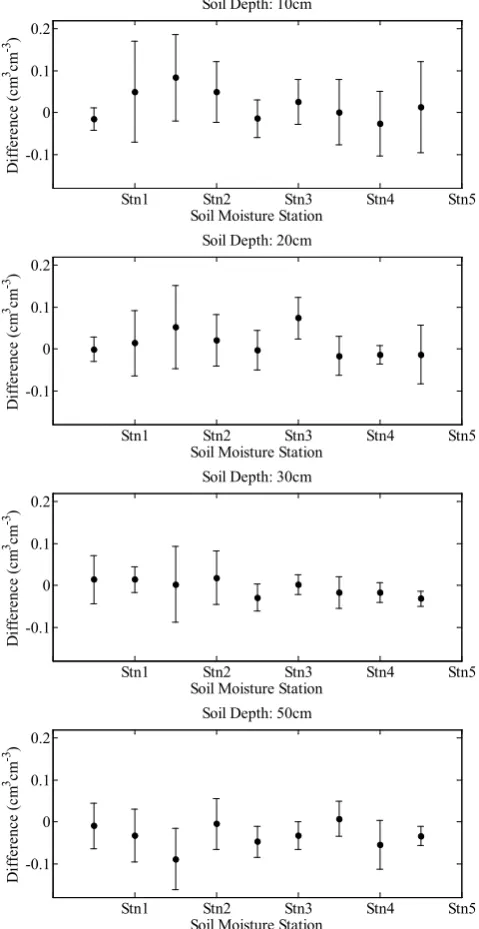
moisture in the hydrologically dynamic layer. In some in-stances, high clay content and topographic conditions did not allow for the full 100 cm depth to be reached and the TDR probes were inserted at 10, 20, 30, 40, 50 and 60 cm depths instead (see Table 2). All of the TDR profiles are connected to a data logger at the centre of the array at station 1. Each TDR array has an associated tipping bucket rain gauge and automated weather stations are associated with the TDR ar-rays located between K1 and K2 and at GR. The soil mois-ture data has been preprocessed to remove most erroneous measurements and when less than 72 temporally consecutive missing values were present, the data was infilled using linear interpolation (Kornelsen and Coulibaly, 2013) and/or the soil layer relative difference method if some values were missing between stations (Kornelsen and Coulibaly, 2013; Dumedah and Coulibaly, 2011). In addition to the Campbell Scientific datasets, a Stevens Water Hydra Probe array is operated in conjunction with the CS616 array at Kelso 1 providing an independent soil moisture dataset for comparison/validation, where Hydra Probes are co-located at each station and col-lect soil moisture information at depths of 5, 10, 20, 30, 40 and 50 cm at half-hourly intervals.
Table 1. Climatic conditions based on Britannia weather station (located at the centre of the watershed) and the Hamilton airport weather station (approx. 5 km south of watershed).
Jan Feb Mar Apr May Jun Jul Aug Sep Oct Nov Dec Ann
Hamilton airport (1971–2000)
Daily Max Temp (◦C) −2.2 −1.2 4.0 11.2 18.5 23.7 26.3 25.1 20.7 13.8 7.0 0.9 12.3
Daily Min Temp (◦C) −9.7 −9.1 −4.5 1.2 7.3 12.4 15.1 14.5 10.2 4.4 −0.4 −6.2 2.9
Daily Mean Temp (◦C) −6 −5.2 −0.3 6.3 12.9 18.0 20.8 19.8 15.5 9.1 3.3 −2.7 7.6
Rainfall (mm) 29.5 25.7 48.6 69.6 75.0 83.9 86.5 80.6 82.1 71.6 68.1 43.7 764.8
Precipitation (mm) 65.8 55.3 74.8 78.0 75.6 83.9 86.5 80.6 82.1 72.5 78.6 76.6 910.1
Mesonet – Britannia (2007)
Daily Max Temp (◦C) −0.3 −4.9 4.2 9.2 20.3 26.0 26.1 26.5 23.4 17.8 5.5 −0.4 12.8
Daily Min Temp (◦C) −7.4 −13.1 −4.6 1.4 7.6 13.4 13.7 15.1 10.9 8.2 −1.9 −6.3 3.1
Daily Mean Temp (◦C) −3.8 −9.0 −0.2 5.3 14.0 19.7 19.9 20.8 17.2 13.0 1.8 −3.3 7.9
Precipitation (mm) 51.8 10.6 57.8 70.8 46.0 43.4 16.8 28.0 25.6 50.4 66.6 62.0 529.8
Mesonet – Britannia (2008)
Daily Max Temp (◦C) 0.5 −1.3 2.0 14.0 16.3 23.7 26.1 22.3 21.1 13.4 5.7 0.0 12.0
Daily Min Temp (◦C) −6.4 −9.9 −6.4 2.7 5.3 13.6 15.2 7.3 10.7 3.2 −1.4 −8.2 2.2
Daily Mean Temp (◦C) −2.9 −5.6 −2.2 8.3 10.8 18.7 20.7 14.8 15.9 8.3 2.2 −4.1 7.1
Precipitation (mm) 58.0 64.6 49.0 50.0 53.8 108.6 143.2 120.0 102.2 36.6 77.2 100.6 963.8
Mesonet – Britannia (2009)
Daily Max Temp (◦C) −5.2 0.8 5.0 11.8 18.1 21.9 23.1 25.1 21.1 11.6 9.1 −0.2 11.9
Daily Min Temp (◦C) −13.5 −8.8 −4.5 1.8 6.5 11.4 13.2 14.7 10.5 3.7 1.0 −6.3 2.5
Daily Mean Temp (◦C) −9.4 −4.0 0.3 6.8 12.3 16.7 18.2 19.9 15.8 7.7 5.0 −3.3 7.2
Precipitation (mm) 17.8 71.2 63.0 137.6 50.0 52.8 97.4 120.8 31.4 82.9 32.5 91.6 849.0
Mesonet – Britannia (2010)
Daily Max Temp (◦C) −2.6 −0.9 8.2 15.9 20.4 23.1 28.0 26.5 20.3 14.1 7.7 −1.8 13.3
Daily Min Temp (◦C) −8.8 −7.4 −1.1 3.8 8.9 13.6 16.4 15.7 10.2 4.6 −1.1 −7.2 4.0
Daily Mean Temp (◦C) −5.7 −4.1 3.6 9.8 14.7 18.4 22.2 21.1 15.2 9.4 3.3 −4.5 8.6
Precipitation (mm) 20.1 19.0 91.2 48.6 55.2 138.6 127.0 39.4 106.8 73.0 129.0 31.3 897.2
Mesonet – Britannia (2011)
Daily Max Temp (◦C) −3.8 −1.2 3.0 10.6 17.7 23.3 29.6 26.5 21.7 14.5 10.3 3.5 13.0
Daily Min Temp (◦C) −11.9 −10.2 −5.8 1.2 8.4 12.5 16.7 15.0 11.3 5.5 2.0 −3.6 3.4
Daily Mean Temp (◦C) −7.8 −5.7 −1.4 5.9 13.0 17.9 23.1 20.8 16.5 10.0 6.2 0.0 8.2
Precipitation (mm) 24.4 34.2 87.0 100.6 142.2 54.0 12.0 86.4 74.2 125.2 82.6 68.0 890.8
Mesonet – Britannia (2007–2011)
Daily Max Temp (◦C) −2.3 −1.5 4.5 12.3 18.6 23.6 26.6 25.4 21.5 14.3 7.7 0.2 12.6
Daily Min Temp (◦C) −9.6 −9.9 −4.5 2.2 7.3 12.9 15.0 13.6 10.7 5.0 −0.3 −6.3 3.0
Daily Mean Temp (◦C) −5.9 −5.7 0.0 7.2 13.0 18.3 20.8 19.5 16.1 9.7 3.7 −3.0 7.8
Precipitation (mm) 34.4 39.9 69.6 81.5 69.4 79.5 79.3 78.9 68.0 73.6 77.6 70.7 826.1
two subwatersheds in which the arrays are located. The dis-tribution of the additional hydro-meteorological stations of the McMaster Mesonet provides a relatively dense monitor-ing network for watershed-scale applications, which can be supported by the hillslope-scale soil moisture arrays.
The Kelso sites (K1 & K2) are located in the northern por-tion of the watershed in an area that is predominantly agri-cultural land. The soil is a grey–brown Podzol (clay loam) that is a poorly drained with a higher clay content at depth (80–100 cm). The A horizon is light grey and mottled near the Bt horizon. These soils seat atop calcareous till at a depth of approximately 75 cm (Gillespie et al., 1971). The terrain is generally flat with some hummocks and a few small gen-tle sloping hills at the edge of the site. The land-cover is
predominantly meadow with some recently planted conif-erous and aspen trees scattered throughout the site. The K1 and K2 sites are located adjacent to each other to allow sam-pling of a larger area. However, both datasets are collected and stored independently and will herein often be considered as distinct data, in spite of their co-location, for the purposes of describing the dataset.
Table 2. McMaster Mesonet site and station description.
Site Name & Description Station Probe Depths (cm) Station Description
Orchard – Dundas Valley 1 10,20,30,40,50,60 clear sky, side slope
Soil Texture: silt loam 2 10, 20, 30, 50, 70, 100 partial canopy cover, downslope
Vegetation: short grass 3 10, 20, 30, 40, 50, 60 clear sky, downslope
Terrain: gentle slopes, hill-slope 4 10, 20, 30, 50, 70, 100 clear sky, downslope
Drainage: soil drains well 5 10, 20, 30, 50, 70, 100 clear sky, side slope
Hydrology: moderate infiltration when wet 6 10, 20, 30, 40, 50, 60 Partial canopy cover, upslope
7 10, 20, 30, 40, 50, 60 clear sky, upslope
8 10, 20, 30, 50, 70, 100 under tree canopy, upslope 9 10, 20, 30, 40, 50, 60 clear sky, side slope
Governor Road – Dundas Valley 1 10, 20, 30, 50, 70, 100 clear sky, close to tree, mid-elevation
Soil Texture: silt loam 2 10, 20, 30, 40, 50, 60 canopy cover, mixed forest, side sloping
Vegetation: mixed forest; generally pine 3 10, 20, 30, 40, 50, 60 partial canopy cover, in valley
Terrain: gentle and steep slopes 4 10, 20, 30, 40, 50, 60 clear sky, close to tree, uphill
Drainage: soil drains well 5 10, 20, 30, 40, 50, 60 dense canopy cover, mid-elevation
Hydrology: moderate infiltration when wet 6 10, 20, 30, 40, 50, 60 partial canopy cover, downhill
7 10, 20, 30, 40, 50, 60 clear sky, uphill, upslope
8 10, 20, 30, 50, 70, 100 canopy cover, mixed forest, upslope valley
9 10, 20, 30, 40, 50, 60 canopy cover, mixed forest, side valley
Kelso 1 1 10, 20, 30, 50, 70, 100 clear sky, tall grass, mid-elevation
Soil Texture: clay loam 2 10, 20, 30, 50, 70, 100 clear sky, tall grass, low elevation
Vegetation: short grass (light vegetation) 3 10, 20, 30, 50, 70, 100 clear sky, tall grass, high elevation
Terrain: generally flat 4 10, 20, 30, 50, 70, 100 clear sky, tall grass, high elevation
Drainage: is imperfect and poor 5 10, 20, 30, 50, 70, 100 clear sky, short grass, mid-elevation
Hydrology: slow to very slow infiltration when wet 6 10, 20, 30, 40, 50, 60 clear sky, short grass, mid-elevation
7 10, 20, 30, 40, 50, 60 clear sky, short grass, low elevation
8 10, 20, 30, 40, 50, 60 clear sky, short grass, mid-elevation
9 10, 20, 30, 40, 50, 60 Clear sky, tall grass, high elevation
Kelso 2 1 10, 20, 30, 40, 50, 60 clear sky, short grass, low elevation
Soil Texture: clay loam 2 10, 20, 30, 50, 70, 100 clear sky, tall grass, high elevation
Vegetation: short grass (light-to-dense vegetation) 3 10, 20, 30, 50, 70, 100 clear sky, tall grass, high elevation
Terrain: generally flat 4 10, 20, 30, 50, 70, 100 clear sky, tall grass, mid-elevation
Drainage: is imperfect and poor 5 10, 20, 30, 40, 50, 60 clear sky, short grass, mid-elevation
Hydrology: slow to very slow infiltration when wet 6 10, 20, 30, 40, 50, 60 clear sky, dense grass, low elevation
7 10, 20, 30, 50, 70, 100 clear sky, dense grass, low elevation
8 10, 20, 30, 50, 70, 100 clear sky, dense grass, mid-elevation
Elevation
(m) ASL
Elevation
(m) ASL
Elevation
(m) ASL
1 2
3 4 5
6 7 Wx Stn 8
9
1
2 3 4
5
6 7 9
8
2-6 2-7
2-8 2-9 2-5
2-1 2-4
2-3
1-5 1-6 1-7
1-8 1-9 1-1
1-2 1-3 1-4
Wx Stn 2-2
Eastings
581 000(m)
Northings 4 789 000(m) Gov Rd
Eastings 581000(m) Northings
4 788 000(m)
Elevation
(m) ASL
Northings 4 818
000(m) Eastings
586000(m)
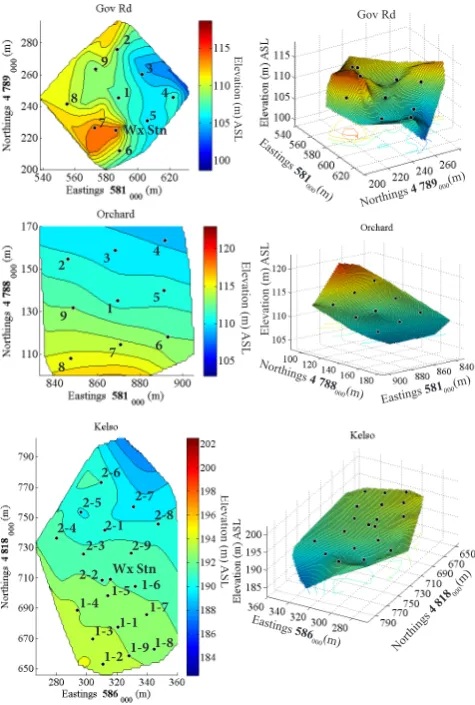
Fig. 4. Topography and layout of the soil moisture arrays at GR (top), OR (middle) and K1/K2 (bottom) as contour plots (left) and surface renderings (right). Contours were derived using natu-ral neighbour interpolation using topographic data collected with an Ashtech MM100 GPS and have an approximate horizontal RMSE of 20 cm and vertical RMSE of 50 cm. The surface plot vertical ex-aggeration is 3X. Note: surface and contour plots have different ori-entations to enhance the visual interpretation of the surface plot.
The B horizons are well developed and contain clay and iron accumulations. The C horizon typically begins at 75 cm depth and has a higher clay content (Presant et al., 1965). OR is located in a reclaimed apple orchard that is covered by meadow vegetation and has sparse apple trees. The site covers the transition between a gentle north facing slope and a flat plateau. The GR site is located on mixed terrain and has steep and gentle slopes having mixed/pine forest cover-ing most of the site with small open areas around the weather station and on the steep slopes. Figure 4 shows the terrain of each site and the locations of the soil moisture stations within each site.
The soil moisture arrays are supplemented with six weather stations and nine rain gauges distributed throughout the watershed. The weather stations are a mix of Campbell
Scientific and HOBO (data logger) stations, recording half-hourly observations of air temperature, relative humidity, vapour pressure, saturation vapour pressure, precipitation (rain only), incoming solar radiation, wind speed and wind direction. Additionally, grass reference evapotranspiration is calculated online from the collected data within the weather station using the Penman–Monteith equation (Campbell Sci-entific, 1999). The weather/hydrometric stations were dis-tributed to provide good characterization of the watershed with considerations given to accessibility and security. There are also 8 weather stations within or near the watershed that are operated by the Ontario Ministry of Natural Re-sources or Environment Canada, and which are also shown in Fig. 1. While not continuously recorded by the McMas-ter Mesonet, limited snowfall and snow depth measurements in and near the watershed are available from Environment Canada weather stations. In addition to meteorological data, water level, discharge and groundwater data are available independently from Environment Canada’s HYDAT (hydro-metric data) database and the Ontario Ministry of the Envi-ronment.
2.3 Campbell Scientific TDR and Stevens Hydra Probe Comparison
[image:7.595.48.286.63.416.2]Stn1 Stn2 Stn3 Stn4 Stn5 -0.1
0 0.1 0.2
Soil Moisture Station
D
iffe
re
nc
e (c
m
3 cm -3 )
Soil Depth: 10cm
Stn1 Stn2 Stn3 Stn4 Stn5
-0.1 0 0.1 0.2
Soil Moisture Station
D
iffe
re
nc
e (c
m
3 cm -3 )
Soil Depth: 20cm
Stn1 Stn2 Stn3 Stn4 Stn5
-0.1 0 0.1 0.2
Soil Moisture Station
D
iffe
re
nc
e (c
m
3 cm -3 )
Soil Depth: 30cm
Stn1 Stn2 Stn3 Stn4 Stn5
-0.1 0 0.1 0.2
Soil Moisture Station
D
iffe
re
nc
e (c
m
3 cm -3 )
[image:8.595.47.287.66.531.2]Soil Depth: 50cm
Fig. 5. Mean difference between Campbell Scientific CS616 TDR and Stevens Water Hydra Probe hourly soil moisture values at K1 from 2007 to 2011. The error bars represent one standard deviation.
3 Methodology
3.1 Statistical methods
For both the analysis and manipulation of soil moisture data, and for ease of use/presentation the data is characterized us-ing standard sample statistics. Herein, both spatial and tem-poral soil moisture statistics will be presented and so we will differentiate the statistics in terms of variability in both space and time.
Letθij k be the soil moistureθ at stationiand timekfor
the sampling depthj. The spatial mean soil moisture for a siteθj kcan be calculated as:
θj k=
1
Ni N i X
i=1
θij k , (1)
whereNi is the number of stationsi(usually 9) at which soil
moisture is sampled for a given depthj. Similarly the daily mean soil moisture for a stationθij is given as:
θij =
1
M
M X
k=1
θij k, (2)
whereMis the number of hours (usually 24) over which the mean value is taken. The daily soil moisture for a site at a specific depth is given by
θj =
1
NiM N i X
i=1 M X
k=1
θij k=
1
Ni N i X
i=1
θij, (3)
where the mean daily soil moisture for each station is first derived and the spatial mean is then calculated. For ease of consideration, the standard deviation and variance of soil moisture is only considered based on the second summation. Therefore the daily variance of a station is given by
σij2= 1
M−1
M X
k=1
θij k−θj k 2
, (4)
whereas the variance of the daily soil moisture at the entire site for depthjis given by
σj2= 1
Ni N i X
i=1
θij−θj 2
, (5)
where the temporal variance determined in Eq. (4) is ignored when calculating the daily site variance in Eq. (5). Because hourly soil moisture is highly autocorrelated, the daily tem-poral variability of soil moisture at each station is minimal in comparison to the spatial variability. Therefore, the loss of information resulting from the considered averaging scheme is assumed negligible. The above equations can also be ex-tended to apply to monthly soil moisture where daily soil moisture at a site/station is first calculated and Eqs. (2)–(3) and (4)–(5) are reapplied usingMas days instead of hours.
3.2 Temporal stability
where the relative difference δij k at station i, depth j and
timekis given by
δij k=
θij k−θj k
θj k
. (6)
In order to mitigate the effects of stochastic influences on the soil moisture pattern and the relative difference statistic, the mean and standard deviation can be calculated where the mean relative differenceδij and its standard deviationσ (δij)
are given by
δij=
1
M
M X
k=1
δij k, (7)
σ (δij)= v u u t
1
M−1
M X
k=1
δij k−δij 2
, (8)
where the variableM can be taken as a daily, monthly, an-nual or other value. It is common to express the mean relative difference based on the entire study period. A relative differ-ence of zero refers to a station that is representative of the mean soil moisture value, where high and low values repre-sent sites that are consistently wet or dry, respectively, com-pared to the mean. In order to better select sampling loca-tions that were both representative of the mean and had low variability Jacobs et al. (2004) proposed the combination of
σ (δij)andδijinto the root mean square error measure:
RMSEi = q
δij 2
+σ (δij)2. (9)
4 Results and discussion
The soil moisture in the Hamilton-Halton Watershed follows a seasonal cycle, with temperature and precipitation patterns seen in Fig. 2 and seasonal mean soil moisture presented in Table 3. While the precipitation is relatively evenly dis-tributed throughout the year, during the winter months there is little evapotranspiration and precipitation tends to accu-mulate on the surface as snow. The spring thaw results in thorough wetting of the soil, until the late-spring and sum-mer temperature increase causes a net dry-down of the soil. Thus, there are seasonal periods of wetting from the late fall to early spring months followed by a drying period from late spring to early fall. The notable exception to this pat-tern in Table 3 is the soil moisture at depths greater than 50 and 70 cm at GR/OR and Kelso, respectively, where the autumn experiences a slight net loss from the previous sea-son. Close analysis (results not shown) reveal this secondary dry-down is the result of dry autumns in 2007 and 2009 (Ta-ble 1) skewing the temporal statistics. The variability in the surface soil moisture dampened the impact of these dry years
in the statistics of the upper soil layers. Since the soil mois-ture data of the McMaster Mesonet have been collected on-ward from 2006, the dataset covers several unseasonably wet and dry periods and numerous wetting and drying events, which makes the dataset especially useful for hydrological analysis. Despite the advantages of a continuous dataset, a potential limitation must be noted with respect to freezing soil conditions. The Hamilton-Halton Watershed experiences mild winters in comparison to much of Canada, and periodic freezing and thawing are experienced throughout the winter months, especially in the upper soil layers. Freezing condi-tions are known to impact TDR measurements (Flerchinger et al., 2006; Kahimba and Sri Ranjan, 2007), an effect which is not accounted for directly herein, or in the native McMas-ter Mesonet dataset. Due to the low variability of soil mois-ture, near saturated conditions and comparatively mild con-ditions throughout the winter season, freezing is not expected to substantially impact the data or analysis. However, further research and data collection is required to confirm this as-sumption.
The further soil moisture data analyses conducted herein are only for the 10, 20 and 50 cm depths using the data from the CS616 TDR probes, as soil moisture observations are available for every site and station at these depths. The fol-lowing sections will present the results of the spatio-temporal and temporal stability analysis. First, the monthly mean and standard deviation will be discussed with links made to the local soil moisture state and variability as a result of local ground cover and topography. The temporal stability analy-sis will follow, focusing on seasonal trends, temporal con-sistency of the mean relative difference ranks and the time required for spatial organization to return following a distur-bance.
4.1 Spatio-temporal analysis
Table 3. Mean soil moisture for Winter (December, January, February), Spring (March, April, May), Summer (June, July, August) and Fall (September, October, November), and the average change between seasons at each site and depth.
Orchard
Winter Spring Summer Autumn
Depth (cm) Mean Change Mean Change Mean Change Mean Change
10 0.30 0.00 0.33 0.03 0.27 −0.06 0.30 0.02 20 0.33 0.03 0.34 0.01 0.29 −0.06 0.30 0.01 30 0.35 0.04 0.36 0.01 0.31 −0.05 0.31 0.00 40 0.36 0.04 0.37 0.01 0.33 −0.04 0.33 0.00 50 0.37 0.05 0.37 0.01 0.33 −0.04 0.32 −0.01 60 0.39 0.04 0.39 0.01 0.36 −0.03 0.35 −0.02 70 0.37 0.05 0.38 0.01 0.34 −0.04 0.32 −0.02 100 0.38 0.05 0.39 0.01 0.36 −0.03 0.33 −0.03
Governor Road
Winter Spring Summer Autumn
Depth (cm) Mean Change Mean Change Mean Change Mean Change
10 0.28 0.02 0.30 0.02 0.24 −0.06 0.26 0.02 20 0.31 0.04 0.32 0.01 0.26 −0.07 0.26 0.01 30 0.32 0.05 0.33 0.01 0.27 −0.07 0.27 0.00 40 0.33 0.06 0.34 0.01 0.27 −0.07 0.27 0.00 50 0.34 0.06 0.35 0.01 0.29 −0.07 0.28 −0.01 60 0.35 0.06 0.35 0.01 0.30 −0.05 0.29 −0.01 70 0.39 0.05 0.40 0.01 0.35 −0.05 0.33 −0.02 100 0.39 0.06 0.39 0.00 0.35 −0.04 0.33 −0.02
Kelso 1
Winter Spring Summer Autumn
Depth (cm) Mean Change Mean Change Mean Change Mean Change
10 0.32 0.03 0.35 0.03 0.24 −0.11 0.29 0.05 20 0.37 0.06 0.38 0.01 0.28 −0.10 0.30 0.03 30 0.38 0.05 0.39 0.01 0.31 −0.08 0.32 0.01 40 0.38 0.05 0.39 0.01 0.32 −0.07 0.32 0.01 50 0.38 0.05 0.39 0.01 0.32 −0.07 0.33 0.01 60 0.38 0.05 0.39 0.01 0.34 −0.05 0.33 0.00 70 0.37 0.04 0.38 0.01 0.34 −0.05 0.33 −0.01 100 0.35 0.02 0.37 0.01 0.35 −0.02 0.34 −0.01
Kelso 2
Winter Spring Summer Autumn
Depth (cm) Mean Change Mean Change Mean Change Mean Change
10 0.36 0.07 0.38 0.02 0.25 −0.14 0.29 0.05 20 0.38 0.07 0.39 0.00 0.29 −0.10 0.31 0.02 30 0.39 0.06 0.40 0.00 0.33 −0.07 0.34 0.01 40 0.39 0.04 0.40 0.00 0.35 −0.05 0.35 0.01 50 0.39 0.05 0.39 0.00 0.34 −0.05 0.34 0.00 60 0.37 0.04 0.38 0.01 0.34 −0.04 0.34 0.00 70 0.37 0.04 0.38 0.01 0.34 −0.04 0.33 0.00 100 0.37 0.03 0.37 0.00 0.34 −0.03 0.33 −0.01
standard deviation during the non-transitional periods is the result of the spatial heterogeneity induced by geographic fac-tors, such as depressions between hummucks at K1 and K2 storing water, or the redistribution of water to valleys at GR.
Fig. 6. Daily time series of mean soil moisture in the top 50 cm (black line) and precipitation (bars) for the McMaster Mesonet. The middle horizontal lines represent the mean of all observations at each site and one standard deviation, whereas the grey shaded area represents the spatial standard deviation for each sampling day.
concave down parabolic relationship. At K1 and K2 vari-ability generally decreases with increasing soil moisture. The concave down relationship was also found by Famiglietti et al. (2008) at extents greater than 800 m, whereas the decreas-ing mean-variance relationship of Kelso has been more often found at the field scale (Brocca et al., 2010, 2007; Western et al., 2004; Hupet and Vanclooster, 2002), particularly in humid climates (Brocca et al., 2007). The concave down lationship at GR and OR likely results from topographic re-distribution, an influence under-represented in hillslope-scale studies, and suggests that topography is a primary control and climate a secondary control of the change in variability with mean soil moisture state. Soil moisture at the 30 and 50 cm depths became less variable as soil moisture increased, how-ever, the relatively high soil moisture content at these depths resulted in few observations where the mean moisture con-tent was less than 0.25 cm3cm−3, the range where variability
decreased in the surface measurements at GR and OR. Since the soil moisture in the watershed exhibits seasonal-ity, the data have been aggregated on a monthly basis for the years 2007 to 2011 and analysed as spatial soil moisture pat-terns. The seasonal (monthly) mean and seasonal (monthly) standard deviation of soil moisture for each site can be seen in Fig. 8 and Supplement 1, respectively, as contour plots, which were created by interpolating the soil moisture val-ues between points. For the purposes of making physical in-terpretation of the soil moisture patterns, the results will be presented as first an inter-site comparison making broad gen-eralizations, and then intra-site comparisons making note of specific anomalies and patterns.
Both K1 and K2 have uniformly distributed soil moisture at all depths and are persistently wetter than the other sites. This results from the lower infiltration capacity and flat to-pography at this site. Also, the hummocky terrain provides many small depressions in which surface water is stored. OR also has a relatively uniform soil moisture pattern at all depths, although there is a marked spatial pattern at the 10 and 20 cm depths resulting from the sloping terrain. GR has the most variability in soil moisture pattern during all months resulting from the complex topography and vegeta-tion. All sites experience the highest variability (standard de-viation) during the month of January, which is believed to be the result of freeze–thaw processes with temperature fluc-tuations around 0◦C causing sporadic redistribution of soil moisture, and inducing errors in the TDR measurements. The lowest variability is during the spring season, when the soil is consistently wet due to snowmelt and low evapotranspira-tion. During the summer months there is moderate variability brought on by wetting and drying cycles.
0.1 0.2 0.3 0.4 0
0.002 0.004 0.006 0.008 0.01 0.012
Mean Soil Moisture ( m3m-3 )
V
ar
ian
ce (
(m
3m
-3) 2 )
K1 and 2 GR OR
0.1 0.2 0.3 0.4 0.5
0 0.002 0.004 0.006 0.008 0.01
Mean Soil Moisture ( m3m-3 )
V
ar
ian
ce (
(m
3 m
-3 ) 2 )
K1 and 2 GR OR
0.2 0.25 0.3 0.35 0.4 0.45
0 1 2 3 4 5 6 7 8 x 10⁻³
Mean Soil Moisture ( m3m-3 )
V
ar
ian
ce (
(m
3 m
-3 ) 2 )
0.2 0.25 0.3 0.35 0.4 0.45
0 1 2 3 4 5 6 7 8 x 10
-3
Mean Soil Moisture ( m3m-3 )
V
ar
ian
ce (
(m
3 m
-3 ) 2 ) a)
b)
c)
d)
Fig. 7. Relationship between mean soil moisture and variance for the McMaster Mesonet sites at depths of (a) 10 cm, (b) 20 cm, (c) 30 cm and (d) 50 cm.
where there are few prominent terrain features, with the no-table exceptions of a small embankment at the south-east of K1 and a hill in the north-east of K2. These features result in lower mean soil moisture, which is particularly prominent during the summer and fall months and result in the great-est contrast in standard deviations during the winter months. The slope pattern in Kelso is also consistent, although some-what muted, to a depth of 50 cm, however it declines at 70 to 100 cm (results not shown). This pattern is also generally present at OR, with the exceptions of OR-1, which has low soil moisture and high variability but is located mid-slope. This anomaly results from a combination of a slight depres-sion in the surface at OR-1 temporarily storing water, and decreased vegetation density due to human disturbance and a protecting fence. Similarly, OR-5 and 8 are located on the upper- and mid-slope, respectively, and have lower mean and more highly variable soil moisture than expected. At OR-8 this results from the sensor being located near a tree, whereas OR-5 is on a side-slope facing a roadway, where drainage to the road side is expected. While still present, the impact of the minor surface features are not as prevalent at the 20 and 50 cm depths suggesting that, at lower depths, soil moisture is more representative of general patterns in the landscape. At GR, stations 7 and 4 have low mean soil moisture and mod-erate to high variability due to their location near the crown of a hill. Similarly, the higher moisture content present in the valleys is consistent with previous findings (Famiglietti et al., 1999) and demonstrates the importance of topographic redistribution at small-scales and the long correlation length of variability induced by topography.
4.2 Temporal stability analysis
The temporal stability of a station refers to the rank of a sta-tion relative to the mean soil moisture state at a particular site. It has often been noted that while absolute soil moisture changes, the ranking of soil moisture at a particular location with respect to the mean value is relatively constant (Vachaud et al., 1985; Martinez-Fernandez and Ceballos, 2003; Cosh et al., 2004; Vivoni et al., 2008). Here, the temporal stability is analysed for the entire length of record, amalgamating the Kelso stations as well as GR and OR due to proximity, and each site has been analysed on a seasonal (monthly) basis for the 10, 20 and 50 cm depths.
4.2.1 Long-term temporal stability
[image:12.595.89.248.62.643.2]Kelso 1
Kelso 2
Orchard
[image:13.595.73.525.64.465.2]Governor Road
Fig. 8. Seasonal (monthly) mean soil moisture of McMaster Mesonet sites. The contour plots are created by a natural neighbour inter-polant between observed soil moisture points. A complimentary contour plot of seasonal (monthly) standard deviation can be found in the Supplement.
depth, showing that variability is greatest near the surface (Choi and Jacobs, 2007) and that rank stability is less impor-tant with depth (Heathman et al., 2009). The relative differ-ence is generally consistent across depths, where only minor changes in rank position occur. Exceptions to this are the re-sult of small-scale features, where vegetation roots, canopy or depression storage impacts the relative difference pattern more strongly at certain depths (Famiglietti et al., 1998). OR-1, GR-9 and K-19 are examples of this, where the position of the surface and subsurface soil moisture relative to the mean changes with depth. The distribution of both OR and GR stations throughout the relative difference plot suggests that topography is more important in determining the spatial distribution of soil moisture than vegetation which was also noted by Cosh et al. (2004) in the Walnut Creek Experimental
Watershed. Generally, the stations with the highest rank are located at the bottom of the slopes, whereas stations with the lowest rank are located in upslope areas. This is also true of the Kelso sites, where the change in elevation is minor. How-ever, the relatively flat topography at Kelso results in less stability in the spatial distribution of soil moisture than is ob-served at OR and GR, as indicated by the standard deviation of the relative difference.
4.2.2 Seasonal temporal stability
a)
b)
[image:14.595.48.289.59.266.2]c)
Fig. 9. Mean relative difference for the entire study period at the McMaster Mesonet sites at depths of (a) 10 cm, (b) 20 cm, (c) 50 cm. GR and OR are grouped due to their close spatial proxim-ity, as are K1 and K2. The bars represent one standard deviation of the relative difference and the dotted line shows the RMSE from Eq. (9).
station remains generally consistent throughout time. Un-like the other sites, there is a marked change in temporal rankings at GR throughout the year as seen in Fig. 10. At the monthly scale, a similarδij may result in some stations
changing ranked position. For example, in Fig. 10 stations 7 and 5 both represent dry stations but have changed rank or-der as the driest station. Often due to the overlap in variance ofδij, especially for mean representative sites, the change in
station rank order is not meaningful (α=0.05). An example is station 4 in Fig. 10, where the station is always representa-tive of the mean or median value but changes rank order.The relative difference for the stations at GR have generally low variability, but shift at the 10 and 20 cm depths. The greatest change in rank occurs at GR-3 and 4. During the winter and spring the downslope station (GR-3) is consistently the high-est ranked station (wet), however, during the summer and fall months GR-3 becomes mid-ranked and is more representa-tive of the site mean soil moisture. A noticeable feature in Fig. 10, is the presence of a definitive slope or stronger rank-ing durrank-ing the sprrank-ing and summer periods. In comparison, the October mean relative difference plot shows most stations, except for GR-5 and 7, have a relatively flat trend.
[image:14.595.307.549.65.243.2]It has been suggested that temporal stability analysis can be used to select monitoring sites representative of the field/catchment mean (Brocca et al., 2010; Jacobs et al., 2004). The results show the need for caution when using this approach as sites representative of the mean under a particular set of soil conditions (seasons) were not repre-sentative during all time periods, and the suggestion to use
Fig. 10. Seasonal temporal stability at GR at a depth of 10 cm. The boxes show the mean relative difference and the bars one standard deviation of the relative difference. The white half boxes at the top of the figure show where a station is similar (α=0.05) to its neigh-bour on the respective side.
multiple mid-ranked sites is prudent. The change in rank of the wet stations (GR-3) is unlike other findings where wet and dry sites are stable (Cosh et al., 2008; Jacobs et al., 2004; Martinez-Fernandez and Ceballos, 2003) and indicates a transition in influences controlling spatial distribution, where topography dominates in wet conditions (Heathman et al., 2009; Western and Bloschl, 1999; Famiglietti et al., 1998) and vegetation and soil texture dominate in dry con-ditions (Vivoni et al., 2008; Hupet and Vanclooster, 2002). The demonstrated “seasonality” should be taken into ac-count when using temporal stability at the hillslope to catch-ment scale in complex terrain, especially where vegetation changes may influence soil moisture variability (Hupet and Vanclooster, 2002).
Table 4. Characteristics of analysed rain events. If a rain event is broken into two distinct rainfalls, the amount of rain in each is sep-arated, and the duration is separated as first rainfall duration, gap length, and second rainfall duration.
Rain Amount of Duration
Event Date and Time (LT) Rain (mm) (hours)
Kelso (K1)
1 11 Jul 2009 – 09:00–11:00 h 6.2 3
2 28–29 Aug 2009–22:00–11:00 h 22.1/0.1 8/5/1
3 15–16 Mar 2011–23:00–10:00 h 6.1 12
4 3 Aug 2011–03:00–22:00 h 8.6/1.6 4/10/6
Dundas Valley (GR & OR)
1 11 Jul 2009 – 09:00–14:00 h 9.0/0.1 2/1/1
2 28–29 Aug 2009 – 22:00–20:00 h 32.2/3.2 11/11/1
3 15–16 Mar 2011 – 22:00–10:00 h 4.8 13
4 3 Aug 2011 – 14:00–24:00 h 1.6/1.0 2/3/6
4.2.3 Persistence of ranks
The fundamental concept of temporal stability is the persis-tence of the relative spatial pattern of soil moisture, which has already been demonstrated to be more distinct during the spring and summer months. However, it is known that precipitation has a homogenizing effect on the soil moisture pattern and can disrupt the temporal stability pattern at all scales (Wilson et al., 2003; Famiglietti et al., 2008), which may hamper the use of temporal stability in hydrological ap-plications (Loew and Mauser, 2008). Due to the collection of hourly data at the McMaster Mesonet a preliminary as-sessment of the potential of precipitation to impact temporal stability can be performed. Four rain storms were selected to analyse the length of interruption of the temporal stabil-ity pattern and to provide insight as to the duration required for the dominant soil moisture pattern to re-emerge. The four rain events were selected based on two primary criteria: (i) significant rainfall being present at both Kelso (K1) and Dun-das Valley (GR & OR) and (ii) a sufficient period without rain is present both prior to and following the rain event so as to allow for the presence of a stable soil moisture pattern before and after the rain. The details of the four selected storms can be found in Table 4, and the relative difference for storm 2 is shown in Fig. 11. Only storm 2 at 10 cm is presented herein for brevity and K2 is ignored because of the close proximity and similar topography to K1.
[image:15.595.52.285.116.253.2]Due to the dry conditions prior to rainfall and the slop-ing topography, rain event 1 did not have a distslop-inguishable impact on the soil moisture pattern at any site, however it did cause noticeable wetting at K1. While some change oc-curred immediately following the precipitation, the peak of the impact at K1 occurred 24 to 40 h following the rain event as ponded water slowly infiltrated the poorly drained soil. Rain storm 2 added significantly more water to the soil than the other storms and had a strong wetting effect at all sites, with the greatest impact at the 20 cm depth. At K1, the storm
Fig. 11. Analysis of the mean relative difference before and after rain event 2 at a depth of 10 cm at K1, OR and GR. The colour scale changes from red (dry) to blue (wet) where mean soil moisture values (δj k=0) are cyan. For visual interpretation the colour map
is stretched for each image and colour values are relative.
These results lead to several insights about the nature of temporal stability following rain. It should first be noted that without the soil being wet prior to the addition of water, the temporal stability of the soil moisture was not impacted without the addition of a considerable amount of rain (>20 mm). The normal rainfall amounts for the water-shed (2 to 10 mm) did not cause enough homogenization to affect the temporal (rank) stability pattern, even at the flat and poorly drained Kelso site. Also important is the impact of to-pography and vegetation as was best noted at the GR site. Dense vegetation resulted in high interception leaving GR-5 persistently dry, whereas GR-4 is located on an uphill area and so while its rank was impacted by rainfall, the higher potential for soil water redistribution caused that station to recover its relative rank with only a short delay.
5 Conclusions
The McMaster Mesonet was introduced and spatio-temporal and temporal stability analysis carried out in order to charac-terize the soil moisture patterns representative of the Mesonet datasets. The McMaster Mesonet consists primarily of the infrastructure necessary to monitor hourly soil moisture pro-files using a high-spatial-resolution TDR array at four sites, as well as associated hydro-meteorological stations. The sites represent different topographies and vegetation covers and provide some insight into the seasonal patterns of soil moisture experienced in the climatic context of the southern Great Lakes Basin.
Analysis of the data reveals a moderately well-organized soil moisture pattern which is temporally persistent on a sea-sonal basis. Topography represents a dominant control of the soil moisture pattern in wet to intermediate soil mois-ture conditions, whereas vegetation, soil texmois-ture and micro-topography have greater influence in intermediate–dry condi-tions. The spatial pattern at subseasonal scales was persistent in most conditions, unless a substantial rainfall/snowmelt re-sulted in homogenization of the soil moisture. Following dis-turbance by precipitation, the relative soil moisture pattern re-emerged after 18 to 24 h of drying and the moisture added by the precipitation was removed within 4 to 7 days. At the subseasonal timescale, soil moisture variability was the greatest at a depth of 10 cm, and was lowest at a depth of 50 cm. The spatial pattern of soil moisture at a depth of 20 cm was more representative of mean topography, where the in-fluence of hummocks and small depressions at the surface was not as prevalent.
These types of analyses of soil moisture patterns at mul-tiple temporal scales are only possible where monitoring is continuous and of a long duration and high temporal resolution such as the McMaster Mesonet. Unlike studies with shorter duration or random sampling periods, these re-sults lead to the conclusion that hydrological applications of the temporal (rank) stability concept should account for
temporal (seasonal) changes, especially in complex terrain. Where topography was simple, as at Kelso, spatial variabil-ity was greatest in dry conditions due to storage in hummocks and differences in vegetation cover. At GR and OR, variabil-ity was highest at intermediate soil moisture conditions as topography and vegetation both provided a strong control on the soil moisture spatial pattern.
The long-term, high-spatial-resolution hourly soil mois-ture profiles recorded by the McMaster Mesonet can pro-vide insights into the nature of this important hydrological state variable. Future work will use data from the McMas-ter Mesonet for data assimilation to improve hydrological forecasts, downscaling and validation of remote sensing soil moisture products and to study the complex interactions be-tween climate, soil, topography and vegetation.
Supplementary material related to this article is
available online at: http://www.hydrol-earth-syst-sci.net/ 17/1589/2013/hess-17-1589-2013-supplement.pdf.
Acknowledgements. The authors would like to gratefully
acknowl-edge the help of G. Dumedah, J. Samuel, X. Long and others for helping with the data downloading and ongoing maintenance of the McMaster Mesonet dataset. We would also like to thank two anonymous referees for their comments which have helped to improve this manuscript. The McMaster Mesonet and this work are partially supported by the Canadian Foundation for Innovation (CFI), the Ontario Innovation Trust (OIT) and the Natural Sciences and Engineering Research Council (NSERC) of Canada. The authors would also like to thank the Hamilton Conservation Authority and Conservation Halton for permitting use of their land for the research experiment.
Edited by: Y. Fan
References
Alavi, N., Berg, A. A., Warland, J. S., Parkin, G., Verseghy, D., and Bartlett, P.: Evaluating the Impact of Assimilating Soil Moisture Variability Data on Latent Heat Flux Estimation in a Land Sur-face Model, Can. Water Resour. J., 35, 157–172, 2010.
Albergel, C., R¨udiger, C., Pellarin, T., Calvet, J.-C., Fritz, N., Frois-sard, F., Suquia, D., Petitpa, A., Piguet, B., and Martin, E.: From near-surface to root-zone soil moisture using an exponential fil-ter: an assessment of the method based on in-situ observations and model simulations, Hydrol. Earth Syst. Sci., 12, 1323–1337, doi:10.5194/hess-12-1323-2008, 2008.
Bl¨oschl, G. and Sivapalan, M.: Scale issues in hydrological mod-elling: A review, Hydrol. Process., 9, 251–290, 1995.
Brocca, L., Morbidelli, R., Melone, F., and Moramarco, T.: Soil moisture spatial variability in experimental areas of central Italy, J. Hydrol., 333, 356–373, doi:10.1016/j.jhydrol.2006.09.004, 2007.
Brocca, L., Melone, F., Moramarco, T., and Singh, V. P.: Assimilation of Observed Soil Moisture Data in Storm Rainfall-Runoff Modeling, J. Hydrol. Eng., 14, 153–165, doi:10.1061/(ASCE)1084-0699(2009)14:2(153), 2009. Brocca, L., Melone, F., Moramarco, T., and Morbidelli, R.:
Spatial-temporal variability of soil moisture and its esti-mation across scales, Water Resour. Res., 46, W02516, doi:10.1029/2009WR008016, 2010.
Bronstert, A. and B´ardossy, A.: The role of spatial variability of soil moisture for modelling surface runoff generation at the small catchment scale, Hydrol. Earth Syst. Sci., 3, 505–516, doi:10.5194/hess-3-505-1999, 1999.
Campbell Scientific: On-Line Estimation of Grass Reference Evap-otranspiration with the Campbell Scientific Automated Weather Station: App Note Code: 4-D. Logan, UT, 1999.
Ceballos, A., Scipal, K., Wagner, W., and Martinez-Fernandez, J.: Validation of ERS scatterometer-derived soil moisture data in the central part of the Duero Basin, Spain, Hydrol. Process., 19, 1549–1566, doi:10.1002/hyp.5585, 2005.
Chen, Y.: Letter to the editor on “Rank stability or tem-poral stability”, Soil Sci. Soc. Am. J., 70, 306–306, doi:10.2136/sssaj2005.0290l, 2006.
Choi, M. and Jacobs, J. M.: Soil moisture variability of root zone profiles within SMEX02 remote sensing footprints, Adv. Wa-ter Resour., 30, 883–896, doi:10.1016/j.advwatres.2006.07.007, 2007.
Cosh, M. H., Jackson, T. J., Bindlish, R., and Prueger, J. H.: Water-shed scale temporal and spatial stability of soil moisture and its role in validating satellite estimates, Remote Sens. Environ., 92, 427–435, doi:10.1016/j.rse.2004.02.016, 2004.
Cosh, M. H., Jackson, T. J., Moran, S., and Bindlish, R.: Tem-poral persistence and stability of surface soil moisture in a semi-arid watershed, Remote Sens. Environ., 112, 304–313, doi:10.1016/j.rse.2007.07.001, 2008.
Das, N. N., Mohanty, B. P., Cosh, M. H., and Jackson, T. J.: Modeling and assimilation of root zone soil moisture using remote sensing observations in Walnut Gulch Water-shed during SMEX04, Remote Sens. Environ., 112, 415–429, doi:10.1016/j.rse.2006.10.027, 2008.
Dorigo, W. A., Wagner, W., Hohensinn, R., Hahn, S., Paulik, C., Xaver, A., Gruber, A., Drusch, M., Mecklenburg, S., van Oeve-len, P., Robock, A., and Jackson, T.: The International Soil Mois-ture Network: a data hosting facility for global in situ soil mois-ture measurements, Hydrol. Earth Syst. Sci., 15, 1675–1698, doi:10.5194/hess-15-1675-2011, 2011.
Dumedah, G. and Coulibaly, P.: Evaluation of statistical methods for infilling missing values in high-resolution soil moisture data, J. Hydrol., 400, 95–102, doi:10.1016/j.jhydrol.2011.01.028, 2011. Famiglietti, J. S., Rudnicki, J. W., and Rodell, M.: Variability in surface moisture content along a hillslope transect: Rattlesnake Hill, Texas, J. Hydrol., 210, 259–281, doi:10.1016/S0022-1694(98)00187-5, 1998.
Famiglietti, J. S., Devereaux, J. A., Laymon, C. A., Tsegaye, T., Houser, P. R., Jackson, T. J., Graham, S. T., Rodell, M., and van Oevelen, P. J.: Ground-based investigation of soil moisture
variability within remote sensing footprints during the Southern Great Plains 1997 (SGP97) Hydrology Experiment, Water Re-sour. Res., 35, 1839–1851, doi:10.1029/1999WR900047, 1999. Famiglietti, J. S., Ryu, D., Berg, A. A., Rodell, M., and Jackson, T.
J.: Field observations of soil moisture variability across scales, Water Resour. Res., 44, W01423, doi:10.1029/2006WR005804, 2008.
Flerchinger, G. N., Seyfried, M. S., and Hardegree, S. P.: Using soil freezing characteristics to model multi-season soil water dynam-ics, Vadose Zone J., 5, 1143–1153, doi:10.2136/vzj2006.0025, 2006.
Gillespie, J. E., Wicklund, R. E., and Miller, M. H.: The Soils of Halton County: Report No. 43 of the Ontario Soil Survey. On-tario Department of Agriculture, 80 pp., 1971.
Grayson, R. B. and Western, A. W.: Towards areal estimation of soil water content from point measurements: time and space stability of mean response, J. Hydrol., 207, 68–82, 1998.
Heathman, G. C., Larose, M., Cosh, M. H., and Bindlish, R.: Sur-face and profile soil moisture spatio-temporal analysis during an excessive rainfall period in the Southern Great Plains, USA, Catena, 78, 159–169, doi:10.1016/j.catena.2009.04.002, 2009. Hupet, F. and Vanclooster, M.: Intraseasonal dynamics of soil
mois-ture variability within a small agricultural maize cropped field, J. Hydrol., 261, 86–101, doi:10.1016/S0022-1694(02)00016-1, 2002.
Ivanov, V. Y., Fatichi, S., Jenerette, G. D., Espeleta, J. F., Troch, P. A., and Huxman, T. E.: Hysteresis of soil moisture spatial het-erogeneity and the “homogenizing” effect of vegetation, Water Resour. Res., 46, W09521, doi:10.1029/2009WR008611, 2010. Jacobs, J. M., Mohanty, B. P., Hsu, E. C., and Miller, D.:
SMEX02: Field scale variability, time stability and similar-ity of soil moisture, Remote Sens. Environ., 92, 436–446, doi:10.1016/j.rse.2004.02.017, 2004.
Kahimba, F. C. and Sri Ranjan, R.: Soil temperature correction of field TDR readings obtained under near freezing conditions, Can. Biosys. Eng., 49, 1.19–1.26, 2007.
Komma, J., Bloeschl, G., and Reszler, C.: Soil moisture updating by Ensemble Kalman Filtering in real-time flood forecasting, J. Hy-drol., 357, 228–242, doi:10.1016/j.jhydrol.2008.05.020, 2008. Kornelsen, K. and Coulibaly, P.: Comparison of interpolation,
sta-tistical and data driven methods for imputation of missing values in a distributed soil moisture dataset, J. Hydrol. Eng., accepted, 2013.
Lebel, T., Cappelaere, B., Galle, S., Hanan, N., Kergoat, L., Levis, S., Vieux, B., Descroix, L., Gosset, M., Mougin, E., Peugeot, C., and Seguis, L.: AMMA-CATCH studies in the Sahelian region of West-Africa: An overview, J. Hydrol., 375, 3–13, doi:10.1016/j.jhydrol.2009.03.020, 2009.
Loew, A. and Mauser, W.: On the disaggregation of passive mi-crowave soil moisture data using a priori knowledge of tem-porally persistent soil moisture fields, IEEE T. Geosci. Remote Sens., 43, 819–834, doi:10.1109/TGRS.2007.914800, 2008. Loew, A., Schwank, M., and Schlenz, F.: Assimilation of an L-Band
Microwave Soil Moisture Proxy to Compensate for Uncertainties in Precipitation Data, IEEE T. Geosci. Remote Sens., 47, 2606– 2616, doi:10.1109/TGRS.2009.2014846, 2009.
study in Sri Lanka, Adv. Water Resour., 31, 1333–1343, doi:10.1016/j.advwatres.2008.06.004, 2008.
Martinez-Fernandez, J. and Ceballos, A.: Temporal stability of soil moisture in a large-field experiment in Spain, Soil Sci. Soc. Am. J., 67, 1647–1656, 2003.
Merlin, O., Chehbouni, A., Boulet, G., and Kerr, Y.: Assimilation of disaggregated microwave soil moisture into a hydrologic model using coarse-scale meteorological data, J. Hydrometeorol., 7, 1308–1322, doi:10.1175/JHM552.1, 2006.
Minet, J., Laloy, E., Lambot, S., and Vanclooster, M.: Effect of high-resolution spatial soil moisture variability on simulated runoff re-sponse using a distributed hydrologic model, Hydrol. Earth Syst. Sci., 15, 1323–1338, doi:10.5194/hess-15-1323-2011, 2011. Mohanty, B. P. and Skaggs, T. H.: Spatio-temporal evolution and
time-stable characteristics of soil moisture within remote sens-ing footprints with varysens-ing soil, slope, and vegetation, Adv. Wa-ter Resour., 24, 1051–1067, doi:10.1016/S0309-1708(01)00034-3, 2001.
Mohanty, B. P., Famiglietti, J. S., and Skaggs, T. H.: Evo-lution of soil moisture spatial structure in a mixed vegeta-tion pixel during the Southern Great Plains 1997 (SGP97) Hydrology Experiment, Water Resour. Res., 36, 3675–3686, doi:10.1029/2000WR900258, 2000a.
Mohanty, B. P., Skaggs, T. H., and Famiglietti, J. S.: Analysis and mapping of field-scale soil moisture variability using high-resolution, ground-based data during the Southern Great Plains 1997 (SGP97) Hydrology Experiment, Water Resour. Res., 36, 1023–1031, doi:10.1029/1999WR900360, 2000b.
Mohr, K. I., Baker, R. D., Tao, W. K., and Famiglietti, J. S.: The sensitivity of West African convective line water budgets to land cover, J. Hydrometeorol., 4, 62–76, doi:10.1175/1525-7541(2003)004<0062:TSOWAC>2.0.CO;2, 2003.
Peters-Lidard, C. D., Pan, F., and Wood, E. F.: A re-examination of modeled and measured soil moisture spatial variability and its implications for land surface modeling, Adv. Water Resour., 24, 1069–1083, doi:10.1016/S0309-1708(01)00035-5, 2001. Presant, E. W., Wicklund, R. E., and Matthews, B. C.: The Soils of
Wentworth County: Report No. 32 of the Ontario Soil Survey. Ontario Department of Agriculture, 72 pp., 1965.
Ryu, D. and Famiglietti, J. S.: Characterization of footprint-scale surface soil moisture variability using Gaussian and beta distribution functions during the Southern Great Plains 1997 (SGP97) hydrology experiment, Water Resour. Res., 41, W12433, doi:10.1029/2004WR003835, 2005.
Ryu, D. and Famiglietti, J. S.: Multi-scale spatial correlation and scaling behavior of surface soil moisture, Geophys. Res. Lett., 33, L08404, doi:10.1029/2006GL025831, 2006.
Seneviratne, S. I., Corti, T., Davin, E. L., Hirschi, M., Jaeger, E. B., Lehner, I., Orlowsky, B., and Teuling, A. J.: Investigating soil moisture-climate interactions in a changing climate: A review, Earth-Sci. Rev., 99, 125–161, doi:10.1016/j.earscirev.2010.02.004, 2010.
Torres, R., Dietrich, W. E., Montgomery, D. R., Anderson, S. P., and Loague, K.: Unsaturated zone processes and the hydrologic response of a steep, unchanneled catchment, Water Resour. Res., 34, 1865–1879, 1998.
Vachaud, G., Silans, P. D., Balabanis, P., and Vauclin, M.: Tempo-ral stability of spatially measured soil water probability density function, Soil Sci. Soc. Am. J., 49, 822–828, 1985.
Vanderlinden, K., Vereecken, H., Hardelauf, H., Herbst, M., Mart´ınez, G., Cosh, M., and Pachepsky, Y.: Temporal stability of soil water contents: A review of data and analyses, Vadose Zone J., 11, 4, doi:10.2136/vzj2011.0178, 2012.
Vivoni, E. R., Gebremichael, M., Watts, C. J., Bindlish, R., and Jackson, T. J.: Comparison of ground-based and remotely-sensed surface soil moisture estimates over complex ter-rain during SMEX04, Remote Sens. Environ., 112, 314–325, doi:10.1016/j.rse.2006.10.028, 2008.
Western, A. W. and Bloschl, G.: On the spatial scaling of soil moisture, J. Hydrol., 217, 203–224, doi:10.1016/S0022-1694(98)00232-7, 1999.
Western, A. W., Zhou, S. L., Grayson, R. B., McMahon, T. A., Bloschl, G., and Wilson, D. J.: Spatial correlation of soil moisture in small catchments and its relationship to domi-nant spatial hydrological processes, J. Hydrol., 286, 113–134, doi:10.1016/j.jhydrol.2003.09.014, 2004.
Wilson, D. J., Western, A. W., Grayson, R. B., Berg, A. A., Lear, M. S., Rodell, M., Famiglietti, J. S., Woods, R. A., and McMahon, T. A.: Spatial distribution of soil moisture over 6 and 30 cm depth, Mahurangi river catchment, New Zealand, J. Hydrol., 276, 254– 274, doi:10.1016/S0022-1694(03)00060-X, 2003.