Georgia State University
ScholarWorks @ Georgia State University
Nutrition Theses Department of Nutrition
Fall 11-11-2015
Relationship of Energy Balance and Body
Composition in Elite Female Gymnasts
Taylor E. Blake
Georgia State University
Follow this and additional works at:https://scholarworks.gsu.edu/nutrition_theses
This Thesis is brought to you for free and open access by the Department of Nutrition at ScholarWorks @ Georgia State University. It has been accepted for inclusion in Nutrition Theses by an authorized administrator of ScholarWorks @ Georgia State University. For more information, please contact [email protected].
Recommended Citation
Blake, Taylor E., "Relationship of Energy Balance and Body Composition in Elite Female Gymnasts." Thesis, Georgia State University, 2015.
This thesis, RELATIONSHIP OF ENERGY BALANCE AND BODY COMPOSITION IN ELITE FEMALE GYMNASTS, by Taylor Blake was prepared under the direction of the Master’s Thesis Advisory Committee. It is accepted by the committee members in partial fulfillment of the requirements for the degree Master of Science in the Byrdine F. Lewis School of Nursing and Health Professions, Georgia State University. The Master’s Thesis Advisory Committee, as representatives of the faculty, certify that this thesis has met all standards of excellence and scholarship as determined by the faculty.
_____________________ ________________________
Dan Benardot, PhD, RD, LD, FACSM Anita M. Nucci, PhD, RD, LD
Committee Chair Committee Member
______________________ Megan McCrory, PhD Committee Member
AUTHOR’S STATEMENT
In presenting this thesis as a partial fulfillment of the requirements for the advanced degree from Georgia State University, I agree that the library of Georgia State University shall make it available for inspection and circulation in accordance with its regulations governing materials of this type. I agree that permission to quote, to copy from, or to publish this thesis may be granted by the professor under whose direction it was written, by the Byrdine F. Lewis School of Nursing and Health Professions director of graduate studies and research, or by me. Such quoting, copying, or publishing must be solely for scholarly purposes and will not involve potential financial gain. It is understood that any copying from or publication of this thesis, which involves potential financial gain will not be allowed without my written permission.
NOTICE TO BORROWERS
All theses deposited in the Georgia State University library must be used in accordance with the stipulations prescribed by the author in the preceding statement. The author of this thesis is:
Taylor Blake 1365 Morrow Drive Bethlehem, GA 30620
The director of this thesis is:
Dan Benardot, PhD, RD, LD, FACSM Professor
Department of Nutrition
Byrdine F. Lewis School of Nursing and Health Professions Georgia State University
RESUME
Taylor E.M. Blake, DTR
1365 Morrow Drive Bethlehem, GA 30620 Email: [email protected] EDUCATION2014-2015 Georgia State University Atlanta, GA Masters of Science, Nutrition
Coordinated Program, Dietetic Intern
2009-2012 Georgia State University Atlanta, GA
Bachelor of Science, Nutrition
Didactic Program in Dietetics (DPD) Verification
2007- 2009 Georgia Perimeter College, Dunwoody, GA
Pre-requisite Coursework for DPD Program
2005-2006 Le Cordon Bleu College of Culinary Arts, Tucker, GA
Associates of Occupational Science Degree
WORK HISTORY
2013 - 2014 McDonald’s, Akron Ohio
Shift Supervisor
2011 – 2013 Atlanta Weightloss, LLC DBA Thin and Healthy’s Total Solution, Stone Mountain, GA
Owner-Operator
2007 – 2009 Dunwoody Country Club, Dunwoody, GA
Cook- Banquets, Mixed Grille, Pool Snack Bar
2006 The Biltmore Estate, Asheville, NC
Culinary Intern- Stable Café and Inn on Biltmore Estate
2005-2006 Starbucks Coffee Company, Kennesaw, GA
Barista
2004-2005 Wendy’s International, Woodstock, GA
Shift Supervisor
CERTIFICATIONS
Dietetic Technician, Registered (2012-2018) ServSafe (2013 -2019)
American Heart Association Basic Life Support
AWARDS
AP Scholar (2003) Honor Roll (2005-2006) Dean’s List (2010, 2011, 2012) President’s List (2006-2010, 2011)
ORGANIZATIONS
Academy of Nutrition and Dietetics Member
Georgia Academy of Nutrition and Dietetics Member
Title: Relationship of Energy Balance and Body Composition in Elite Female Gymnasts
Background: Studies suggest that athletes participating in weight-specific and
appearance-based sports, including gymnasts, are at risk for developing negative energy balance both during and at the end of the day. A prolonged state of negative energy balance has been associated with lower fat-free mass, higher fat mass, and lower bone mineral density. Energy balance is defined as energy in minus energy out, and has been viewed in the past as a static, 24-hour system that begins anew each day. This study examined the relationship of energy balance and body composition (lean body mass, fat mass, body fat percent) and bone mineral density. Studies evaluating the relationship between energy balance and body composition have been conducted in the past, but few have taken into consideration hourly energy balance and the effects of multiple time periods of energy deficit of < -400kcal.
Purpose: The purpose of this study was to assess the relationship between energy balance and body composition in female gymnasts.
Methods: This study utilized a secondary analysis of existing data, and included 23 female elite, nationally ranked, gymnasts. Participants were included in this analysis if they had completed three-day food and activity records and had full body DEXA scans. The food and activity records were analyzed using NutriTiming®, which predicts RMR via the Harris-Benedict equation, uses a MET-based relative intensity activity scale, and accesses the USDA Nutrient Database for Standard Reference, Release 26. NutriTiming provides both 24-hour and hourly energy balance values. Original data were collected as part of a study conducted at Georgia State University in 1993 that had received IRB-approval. The current study also received IRB IRB-approval.
Results: Subject characteristics (mean ± SD) were: age (15.1 ±1. 58 years), height (151.3 ±7.7cm), and weight (45.63 ±8. 31kg). Average energy intake during the three days examined was 1375 kcal (±405), and the average predicted energy expenditure was 2430 kcal (± 298), for an energy balance of -1053 (± -438). Subjects were in a negative energy balance state the majority of the days analyzed. Spearman rho analysis found significant negative correlations between kcal consumed per kg bodyweight and body fat percent (r= 0.603, p=0.002), bone mineral density (r= 0.577, p=0.004), fat mass (r= 0.556, p=0.006), lean body mass (r= 0.466, p=0.025), lean body to height ratio (r= -0.466, p=0.025), and weight (r=-0.633, p=0.001). A significant amount of variance (R2=
0.435; SEE= ±0.05919, p=0.001) was explained in bone mineral density (dependent variable) with fat mass (independent variable).
RELATIONSHIP OF ENERGY BALANCE AND BODY COMPOSITION IN ELITE FEMALE GYMNASTS
by Taylor Blake
A Thesis
Presented in Partial Fulfillment of Requirements for the Degree of
Master of Science in Health Sciences
The Byrdine F. Lewis School of Nursing and Health Professions
Department of Nutrition
Georgia State University
Atlanta, Georgia 2015
THESIS COMMITTEE
Dan Benardot, PhD, RD, LD, FACSM (Chair)
Anita Nucci, PhD, MPH, RD, LD
ii
ACKNOWLEDGMENTS
I would like to thank the following people, without whom, this thesis would have never been completed:
Dr. Dan Benardot- for your guidance, patience and inability to accept anything but the best from your students.
Dr. Anita Nucci- for your help both on this thesis and with the bumps in the road.
Dr. Megan McCrory- for your valued input, edits and suggestions during this process.
My family; Cameron, Victor and Damien- whom I have sacrificed valuable time with in
iii
TABLE OF CONTENTS
List of Tables... iv
Abbreviations ... v
Chapter I. INTRODUCTION... 1
II. LITERATURE REVIEW ... 4
Relative and Daily Energy Balance ... 5
Eating Disorders and Athletes ... 7
Within-Day Energy Balance ... 11
Body Composition ... 11
Bone Mineral Density ... 16
Growth ... 19
Summary ... 22
III. METHODS………. . 25
IV. RESULTS……… .... 29
V. DISCUSSION AND CONCLUSIONS……….. . 40
iv
LIST OF TABLES
Table Page
1. Descriptive Statistics of Elite Female Gymnasts ... 29
2. Energy Balance Descriptive Statistics of Elite Female Gymnasts……….30
3. ANOVA and Bonferroni Post Hoc Test Results of Z-score Weight (kg) and Kcal per
Kg Body Weight……….31
4. ANOVA and Bonferroni Post Hoc Test Results of Z-score Lean Body Mass (kg) and
Kcal per Kg Body Weight………...32
5. ANOVA and Bonferroni Post Hoc Test Results of Z-score Lean Body
Mass/Height and Kcal per Kg Body Weight ... 32
6. ANOVA and Bonferroni Post Hoc Test Results of Z-score Fat Mass (kg)
and Kcal per Kg Body Weight ... 33
7. ANOVA and Bonferroni Post Hoc Test Results of Z-score Body Fat Percent
and Kcal per Kg Body Weight……… ... 34
8. ANOVA and Bonferroni Post Hoc Test Results of Z-score Bone Mineral
Density (g/cm2) and Kcal per Kg Body Weight ... 35
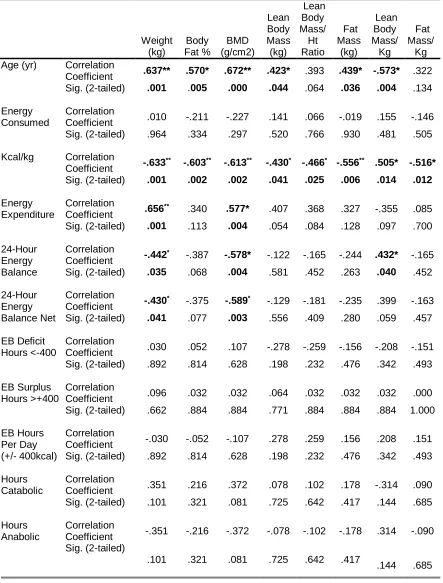
9. Spearman Rho Correlations Hypothesis Testing of Energy Balance
Variables and Body Composition for Elite Female Gymnasts ... 36
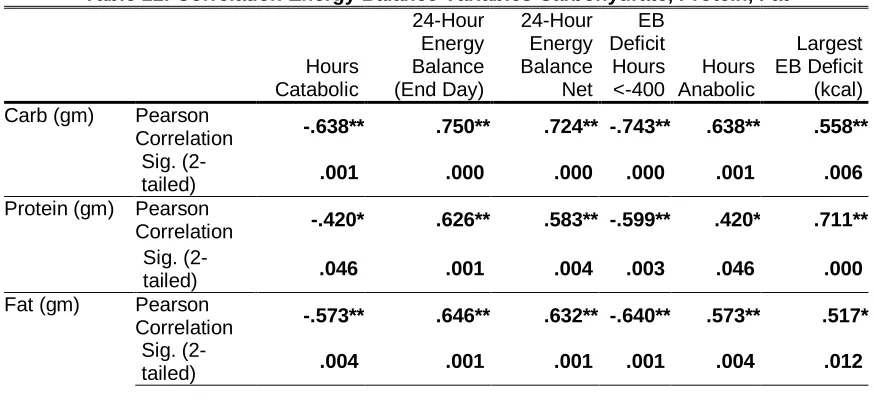
10.Carbohydrate, Protein, Fat and Calcium Descriptive Statistics of Elite
Female Gymnasts ... 37
11.Correlation Energy Balance and Carbohydrate, Protein, Fat and Calcium ... 37
Graph
v
ABBREVIATIONS
ANOVA Analysis of Variance
CHO Carbohydrate
NHANES National Health and Nutrition Examination Survey
RDA Recommended Daily Allowance
BMI Body Mass Index
LBM Lean Body Mass
LBM/kg Lean Body Mass per Kilogram Bodyweight
FFM Fat Free Mass
FM/kg Fat Mass per Kilogram Bodyweight
EDE-Q Eating Disorder Examination-Questionnaire
BMD Bone Mineral Density
BMD/kg Bone Mineral Density per Kilogram Bodyweight
BMC Bone Mineral Content
DEXA Dual-Energy X-Ray Absorptiometry
SPSS Statistical Package for the Social Science
FM Fat Mass
BF Body Fat Percent
EB Energy Balance
PRO Protein
Ca Calcium
DT Drive for Thinness
REE Resting Energy Expenditure
RMR Resting Metabolic Rate
ED Eating Disorder
DE Disordered Eating
MD Menstrual Dysfunction
AN Anorexia Nervosa
BN Bulimia Nervosa
EDNOS Eating Disorder Not Otherwise Specified
CLTEA Computerized Time-Line Energy Analysis
EAT-26 Eating Attitudes Test
TFEQ Three Factor Eating Questionnaire
1 CHAPTER I
Introduction
Studies suggest that athletes participating in weight-specific and
appearance-based sports, including gymnasts, are at risk for developing negative energy balance both
during and at the end of the day. It is common for gymnasts to initiate their sport at a
young age (between age 5 and 8 years), and they may be encouraged to sustain an
artificially small physique for which they may not be genetically predisposed
(Sundgot-Borgen et al. 2013; Sundgot-(Sundgot-Borgen & Garthe, 2011). The consequences associated with
a prolonged state of negative energy balance include developing a body composition with
lower fat-free mass, higher fat mass, and attaining lower bone mineral density.
Energy balance is defined as energy in minus energy out and has been viewed in
the past as a static, 24-hour system that begins anew each day. However, energy balance
is more dynamic. Timing and frequency of meals becomes important due to the action of
insulin on the body. Pre-prandial blood glucose levels can be seen within 2-3 hours after
a meal (American Diabetes Association, 2001). Excess insulin production, which can
occur when times between meals is delayed encourages fat synthesis (Benardot, 2007;
Cohn, et al. 1968). By evaluating within-day intake and expenditure, the effects on body
composition may be more apparent (Deutz, et al. 2000). Gymnasts with a history of
negative energy balance satisfy one third of the criteria established for the Female Athlete
2
density (Siatras & Mameletzi, 2014). The conditions of the Female Athlete Triad have
recently been expanded to include the physiological and psychological effects around
energy availability. This new framework is referred to as “Relative Energy Deficiency in
Sports (RED-S) (Benardot, 2013; Javed et al. 2013; Mountjoy et al. 2014). This study
examined the relationship of energy balance as a dynamic factor, assessing at within-day
energy balance, which may influence body composition (lean body mass, fat mass, body
fat percent) and bone mineral density.
Study Purpose
The purpose of this study was to determine if relationships exist between
within-day energy balance deficits and lean body mass, fat mass, body fat percent, and bone
mineral density in elite female gymnasts. Prior studies exist examining the relationship
between energy balance and body composition, however, this study sought to examine
the relationship of within-day energy balance and body composition.
Hypotheses
Based on past studies, we hypothesized that there will be statistically significant
relationships between within-day energy balance deficits and body composition and bone
mineral density. Our specific hypotheses include:
1. Hypothesis 1: Time periods of 3 hours or more spent in energy balance deficit
is associated with a lower lean body mass.
a. Null Hypothesis: Time periods of 3 hours or more spent in energy
balance deficit has no association with a lean body mass.
2. Hypothesis 2: Time periods of 3 hours or more spent in energy balance deficit
a. Null Hypothesis: Time periods of 3 hours or more spent in energy
balance deficit has no association with fat mass.
3. Hypothesis 3: Time periods of 3 hours or more spent in energy balance deficit
is associated with lower bone mineral density.
a. Null Hypothesis: Time periods of 3 hours or more spent in energy
balance deficit has no association with bone mineral density.
4. Hypothesis 4: 24-hour net energy deficits of more than 400 kcals will result in
a statistical difference between highest and lowest lean body mass Z-scores.
a. Null Hypothesis: 24-hour net energy deficits of more than 400 kcals
has no association with lean body mass Z-scores.
5. Hypothesis 5: 24-hour net energy deficits of more than 400 kcals will result in
a statistical difference between highest and lowest fat mass Z-scores.
a. Null Hypothesis: 24-hour net energy deficits of more than 400 kcals
4 CHAPTER II
Literature Review
Introduction
Artistic gymnastics, a specific type of gymnastics, involves high-impact loading,
acceleration, deceleration, pushing, pulling and acrobatics that are aesthetically pleasing.
Usually, those who compete at an elite level in gymnastics initiated the sport at a young
age (Siatras & Mameletzi, 2014). Gymnasts appear to be of high risk for energy
inadequacies and decreased bone mineral density fueled by dieting and over-training
strategies to achieve a thinner physique that would result in a reduced lean body mass and
increased fat mass; which would is contraindicated for performance (Siatras &
Mameletzi, 2014). Recommendations from coaches and judges to improve performance
and reduce weight, in an attempt to improve performance, may exacerbate this problem
(Sundgot-Borgen & Garthe, 2011). Female athletes, in general, demonstrate a higher
incidence of satisfying the criteria for the Female Athlete Triad due to the high incidence
of inadequate dietary intake (Gabel, 2006). This is, in part, fueled by weight-cutting to
enhance performance that may jeopardize menstrual and skeletal health. Female athletes
do not always compensate their energy expenditure by increasing dietary intake due to a
post-exercise decrease in appetite (Blundell & King, 1998; Loucks et al. 2011). The
purpose of this literature review is to examine factors regarding energy balance and
energy availability and the effects on body composition and bone mineral density to
Relative and Daily Energy Balance
Many athletes struggle to maintain the delicate balance between energy intake and
expenditure, and a failure to do so will result in suboptimal performance (Javed et al.
2013). Strength and performance are impaired when lean body mass is reduced due to a
lack of energy, often the result of rapid weight loss with energy restriction
(Sundgot-Borgen & Garthe, 2011). Performance can be enhanced with strategic food and fluid
intake, thereby furthering the need to ensure that weight-sensitive athletes are
maintaining proper energy balance (Benardot, 2007). Chronic instances of inadequate
energy intake decreases the ability for muscle mass to increase and both lean and fat
mass will decrease. Athletes should be educated on the importance of adhering to the
recommendations for optimum health and physical activity. This includes a high amount
of complex CHO (approximately 7-8g/kg per day), moderate protein intake (1.5-1.8g/kg
per day) and a relatively low intake of dietary fat (2g/kg per day) (Benardot, 2007;
Mountjoy, 2014).
A study assessing the dietary habits of the United States national women’s artistic
gymnastics team (n=29) (Jonnalagadda et al. 1998) found that the gymnasts were
consuming less than was expected when compared to the NHANES III data for girls of
the same age groups. All participants were actively training during the study. Their
mean age was 15.1 ± 1.3 years (range 12-18 years), mean height was 151.4 ± 7.1cm,
and mean weight was 48.8 ± 8.3kg. Daily baseline energy requirements for the
gymnasts were estimated using the Harris-Benedict equation with an activity factor of
1.6 (moderate activity). Dietary intake was assessed by three-day food records that
6
beverages consumed were given to each gymnast with pictures and common household
measurements to determine portion size. They were also asked to record any
medications or supplements they were taking. Nourish-Check®, a computerized
database with access to the USDA Nutrient Database, was used as a standard for
nutrient intake. For analysis, the gymnasts were divided into two groups based on age
for RDA comparison (11-14 years and 15-18 years). It was determined that the
gymnasts were consuming 34.4g/kg body weight, approximately 20% fewer calories
than the recommended 40-47kcal/kg body weight for females age 11-18, which was a
significant difference (p=0.047). Forty-eight percent of the participants reported that
they were on self-prescribed diets, and their energy deficits were more severe (-635
kcal/d) than those who were non-dieters (-218 kcal/d). In addition, for those who were
on self-prescribed diets, their energy intake from fat was less than non-dieters, (25g/day
vs. 39g/day, p<0.017). As with other studies using self-reports of dietary intake, it is
unclear if the estimated intakes were underreported.
A study involving rhythmic gymnasts recruited from athletic clubs across Greece in
2011 hypothesized that rhythmic female gymnasts (n=40) would exhibit negative energy
balance during an 8-week preseason training period as compared to age-matched
sedentary controls (n=40) (Michopoulou et al. 2011). Participants in the study were
evaluated on age, anthropometrics, Tanner score, maximal oxygen consumption
(VO2max) and x-rays of the hand/wrist (to determine skeletal age). The participants and
their parents were taught how to complete the 6-day diet/physical activity record
(Monday through Saturday only) needed for the study. Daily energy requirement and
(rest, moderate, intense and very intense), respectively. Rhythmic gymnasts demonstrated
lower body mass, BMI, body fat percent, and higher VO2max compared to controls
(p<0.05). There was no significant difference in energy intake between the groups.
However, the gymnasts had significantly higher CHO consumption (p<0.05) and lower
fat intake (p<0.05). Estimated energy expenditure was higher in gymnasts (p<0.05).
Overall, when age-matched, the gymnasts in the study demonstrated a 233 kcal daily
deficit compared to controls, who demonstrated a 122 kcal daily energy surplus, which
was a significant difference between the groups (p<0.05). Again, energy intake and
expenditure can be underestimated or overestimated, a limitation of all studies that utilize
self-reports for food and activity logs.
Eating Disorders in Athletics
Energy balance is crucial for weight loss or gain, and the basic laws of energy
thermodynamics should be followed; meaning energy expenditure should exceed energy
intake if weight loss is the goal, and vice versa if weight gain is the athlete’s goal,
provided that energy availability (dietary energy intake minus the energy expended) is
not compromised (Mountjoy et al. 2015). The drive to remain thin can cause an energy
deficit that leads to menstrual disturbances, as demonstrated by a study conducted using a
large sample of exercising women, who exercised two or more hours per week (N=137)
(Gibbs et al. 2011). In this study, the authors wanted to examine the association between
high drive of thinness (DT) and energy deficiency and compare the menstrual status of
exercising women with high vs. normal DT. A high DT was defined by the authors as a
score of ≥ 7 on the Eating Disorder Index Inventory (EDI-2). Exercising women aged
8
(n=27) or normal DT (n=90). Anthropometric data, age, menstrual status, psychometric
measurements of eating attitudes and behavior, three-day nutritional logs and exercise
regimen (2 or more hours per week) were evaluated. Energy status was defined using by
measuring REE (laboratory-derived) and pREE to identify those who had experienced
energetic adaptations to energy deficiency. REE was compared to the predicted REE
(pREE) calculated using the Harris-Benedict equation. Chi-square analysis showed
significantly more high DT women were energy deficient, defined as an REE:pREE less
than 0.90, compared to those with normal DT (p=0.024). High DT was significantly
associated with higher cognitive restraint to eating (p<0.001) and higher body
dissatisfaction (p=0.009) compared to normal DT. Regarding menstrual status, 73.9% of
women with high DT had either amenorrhea or oligomenorrhea compared to 38.0% of
normal DT women (p=0.002). This study confirms that a high DT, as can also be seen
within the gymnast population, is associated with cognitive dietary restraint, energy
deficiency and menstrual disturbances.
The prevalence of disordered eating (DE) behavior and an eating disorder (ED) in
the elite female athlete (n=186) compared to non-athlete controls in the same age group
(n=145) from the general public was the aim of a study conducted in Norway (Torstveit
et al. 2007). Athletes were further categorized as non-lean or lean-sport athlete. Leanness
athletes were defined as those participating in sports where leanness and/or a specific
body weight were considered important for performance. In this study, the investigators
sought to determine characteristics of elite female athletes with EDs and test for
predictability of risk, determine the percentage of female athletes and controls with DE
Participants were considered to have indication of DE behavior if they: self-reported as
having and ED, were underweight (BMI <18.5kg/m2), the use of pathogenic weight
control methods (PWCM), and had high scores on two subscales of the Eating Disorder
Index Drive for Thinness (EDI-DT) and Body Dissatisfaction (EDI-BD). The scores that
were used for DE in this study were an EDI-DT ≥15 and EDI-BD ≥14. Compared to
controls, the prevalence of clinical EDs, determined by the Eating Disorder Examination
(EDE) (Cooper et al. 1989) and DE was significantly higher in the leanness athlete
groups by 46.7% (n=90, p<0.001). Three predictive models were used to determine risk
for EDs. A total of 46.2% of athletes and 51.7% of the controls reported one or more of
the criteria used for DE. Model 1 was based solely on the variable of self-reported EDs,
one of the variables previously discussed to determine DE behavior, and raised the
probability of an ED in all participating athletes, but not controls (n=186, p<0.01,
OR=3.71, CI=1.44-9.55). Model 2 included pathogenic weight control measures, BMI,
body dissatisfaction, and DT as predictive variables. The second model was determined
to be a poor predictor in both athletes and controls. Model 3 expanded on the variables
used in Model 2 by adding menstrual dysfunction (MD) and stress fractures. This raised
the predictability and probability of EDs in leanness sports significantly (p<0.05). The
author’s determined that the addition of MD was an important predictor of the risk for
ED in leanness sports despite stress fractures also having been added to Model 3.
Anderson and Pettie (2012) surveyed 400 NCAA Division I female athletes from
26 universities who participated in either gymnastics (n=280) or swimming/diving
(n=134) to examine the prevalence of clinical and subclinical EDs as well as the extent of
10
amongst this population (Anderson & Petrie, 2012). They used the 50-item Questionnaire
for Eating Disorder Diagnoses by Mintz et al. (1997) to determine which of the following
categories would best fit each participant: Category 1 included EDs (AN, BN, EDNOS),
Category 2 included subclinical EDs and Category 3 were asymptomatic. It was found
that a greater number of gymnasts used dieting or fasting and exercise to lose weight.
However, 65% of the gymnasts surveyed and 73% of the swimmers/divers were found to
be asymptomatic of clinical or subclinical EDs (n=280). They found that 108 participants
were classified as having a subclinical ED (28.9% gymnasts, 6.1% swimmers/divers) and
26 could be diagnosed with a clinical ED (6.1% gymnasts, 6.7% swimmers/divers). It is
unclear if those who were diagnosable as clinical ED were among the 10 who indicated
they were previously diagnosed as having an ED before the study was conducted.
The dynamic relationship between energy intake and expenditure should be
considered to control optimally the hormones that influence anabolic and catabolic states.
The timing of food intake, therefore, should also be considered as an important factor for
helping athletes achieve the physiques that they desire, while reducing the risks of
compromising performance (Benardot 2013; Mountjoy et al. 2014). Strategic eating
habits, such as consuming meals with the appropriate amount of energy and substrates
(carbohydrates, fats, and protein) every two to three hours, can help by providing
adequate energy for improved performance, increased lean muscle mass, decreased body
fat, and recovery from exercise. A lower weight on the scale may not be the answer that
Within-Day Energy Balance
In the event an athlete desires to reduce body fat to emphasize leanness for
aesthetic reasons, it should be ensured that adequate energy availability be taken into
consideration as well (Mountjoy et al. 2014). This is important to gymnastics because
higher body fat percentages are associated with energy balance deficits that exceed 300
kcal (Deutz et al. 2000). In this study, 42 gymnasts (mean age 15.5y) and 20 runners
(mean age =26.6y) whom were either nationally ranked or on a national team, were
evaluated on energy balance and body composition. Participants’ energy intake and
expenditure were analyzed by Computerized Timeline Energy Assessment (CTLEA),
which simultaneously measures energy intake and expenditure, and has been validated
for gymnasts (Benardot, 1996). Average energy deficit was 784kcal over 24 hours. The
average amount of time spent in energy deficits larger than 300kcal was 7.60 ±6.36
hours. Body fat percentage measured by both DEXA (r=0.484, p=0.01) and skinfold
(r=0.508, p=0.00) was significantly higher for artistic gymnasts in energy deficits
≥300kcal. A possible consequence of allowing the body to become energy deficient is
that blood glucose decreases below homeostatic levels approximately 2-3 hours after the
last meal was consumed. This can lead to a hyperinsulinemic response at the next meal,
leading to increases in fat synthesis (Benardot, 2013).
Body Composition
Previous studies have shown that persistent negative energy balance will result in
reduced lean body mass and proportionally increased fat mass (Benardot, 2007, 2013;
12
performance enhancement, this does not mean that an athlete should reduce energy
consumption to lose weight (Benardot, 2013).
In 2010 a study found that in professional ballet dancers, an energetic efficiency was
associated with prolonged deficits in energy availability compared to age-matched
controls (Doyle-Lucas et al. 2010). In this study, 15 professional, elite female ballet
dancers, who were training for 27 or more hours per week, were age matched with 15
non-dancers who were sedentary or recreationally active (age 18-35 years). The purposes
of the study were to describe the physical and behavior differences between the groups,
RMR differences (observed and predicted) and to identify associations between the
female athlete triad and energy efficiency based on the calculated RMR values.
Researchers gathered data regarding self-reported four-day food records, physical activity
logs, menstrual history, body composition, DEXA scans, RMR (using Cunningham,
Mifflin St. Jeor, and Harris Benedict equations), and psychometric measures of eating
behavior using the EAT-26 and the Three Factor Eating Questionnaire (TFEQ). Lab tests
were performed during the follicular stage of ovulation (days 1-10). It should be noted,
however, that 6 of the 15 dancers reported irregular menses. The ballet dancers were
significantly lighter, had significantly lower body fat percentages, and were significantly
more active as compared to controls. The dancers also showed a higher level of dietary
restraint and higher EAT-26 scores and a higher prevalence of menstrual dysfunction
(amenorrhea and oligomenorrhea), but the differences between groups were not
significant. Dancers showed a significantly later age for onset of menses (p≤0.01). RMR
for the dancers (1367±27) was significantly lower than the controls (1454±34; p≤ 0.05).
±0.6 kcal/kg FFM/day) than controls (33.1 ±0.8 kcal/kg FFM/day; p≤0.05). FFM was
higher in the group of dancers with menstrual dysfunction (n=6; 45.6 kg FFM) compared
to eumenorrheic dancers (44.0 kg) and controls (43.4 kg), to which the authors attributed
to their body’s adaptation to use the fewest amount of calories to sustain a kilogram of
bodyweight, thus they had the lowest calorie requirement despite having the greatest
amount of FFM.
In a recent observational study involving young elite gymnasts from Brazil (Joao &
Filho, 2015), 46 elite artistic gymnasts of both sexes were evaluated (males=21, females
=25) for somatotype and body composition. Somatotype was determined by Heath and
Carter’s anthropometric somatotype model. Somatotyping describes the morphology of a
subject. It is the quantification of form and composition of the body using ten
anthropometric dimensions. Somatotype is expressed by three numbers, which represent
endomorph (relative fatness), ectomorph (relative leanness) or mesomorph (relative
skeletomuscular robustness). It is subject to change when a person’s body changes due to
growth, exercise, nutrition, and aging (Carter, 2002; Joao & Filho, 2015). Body
composition was determined using bioelectrical impedance using an InBody R20 to
measure skeletal muscle mass, fat mass, fat-free mass and body fat percent. Descriptive
statistics were used to determine the dominant somatotypes. Thirty-three percent of the
male gymnasts were balanced mesomorphs, meaning they were dominantly mesomorphic
with similar degrees of endomorphy and ectomorphy. The authors determined this to be
the dominant somatotype for the male gymnasts, despite a higher percentage (48%)
falling into the category of ectomorph-mesomorph, meaning that they were very thin with
14
females, 56% were considered to be “ectomorph-mesomorphs” with a mean body fat
percentage of 15.84% ±3.79. Somatotype has been seen to associate with the gymnasts’
performance scores during competition, which is discussed below.
The desire to remain small and light to improve performance is based on the theory
that objects that are smaller and lighter move faster. However, the ability to remain small
and light can prove difficult to maintain once the young female reaches puberty and her
body begins to change from that of a child to a developing woman. These changes
suggest that a higher percentage of fat mass will acquired as breasts develop, hips widen
and the body prepares for adulthood; this results in a fear of puberty in some of these
athletes (Blundell & King, 1998; Martin et al. 2008). In 1999, a study was conducted on
168 elite, female, artistic gymnasts (mean age 16.5 ± 1.8y) participating in the 1987
World Championships to identify anthropometric variables that correlate with
performance scores (Claessens et al. 1999). Anthropometrics, skinfold, somatotype and
skeletal maturity were examined. Performance scores were recorded for four events:
balance beam, floor exercise, vault and uneven bars. Both individual event and composite
event scores were recorded. Moderately high, negative correlations were found between
skinfolds and the classification of endomorphy when compared to performance scores
(p<0.001). Scores varied between -0.38 (biceps skin fold and balance beam score,
p≤0.01) and -0.60 (endomorphy and total score, p≤0.01). A positive correlation +0.23
was seen between ectomorphy and score on uneven bars (p ≤0.01). Stepwise multiple
regression analysis was used to explain variance. Upon analyzing the data, 32% - 46% of
score variance could be explained by anthropometrics and age. Many correlations
Age was often correlated positively with performance scores, but was not strong enough
to influence the effects of endomorphic somatotype on performance scores. This presents
a problem for female gymnasts, as degree of fatness increases with age.
The scoring system for gymnastics can further promote, though inadvertently, this
drive for thinness as studies have shown that the degree of fatness is negatively correlated
with performance scores (Joao & Filho, 2015; Siatras & Mameletzi, 2014). It should also
be noted that male gymnasts are not immune from the desire to maintain a low body
weight. A case study about an injured 2012 Chinese Olympic gymnast (Chen et al. 2013)
demonstrated the positive and successful effects of a more balanced diet. Over the course
of six months, an intervention by an interdisciplinary team worked to help this gymnast
heal from his injuries and correct energy deficits. The gymnast’s original diet to
intervention allowed for 30% CHO, 20% protein and 50% fat. He originally weighed
62.2kg with 5.845kg body fat. Dietary intervention changed his macronutrients to better
suit an elite athlete: CHO was increased to 70%, Protein ranged from 20% to 23% total
calories, and fat was decreased to 10%. He was also instructed to consume low Glycemic
Index foods every 2-3 hours to achieve overall energy balance. Over the period of
intervention, the gymnast was educated on the differences between total body weight and
fat mass to help with the psychological stress that he encountered by being injured and
the changes to his diet. Upon conclusion, and following the diet regimen, his weight
decreased to 58.2kg (-4.0kg, -6.87%) and body fat decreased to 3.5kg (-2.3kg, -66.3%).
He competed in the 2012 Olympic Games and “achieved world class results”, which
16
achieve an improved energy balance. This type of education should be explored and
implemented within other teams in this sport.
Bone Density
Bone is composed primarily of type 1 collagen and contains 99% of the total
calcium and phosphate in the body (Olyai & Thaker, 2009). It consists of cell types called
osteoclasts, osteoblasts and osteocytes, which work together to form, mineralize and
resorb bone. Under the presence of normal menses, mechanical loading brought on by
exercise, can result in higher site-specific bone mass. However, studies have also
determined that the effect of mechanical loading cannot offset the effects of hormonal
deficiency caused by energy deficiency (Olyai & Thaker, 2009; Siatras & Mameletzi,
2014). Energy deficits that occur in an exercising gymnast may lead to bone
demineralization due to a possible elevation in cortisol production that occurs from lack
of carbohydrate consumption prior to exercise (Benardot, 2013). Risk of impaired bone
health among female athletes rises when energy deficits begin to affect the menstrual
cycle for a long enough period that estrogen and progesterone production becomes
altered (Jürimäe & Jürimäe, 2008). Progesterone production is increased during the luteal
phases of the menstrual cycle, and when this phase is shortened, progesterone production
can be decreased, which may cause decreased cortical bone formation (Bennell et al.
1999). Typically, amenorrheic athletes who lack menses for a period of six months or
more are suggested to undergo dual-energy X-ray absorptiometry (DEXA) to measure
bone mineral density (Mountjoy et al. 2014). Low bone mineral density in this population
is defined as a Z-score of -1.0 and -2.0 SD combined with fracture risks (nutritional
calcium becomes a concern when an energy deficit is encountered, as a lowered calcium
intake can be a consequence of low energy intake. Low calcium intake is associated with
an increased risk of stress fractures (Benardot, 2007). Hypoestrogenism causes calcium to
be excreted from bone and impairs bone mineralization in the presence of energy deficits
(Bennell et al. 1999).
Body composition is related to bone mineral density. However, bone mineral
density may be site-specific in premenarcheal girls. A study conducted with 7-8 year old
rhythmic gymnasts (n=46) and age-matched controls (n=43) sought to determine if there
was a relationship between anthropometric variables, body composition and bone mineral
density (Parm et al. 2011). The researchers measured body fat mass, lean mass and BMD
and bone mineral content (BMC) using DEXA. Body fat percent was also measured by
skinfold calipers. Using multiple stepwise regression, they found that height (r=0.687,
p<0.01), body mass (r=0.522, p<0.01) and fat free mass (r=0.568, p<0.01) were
significantly correlated with BMC in the L2-L4 spine in controls. However, in the
gymnasts, the femoral neck BMC measurements were negatively correlated with body
height (r= -0.391, p<0.01), body mass (r= -0.306, p<0.05), and fat free mass (r= -0.399,
p<0.01). There were no significant correlations between BMD and BMC in the gymnasts.
There were no differences between the gymnasts and controls in height, body mass, BMI
or fat free mass. Possibly due to exercise-induced mechanical loading, significantly
higher BMD and BMC in L2-L4 and femoral neck was observed in the gymnasts. The
authors concluded that the ties between body composition and BMD status were weak for
18
Similar results have been seen in other studies that have sought to examine
compromised BMD in this population. In a study that was conducted by Robinson et al.
(1990), 21 collegiate female gymnasts, 20 collegiate runners and 19 non-athletic college
women controls were evaluated to determine if there was a relationship between BMD
and menstrual status (Robinson et al. 1995). Gymnasts and runners were selected due to
the different bone-loading mechanisms that are unique to both sports. Runners and
gymnasts had similar body fat percent, and both groups were significantly leaner than the
controls (p<0.001). Gymnasts had higher LBM/height2 than runners (p=0.001) and
greater muscle strength (p<0.05), but significantly later age for time of menarche
(p<0.05). Controls were eumenorrheic, while the 30% of the runners and 47% of the
gymnasts exhibited menstrual dysfunction. Three runners were amenorrheic, and three
were oligomenorrheic. Among the gymnasts, 6 were amenorrheic (4 were primary
amenorrheic) and 4 were oligomenorrheic. Lumbar spine BMD was significantly lower in
the runners than in the gymnasts in the femoral neck (p=0.001) and whole body (p<0.01).
A significantly higher BMD was seen in gymnasts compared to controls even after the
values were normalized for body weight. The authors concluded that the loading that
occurs during the explosive movements of the gymnasts possibly aided in maintaining
their BMD despite the higher incidence of MD compared to controls.
A study conducted by Barrack et al. (2008), aimed to determine if there was a link
between dietary restraint using Eating Disorder Examination-Questionnaire (EDE-Q) sub
scores to assess DE, pathologic behavior, MD and low BMD (Barrack, Rauh, Barkai, &
Nichols, 2008). They recruited 93 female high school cross-country runners aged 13-18
in high school sports. Those runners who demonstrated a higher dietary restraint (n=5)
had a significantly lower BMD (p<0.001). It was also found that those runners with
higher dietary restraint had lower lumbar spine and total body BMD than the runners who
showed higher weight or shape concerns (n=13) (p<0.05). The authors discussed that in
this study, BMD may have been compromised by low energy availability due to a
possible elevation in urinary and salivary cortisol concentration, which has been
demonstrated in other studies. Cortisol has catabolic effects on bone and is present with
energy deficiency (McLean et al. 2001). This study did note that within this population of
athletes examined, menstrual irregularity was not associated with low BMD.
Growth
Energy balance is critical for a young person during times of growth, particularly
puberty. A series of studies published between 2001 and 2005 sought to obtain
information on the impact gymnastics training and competition had on height velocity
information and skeletal maturation in rhythmic gymnasts (Georgopoulos et al. 2001) and
growth (Georgopoulos et al. 2002) and pubertal development (Theodoropoulou et al.
2005) in rhythmic and artistic gymnasts. Height, growth and pubertal development can be
altered by the stresses incurred by the intense physical training necessary. Georgopoulos
et al. (2001) focused on height velocity included 104 elite, rhythmic gymnasts aged 12-23
years. They were evaluated twice over a span of one year (±3 months). Eighteen were
evaluated yearly for a 2-year period, and 9 were reevaluated over a period of 3 years.
Anthropometric data were collected by a physician, and skeletal maturation was
evaluated via x-ray of the left hand and wrist. Body composition was predicted by Futrex
20
infrared analysis. Training intensity, number of competitions and family data regarding
parental and maternal heights data were self-reported by questionnaire completed by the
gymnasts. Target height for the gymnasts was calculated based on the equation TH=
(father’s height (cm) -13 + mother’s height (cm))/2. For the group of gymnasts who had
at least one annual reevaluation (n=72), there was a delay in skeletal maturation
compared with chronological age of 1.8 year, which was statistically significant (r=
0.730, P <0.001). Rhythmic gymnasts were taller than average height for age, but lighter.
Height velocity SD score was higher for each age group, and was higher than 50th
percentile for all age groups. Actual height was positively correlated with target height
SD score (p= 0.02). Regression analysis demonstrated that weight SD score and number
of competitions positively influenced actual height (p<0.001 and p=0.018, respectively).
However, weight SD score was negatively influenced by BMI and body fat (p<0.001 and
p= 0.029, respectively). Predicted height SD score was positively correlated to the
difference between chronological age and bone age (P=0.05). The data suggest that
catch-up growth is possible, but is a slow and late process as it is cocatch-upled with a delay in
puberty. However, the authors concluded that there was sufficient time for skeletal bone
to mature. The positive correlations in this study denoted that careful monitoring of
energy balance and adequate nutritional intake were part of the training for the gymnasts
who were studied.
In a similar study by Georgopoulos et al. (2002), 129 rhythmic gymnasts and 142
artistic gymnasts were evaluated to compare somatometric data to determine if the impact
of gymnastics training on growth (Georgopoulos et al. 2002). Data collection methods
The age distribution was 11-23yr both the rhythmic gymnasts and artistic gymnasts. As in
the previous study, rhythmic gymnasts were taller and leaner than average for age. The
artistic gymnasts were below the 50th percentile for height, but also below the 50th
percentile for target height SD score, the same as the rhythmic gymnasts. Both groups of
gymnasts followed the same pubertal growth pattern, however, artistic gymnasts
presented pubarche later than rhythmic gymnasts. As in the previous study, regression
analysis demonstrated that actual height SD score was influenced positively by weight
SD for rhythmic gymnasts (p <0.001) and for artistic gymnasts (p< 0.001). BMI
negatively influenced target height for artistic gymnasts (b= -0.81, t= -12.38, p<0.001).
This study found that the intensive training for rhythmic gymnasts preserved, and in some
cases exceeded, the genetic predispositions for growth. However, they observed a
deterioration of growth potential in artistic gymnasts; which is possibly due to the
selection criteria for artistic gymnasts (short-limbed for mechanical advantage and lower
degree of fatness for performance scores).
The final study in the series evaluating rhythmic and artistic gymnasts aimed to
evaluate differences, if any, existed between the pubertal development of either type of
gymnast (Theodoropoulou et al. 2005). This study was cross-sectional and included 423
elite rhythmic gymnasts and 427 elite artistic gymnasts; aged 11-23. The clinical
evaluation was the same protocol as the prior two studies discussed by Georgopoulos, et
al. (2001; 2002). A significant delay in skeletal maturation was found in both groups, but
it was more pronounced for artistic gymnasts than rhythmic gymnasts (p=0.01). Breast
development was the same for both groups according to Tanner stages according to bone
22
onset of both maternal and untrained-sisters’ menarche. In artistic gymnasts, menarche
was influenced by pubic hair development, bone age, and body fat; in rhythmic gymnasts
menarche was influenced by onset of pubic hair and bone age; as determined by multiple
regression analysis. The authors did note, however, that despite the delay in pubertal
progression, both rhythmic and artistic gymnasts did achieve puberty. Pubertal
development was shifted to a later age, and was noted to be mainly influenced by low
body weight. Breast development and menarche are related to estrogen, as opposed to
pubarche, which is influenced by adrenal androgen production. These hormones are both
heavily influenced by female adipose tissue, as it serves as an extragonadal source of
estrogens and converting androgens to estrogens (Perel & Killinger, 1979). It should be
noted that the mothers of the artistic gymnasts had significantly later menarche than those
mothers of the rhythmic gymnasts. Therefore, genetics in combination with negative
energy balance may have contributed to delayed menarche in the artistic gymnasts in this
study.
Summary and Conclusion
Energy balance and availability is a growing area of the research and has been
shown to have implications in a sort of “trickle-down” manner. The flow appears to be
low energy availability leads to disruptions in body composition and menstrual function,
possibly simultaneously. The alterations in available energy stores then affects bone
health in time due to both increases in cortisol production due to low energy stores
(Barrack et al. 2008), which is highly catabolic to bone mass. Additionally, the decrease
in available energy alters luteinizing hormone, follicle stimulating hormone, estradiol and
Many of the studies examined reported using DE and EDs as part of their
determining criteria. It would make sense that most of the subjects who exhibited signs of
DE and clinical EDs would have disruptions in menstrual status and energy availability.
The IOC has recently emphasized the importance of energy balance with their published
additions to the RED-S consensus that it is important to look at energy intake within
athletes as real-time availability, rather than a 24-hour energy balance (Margo Mountjoy
et al. 2015).
Body composition has been shown to be altered by low energy availability. If
energy is not adequate within the athlete, alternate sources of fuel from body tissues will
be accessed. Additionally, if more than three hours passes between meals, blood glucose
levels will decrease, leading to a hyperinsulinemia at the next eating opportunity. This
excess amount of insulin will result in higher fat storage. Fat oxidation for energy occurs
during normal, aerobic activity. Amino acids, when used for fuel in the presence of
inadequate energy availability, is the result of the breakdown of muscle. This breakdown
will, mathematically speaking, decrease the ratio of lean body mass (muscle) to fat mass,
thus creating a body composition that is higher in fat mass and lower in lean body mass.
Lean body mass is required for performance in sport and should be spared. By having
adequate energy availability, particularly with carbohydrate intake, the body will spare
muscle, leaving it to do the work associated with the sport.
This loading on the skeleton puts gravitational force on bone, forcing the body to
reinforce the areas where decreases in density would normally be seen (in the lumbar
24
et al. (2008) were shown to have a negative effect on BMD as a possible side-effect of
documented low energy availability.
The differing conclusions from the studies reviewed, demonstrates the need for
additional studies specifically evaluating effects of within-day low energy availability on
body composition and bone mineral density. Possibly assessing RED-S criteria as well,
at-risk athletes could be identified earlier and intervention given, as not all athletes who
are energy deficient are also amenorrheic and compromised BMD. As demonstrated by
the study conducted by Parm, et al. (2011) body composition did not relate significantly
with BMD or BMC. However, they did not evaluate the effect of energy availability as a
possible influence. It is unknown if the gymnasts in the study were of elite status, and
only mentioned that they practiced for 6-12 hours per week compared to controls who
were compulsory in exercise, amounting to approximately 45 minutes of activity per
week. Studies that provide more concrete and reliable results were those who were able
to look at the relationship between energy availability, body composition, bone mineral
density and menstrual history. Hormone levels (ghrelin, cortisol and insulin-like growth
factor-1) would be appropriate to include in future studies as male athletes, particularly
those in weight-specific sports, are not immune from the effects of low energy
availability. Findings from future research in this area could lead to a greater proportion
25 CHAPTER III
Methods
Subjects
This study included 23 female elite, nationally ranked, gymnasts who were
actively training at the time of data collection in 1993. The accessed data were collected
as part of a previous IRB-approved study conducted at Georgia State University in 1993.
Participants were included in this analysis if they had complete three-day, 24-hour food
intake and activity records and DEXA scans.
Study design
This was a cross-sectional study approved by Georgia State University’s
Institutional Review Board. This secondary analysis assessed the association between
energy intake, substrate intake (CHO, PRO, and fat), and time spent in periods of energy
deficit and lean body mass, fat mass, body fat percent and BMD.
Data Analysis
NutriTiming® (NutriTiming® LLC, Atlanta, GA), a computerized timeline
energy analysis software program, was used to analyze the three day average dietary
intake and energy expenditure for each gymnast. NutriTiming® predicts RMR via the
Harris-Benedict equation, uses a MET-based relative intensity activity scale, and accesses
the USDA Nutrient Database for Standard Reference, Release 26. NutriTiming®
provides both 24-hour and hourly energy balance values. The data were collected in the
early 1990s, therefore, some products listed in the records have since been discontinued.
26
29
modern-day product in appropriate serving sizes to match the caloric value of the original
item, if available, or approximated using the USDA Nutrient Database and were
manually entered. Energy expenditure data for NutriTiming® is determined by the
Physical Activity Guidelines Advisory Committee of 2008 and the National Research
Council Activity of 1989. Hourly energy expenditure is assessed in this program. Activity
factors range from “1” (resting, reclining) to “7” (exhaustive, to the point of collapse),
increasing in increments of 0.5. A NutriTiming® Activity Factor Scale of “4.0”
(Moderate activity; comfortable but sweating and faster heart rate) was assigned for all
training activities, in lieu of a daily activity factor. This value was assigned due to the
adaptation of the gymnasts to the nature of a typical gymnastics training session, which
includes rest periods between bouts of explosive movement. Output from NutriTiming®
provided the calculations for total calories consumed, 24-hour energy balance (Ending
Energy Balance), 24-hour energy balance Net (calories in less calories out), Hours
Catabolic, and relative amount of time spent in energy deficits totaling 400kcal or more
(EB Deficit Hours >400kcal).
Statistical analysis
Descriptive statistics were performed to determine mean and standard deviation
(SD) on body fat percentage, bone mineral density, fat mass, lean body mass, intake of
carbohydrate, fat, and protein, and energy balance variables listed above.
Hypotheses Testing
ANOVA tests were performed on total and relative time spent in a negative
energy balance of 400kcal and greater, body composition and bone mineral density in
variables (FM, BF, LBM, weight, weight for height (WH) and BMD) to segment the
subjects into subgroups for analysis to determine any significant differences between
energy balance variables (kcal consumed, kcal per kg bodyweight, energy expenditure,
24-hour energy balance, 24-hour energy balance net, energy balance deficit hours ≥-400
kcal, EB surplus hours ≥+400 kcal, Energy Balance hours per day, hours catabolic and
hours anabolic) and the standardized values for BF, LBM, Weight, WH, and BMD.
Independent samples T-tests were also performed to test each hypothesis.
Spearman Rho correlations were conducted to evaluate any significant
relationships between the energy balance variables and body composition variables listed
previously.
Additional Statistical Tests
As an additional step, correlation tests on the daily intake amounts of specific
energy substrates (CHO, PRO, fat and calcium), body composition, bone mineral density,
energy balance, and menstrual status were performed. Students t-tests were used to
determine if a significant difference existed between the standard recommended protein
intake for athletes (1.2-1.7g/kg), standard recommended carbohydrate intake (5g/kg) and
fat (30% of daily calories) and what was actually ingested of those substrates. Regression
analysis was used to predict if a significant amount of variance is explained in lean body
mass (dependent variable) from total time spent in energy deficit greater than 400 kcal
per 24 hour period; fat mass and total time spent in energy deficit greater than 400 kcal
per 24 hour period; as well as body fat percentage and total time spent in energy deficit
greater than 400 kcal per 24 hour period. We also used a regression analysis to determine
28
weight were used as a variable. All statistical analyses were performed using SPSS
(version 20.0, SPSS, Inc., Chicago, IL). A p-value of <0.05 were considered statistically
29 CHAPTER IV
Results
Subjects
All 23 subjects were included in this analysis. Table 1 shows the means and
standard deviations for the subjects. All the gymnasts included in the study were
teenagers, except one who was aged 12 years. They were all relatively small in stature
and lean. Bone mineral density varied amongst subjects; mean total BMD was 1.1g/cm2
[image:40.612.109.528.365.556.2]±0.07.
Table 1: Descriptive Statistics of Elite Female Gymnasts (N=23)
Mean Std. Deviation 95% Confidence Interval Lower Upper
Age (yr) 15.1 1.6 14.4 15.8
Height (cm) 151.3 7.7 148.0 154.6
Weight (kg) 45.6 8.3 42.0 49.2
Body Fat % 12.9 2.9 11.6 14.1
BMD (g/cm2) 1.1 0.07 1.1 1.2
LBM (kg) 40.9 12.2 35.6 46.2
Fat Mass (kg) 6.1 2.3 5.1 7.1
Energy Balance Descriptive Statistics
For all subjects, the average energy intake during the three days examined was
30
found to be in a catabolic state the majority of the time (Table 2). Only one gymnast had
[image:41.612.107.551.163.461.2]an energy balance surplus of >400kcal totaling 1 hour over the three day average.
Table 2: Energy Balance Descriptive Statistics of Elite Female Gymnasts (N=23)
Mean
Std. Deviation
95% Confidence Interval Lower Upper
Energy Consumed (kcal) 1375 405 1200 1800
Energy Consumed per Kg Bodyweight (kcal/kg) 31 10 26.7 35.4
Energy Expenditure (kcal) 2430 298 2301 2559
Hours spent +/-400 kcal 13 3.4 11.5 14.4
24-Hour Energy Balance Net (kcal) -1053 438 -1242 -864
EB Deficit Hours <-400 (kcal) 11 3.5 9.4 12.5
EB Surplus Hours >+400 (kcal) 0.04 0.21 -0.05 0.13
Hours Catabolic 20.8 2.6 19.8 22.0
Hours Anabolic 3.1 2.6 2.0 4.2
Largest EB Deficit (kcal) -1024 572 -1272 -777
Largest EB Surplus (kcal) 148 104 103 193
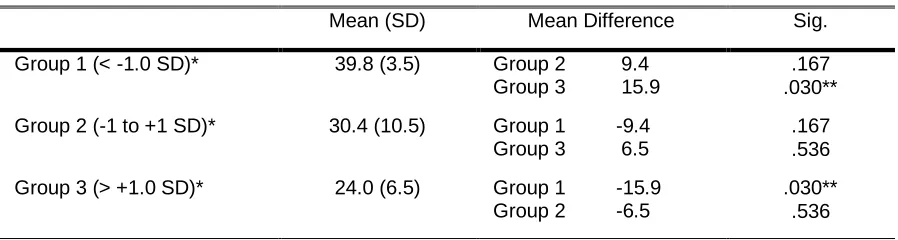
A significant difference was observed between kcal/kg and z-score category
(p=0.030). Bonferroni post hoc analysis (Table 3) revealed that this difference was
between group 1 (< -1 SD) and group 3 (> +1 SD) (p=0.030). Independent samples t-test
revealed a significant difference between kcal per kg and weight (p=0.018) and energy
expenditure and weight (p=0.023). A significant difference was also found between age
Z-score and weight (p=0.014) and energy expenditure (p=0.032). Weight was
expenditure (r= 0.656, p=0.001), 24-hour energy balance net (r= -0.430, p=0.041), age
[image:42.612.104.553.183.303.2](r= 0.637; p=0.001), and kcal/kg (r= -0.633, p=0.001), as shown in Table 9.
Table 3 ANOVA and Bonferroni Post Hoc Test Results of Z-score Weight (kg) and Kcal per Kg Body Weight
Mean (SD) Mean Difference Sig.
Group 1 (< -1.0 SD)* 39.8 (3.5) Group 2 9.4 Group 3 15.9
.167 .030**
Group 2 (-1 to +1 SD)* 30.4 (10.5) Group 1 -9.4 Group 3 6.5
.167 .536
Group 3 (> +1.0 SD)* 24.0 (6.5) Group 1 -15.9 Group 2 -6.5
.030** .536
*Groups were based on Z-scores for weight (kg) for analysis. **Significance set p<0.05
Hypothesis 1
Our first hypothesis was time periods of 3 hours or more spent in an energy
balance deficit is associated with lower lean body mass. A significant, negative
correlation was found between lean body mass and kcal consumed per kg (r= -0.430,
p=0.041), as seen in Table 9. Negative correlation was found between LBM and energy
deficit hours < -400 kcal, but it was not significant (r= -0.278, p=0.198).
A positive significant correlation was found between lean body mass per kg
(LBM/kg) and 24-hour energy balance (r= 0.432; p=0.040) and kcal per kg (r= 0.505;
p=0.014). Bonferroni post hoc (Table 4) revealed group 1 (< -0.5 SD) and 3 (> +0.5 SD)
had the largest amount of variance. Independent samples t-test showed a significant
difference between age Z-score and lean body mass (p=0.050), kcal per kg and Z-score
lean body mass (p=0.046), and energy expenditure and lean body mass (p=0.036). Age
32
Table 4 ANOVA and Bonferroni Post Hoc Test Results of Z-score Lean Body Mass (kg) and Kcal per Kg Body Weight
Mean (SD) Mean Difference Sig.
Group 1 (< -1.0 SD)* 37.2 (5.4) Group 2 8.2 Group 3 10.7
.255 .258
Group 2 (-1 to +1 SD)* 29.0 (12.0) Group 1 -8.2 Group 3 2.6
.255 1.000
Group 3 (> +1.0 SD)* 26.5 (3.9) Group 1 -10.7 Group 2 -2.6
.258 1.000
*Groups were based on Z-scores for lean body mass (kg) for analysis.
ANOVA analysis showed no significant difference between lean body mass for
height (LBMH) and energy expenditure. Spearman rho correlation (Table 9) was
significant for LBMH and kcal per kg consumed (r= -0.466, p=0.025) between group 1
and group 3.
Table 5. ANOVA and Bonferroni Post Hoc Test Results of Z-score Lean Body Mass/Height and Kcal per Kg Body Weight
Mean (SD) Mean Difference Sig.
Group 1 (< -0.25 SD)* 36.0 (6.00) Group 2 4.6 Group 3 10.1
1.000 .133
Group 2 (- 0.25 to +0.25 SD)* 31.4 (14.2) Group 1 -4.6 Group 3 5.5
1.000 .818
Group 3 (>+ 0.25 SD)* 25.9 (6.7) Group 1 -10.1 Group 2 -5.5
.133 .818
*Groups were based on Z-scores for lean body mass/height for analysis.
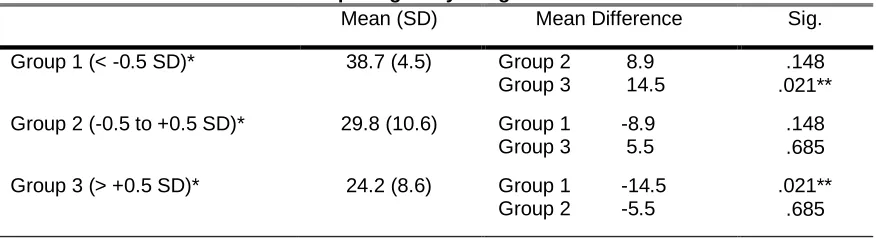
[image:43.612.108.540.486.609.2]Hypothesis 2
Our second hypothesis was time periods of 3 hours or more spent in energy
balance deficit is associated with higher fat mass. Fat mass was negatively associated
with energy balance deficits of < -400kcal, but it was not significant (r= -0.156;
p=0.476), as shown in Table 9. Age was positively correlated with fat mass (r= 0.439, p=
0.036).Fat mass was significantly correlated with kcal consumed per kg (r= -0.556,
p=0.006). There was a significant difference between kcal per kg body weight and fat
mass (p=0.21). Bonferroni post hoc test (Table 6) revealed the significant difference was
between Group 1 (< -1 SD) and 3 (> +1 SD). Independent sample t-test also revealed a
[image:44.612.106.544.397.516.2]significant difference between kcal per kg bodyweight and fat mass (p=0.009).
Table 6. ANOVA and Bonferroni Post Hoc Test Results of Z-score Fat Mass(kg) and Kcal per Kg Body Weight
Mean (SD) Mean Difference Sig.
Group 1 (< -0.5 SD)* 38.7 (4.5) Group 2 8.9 Group 3 14.5
.148 .021**
Group 2 (-0.5 to +0.5 SD)* 29.8 (10.6) Group 1 -8.9 Group 3 5.5
.148 .685
Group 3 (> +0.5 SD)* 24.2 (8.6) Group 1 -14.5 Group 2 -5.5
.021** .685
*Groups were based on Z-scores for fat mass (kg) for analysis. **Significance set p<0.05
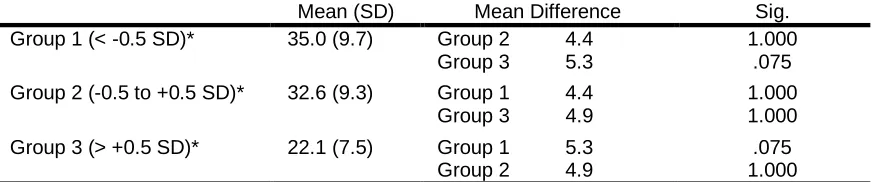
Table 7 shows results from ANOVA and Bonferroni post hoc used to determine if
a significant difference exists between body fat percent z-score and energy balance
variables. Categories body fat percent showed a near significant difference for kcal
consumed per kg body weight (p=0.60). Independent samples t-test was also performed,
34
analysis revealed a negative, significant correlation between body fat percent and kcal
consumed per kg bodyweight (r= -0.603, p=0.002). Age was positively correlated with
[image:45.612.106.542.207.298.2]body fat percent (r=0.570; p=0.005).
Table 7 ANOVA and Bonferroni Post Hoc Test Results of Z-score Body Fat Percent and Kcal per Kg Body Weight
Mean (SD) Mean Difference Sig.
Group 1 (< -0.5 SD)* 35.0 (9.7) Group 2 4.4 Group 3 5.3
1.000 .075 Group 2 (-0.5 to +0.5 SD)* 32.6 (9.3) Group 1 4.4
Group 3 4.9
1.000 1.000
Group 3 (> +0.5 SD)* 22.1 (7.5) Group 1 5.3 Group 2 4.9
.075 1.000
*Groups were based on Z-scores for body fat percent for analysis.
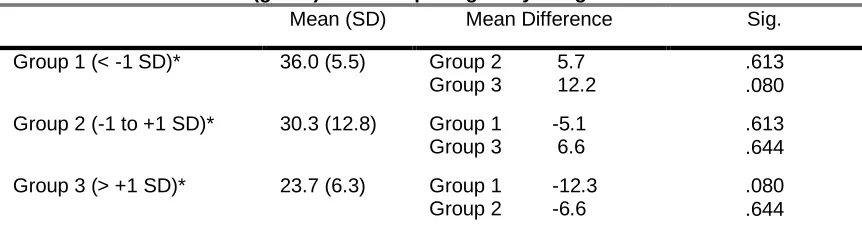
Hypothesis 3
Our third hypothesis was time periods of 3 hours or more spent in energy balance
deficit is associated with lower bone mineral density. BMD was significantly correlated
with: age (r= 0.672; p<0.001), kcal consumed per kg (r= -0.613, p=0.002), 24-hour
energy balance (r= -0.578; p=0.004), 24-hour energy balance net (r= -0.589; p=0.003),
weight (r= 0.707; p <0.001), LBM (r= 0.507, p=0.013), LBMH (r= 0.512; p=0.012),
LBM/kg (r= -0.557; p=0.006), FM (r= 0.626; p=0.001), FM/kg (r= 0.551, p=0.006), and
body fat percent (r= 0.761, p <0.001). There were no statistically significant differences
between BMD Z-score and kcal/kg as seen in Table 8. Calories per kilogram bodyweight
showed near significant difference between group 1 (-0.5 SD) and 3 (+0.5 SD) (p=0.080).
Independent Samples t-test revealed a significant difference between BMD and Kcal
consumed per kg bodyweight (p=0.032). Age Z-score was also significantly different
significant amount of variance in BMD for these subjects could be explained based on
their fat mass and weight, but not lean body mass. The equations are as follows:
BMDg/cm2= Fat Mass(kg)(0.22)+0.973
SEE= ±0.0591862; R2= 0.435; p=0.001
BMDg/cm2= Weight(kg)(0.007)+0.810
[image:46.612.110.541.245.363.2]SEE= ±0.068059; R2= 0.423; p=0.001.
Table 8. ANOVA and Bonferroni Post Hoc Test Results of Z-score Bone Mineral Density (g/cm2) and Kcal per Kg Body Weight
Mean (SD) Mean Difference Sig.
Group 1 (< -1 SD)* 36.0 (5.5) Group 2 5.7 Group 3 12.2
.613 .080
Group 2 (-1 to +1 SD)* 30.3 (12.8) Group 1 -5.1 Group 3 6.6
.613 .644
Group 3 (> +1 SD)* 23.7 (6.3) Group 1 -12.3 Group 2 -6.6
.080 .644
*Groups were based on Z-scores for bone mineral density (g/cm2).
Hypothesis 4
Our fourth hypothesis was 24-hour net energy deficits < -400 kcals will result in a
statistical difference between the highest and lowest Z-scores lean body mass. No
statistical difference was found between 24-hour net energy deficit < -400kcal and lean
body mass. We fail to reject the null hypothesis.
Hypothesis 5
Our final hypothesis was to determine if 24-hour energy deficits < -400 kcals will
result in a statistical difference between highest and lowest Z-scores fat mass. No
statistical difference was found between 24-hour net energy deficit < -400 kcals and fat