FEASIBILITY STUDY OF MATRIX BRIDGE CONFIGURATION FOR A
WEC POWER TAKE-OFF SYSTEM
A.
Z. Annuar
1and D Findlay
21PPKK, Universiti Malaysia Terengganu, Kuala Terengganu, Malaysia
2AlbaTERN Ltd, Midlothian Innovation Centre, Edinburgh, United Kingdom
E-Mail: [email protected]
ABSTRACT
We present a DC link matrix configuration for the hydraulic-based wave energy converters (WECs) working in array. The feasibility study is made to addressing important issues in the power security and power stability of the WECs’s DC link network. The electrical models of the proposed matrix bridge configuration were developed in MATLAB/Simulink environment to test the ability of the network for power aggregation among WECs. The simulation results is observed where the proposed configuration has demonstrated its effectiveness in providing power flow path which is needed for the stability and security of the interconnected networks.
Keywords: matrix bridge configuration of WECs, array, power aggregation, DC link network.
INTRODUCTION
Wave energy is a renewable energy source which appears to have potential to offset fossil fuel for the production of electricity in the future. This energy source, still in its infancy is originally related to natural movements of the winds upon the open water surface. As a result significant wave motion is produced and is only useful when converted to other types of energy, such as electricity.
Among the wave device technologies, WEC working in arrays offer reliable approach for power conversion and produced high power generation. However collection of electricity from multiple WECs is a challenging task. Thus to have an electrical network configuration that can be rely on and offer less complex operation would be attractive to investors.
Due to the complexity of the WECs, designing an electrical configuration can be made by using a simple model which represents the operation of the actual network. Simulation tools and production of a small scale prototype model are common techniques used by developers to test the suitability of the proposed configuration.
Realizing the important to have reliable electrical system of WECs, several studies for developing a network connecting WEC in array has been performed [1]–[4].The purpose of these studies are to demonstrate the capability of the proposed configuration that suit with the type of the WEC and its power take off (PTO).
Some of WEC developer, such as Seabased [7], uses a direct drive linear generator for its PTO. Reciprocation motion of its generator translator and inevitable shape of the power generated, study in [6] suggests this type of WECs are suitable to be connected in parallel. The literature in [3] shows by interconnecting a WECs in series could produce a problems in keeping the output power stable since most variations occur in the current.
Most of WECs which currently reached the commercialized stage [10], such as AlbaTERN [8] and
Pelamis LTD[9], use a hydraulic system as their PTO. In this system hydraulic components such as hydraulic accumulators, pump, and motor are used to drive a rotational generator using a mechanical-valve system. Due to the working nature of the conventional generators in the hydraulic system, different general configuration schemes such as radial, ring and star system as shown in Figure-1 generally proposed in offshore wind farms can be adopted.
Figure-1. (a) Radial, (b) Ring and (c) Star configurations.
Radial connection is cheaper but does not offer the same degree of reliability as a ring and star configurations [5] ,where a redundant path is provided in ring system. However the redundant cable should have same power rating to allow the full power to flow within the network. Ring configuration is generally proposed for larger scale generation.
The star configuration has the advantage of reducing the power rating of the cables since only one WEC is connected which could reduce the power cable cost. Moreover this type of connection scheme can provide a power security if a fault occurs as the affected WEC can be isolated from the rest of the WECs in the array.
Although there has been some industrial research proposal for WEC electrical configuration as discussed in [1]-[9], however, until now there is no best configuration that can suit with any type of WECs.
BACKGROUND OF THE STUDY
Due to the perspective of DC power grid in future [11], the proposed wave energy devices are suggested to be interconnected through a DC link network. Figure-2 shows the general wave park configuration which includes array interconnection, collection network point (CNP) and transmission line.
Figure-2. DC Link Network to the power transmission.
The reason for choosing DC system is easier for integration; either between WECs itself or to offshore future network, DC grid. Furthermore, DC transmission offers several advantages over AC especially for submarine crossing; where long undersea cable would have high electrical capacitance and transmitting DC power require no additional current to charge this cable capacitance which normally causes additional energy losses for AC system during the power transmission [12]. Typically, power electronic devices are placed in the system to acts as a power conditioner to match the generated power from the source to the power demand in the load. As example, transmitting AC power to the grid requires at least an inverter and transformer station either onshore or near shore in order to meets the specifications of the network. For the optimization, the intermediate power conversion equipment may also be required.
MATRIX BRIDGE CONFIGURATION
One of the characteristic of robust DC network is their ability to maintain the power level despite the incident of power failure or interruptions in the network. The power interruption can happen due to the presence of the short circuit. When the short circuit happens, excessive electrical current will flow in the circuit which can lead to circuit damage and malfunction of the network [13].
Several incidents that can possibly trigger to this event, among them are the cables breaks down, presence of conducting material such as sea water in the circuit (ex: PTO unit) or even when the generators are being forced to operate while their moving part are jammed which can cause the increasing current in the machine and finally lead to the short circuit [14]. These are the few examples of incidents that can introduce the short circuit and lead to the network path failure.
Figure-3. Matrix bridges configuration.
In this paper the matrix bridge configuration concept as shown in Figure-3 is proposed. The aim of having this DC network is to ensure the electrical current continues to flow although the power interruption occurs. The semiconductor switches typically are used to perform this task. The ability to either turn ON and OFF makes the semiconductor switches to be the common choice for diverting the current for power transmission.
Although there are many type of semiconductor power switches available in the industry [15], due to ease of maintenance and control, power diode rectifier is chosen. Thus the only possible option for the diode bridge to acts as an ideal switch in the matrix bridge is the polarity of its terminal anode and cathode where it conducting a current when it is in the forward biased mode and prevent the current to flow in the reverse biased mode.
MODELLING OF MATRIX DC NETWORK
Figure-4. Model of the matrix bridge network.
Figure-5. Hydraulic power unit of WECs.
PRINCIPLE OPERATION
In order to understand the way the current conduct through each junction in the matrix bridge configuration one should refer to the circuit shown in Figure 6. The circuit consists of two DC sources voltage and two diodes which are connected to the middle voltage source V2. To allow the current I12 circulating through loop
L1, the voltage V1 must be greater than the voltage at V2.
Similarly, when the voltage at V3 is greater than the
voltage at V2, the current I32 will circulates through L2
passing through D2. In this circuit topology, the direction of the currents will be decided by the greater voltage between two DC sources. However when the voltage at V2
is greater than either two voltage sources, V1 or V3, the
flow of the current from V2 (ex: I21) will be block by the
presence of diode D1 or D2.
Figure-6. Currents flow between three DC sources.
Similarly in the approximation model of one row matrix bridge network as can be seen in Figure-7, if the generated DC voltage nodes produced are different (𝑉11≠
𝑉12≠ 𝑉13), DC voltage in a row , 𝑉𝑚 (ex: 𝑉1)is determined
by the highest DC voltage nodes , 𝑉𝑚𝑛 ( ex: 𝑉11) and the
voltage across diode, 𝑉𝑑. When this is happens, the current
will only flow through D1 when the total DC voltage in
respective junction (ex:𝑉11+ 𝑉𝑑) is greater than the DC
voltage in a row 𝑉1.
Figure-7. Approximation model of one row matrix bridge.
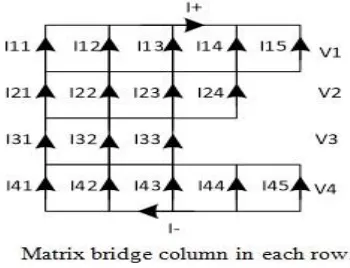
[image:3.595.58.277.330.441.2]Figure-8 describe the attributes of the voltages and the currents for each column and row of the matrix bridge network. As can be seen (due to the polarity of the DC link terminal voltage), the currents will split through the branch of the network and flow from the bottom to the top of the circuit. Due to the KCL rule, the amount of current passing through each junction will depends on the junction voltage level, impedances and the number of the Matrix bridge column in each row.
Figure-8. DC voltages and DC currents in a row and column of matrix bridge.
Using a general rule of Kirchhoff and ohm’s Law, analytical equations based on two case studies of matrix bridge configuration in Figure-7 and Figure-8, can be derived.
Case 1: Equivalent DC voltage nodes, 𝑉𝑚𝑛
[image:3.595.338.513.482.616.2] [image:3.595.60.282.662.745.2](1)
Currents on the top and bottom rows,𝐼+ and 𝐼−
(2) where 𝑅𝐿 is the resistive load
DC current in a column
(3)
where m and n are the number of row and column in matrix bridge network
Case 2: Different DC voltage nodes, 𝑉𝑚𝑛
Voltage in a row, 𝑉𝑚
(4)
(5)
DC current in a column
(6)
SIMULATION RESULTS
To validate analytical formulas made in the previous section, both of the matrix bridge DC network model has been modelled in MATLAB/Simulink environment. At first, simulations are made when each DC voltage producing equivalent DC voltage nodes, case 1. After transient period dies out, the results show a good correlation between both circuit models as can be seen in Figure-9 (a)-(f) (red lines are from approximation model).
(a)
(b)
(c)
(d)
(e)
(f)
Figure-9. Graph of the voltages and currents for case.
Study1.
a) DC voltage in a row 1
b) DC current in each matrix column c) Load Voltage (resistive load) d) Load current (resistive load)
e) Total output Power Line voltage and Line f) current of PMGs.
level in the matrix. From the equation (5), the value of the voltage in a matrix row is determined by the highest rectified DC voltage nodes in the row. However the current will only flow when the diode in the bridge rectifier is in forward mode, which is when 𝑉𝑚𝑛 is greater
than 𝑉𝑚 as defined in equation (6).
(a)
(b)
Figure-10. (a) DC and (b) AC current of the matrix row.
Analytical assumption on DC current when different level of rectified DC voltage, 𝑉𝑚𝑛 can be seen
from the simulation result shown in Figure-10 (a) where the amount of current through each column is determined by the level of 𝑉𝑚𝑛 generated in each matrix nodes. As a
result, the amount of power feeding by them to the DC link are different as can be seen on the amplitude of phase current (power extracted) of these PMG generators in Figure-10 (b).
(a)
(b)
Figure-11. DC Voltages nodes in a matrix row (a) with capacitor and (b) without capacitor.
As shown in Figure-11 (a), the DC voltage in a row, 𝑉𝑚 produced a fairly significant AC ripple on top of
its DC component voltage. This ripple voltage can range from several volts or hundred volts, depending on the voltage difference between the maximum and the minimum of the rectified DC voltage in a row. However this AC ripple can be greatly reduced by adding a smoothing capacitor across each end rows. The result when a filter capacitor is added is shown in Figure-11(b), where the voltage ripple seems to be reduced by more than 50%.
CONCLUSIONS
This feasibility study is made to see the benefits of employing matrix DC link network on WECs working in array. The series of simulation study are constructed which aimed to understand the behaviour of this network while delivering power to the shore station. Results show that this configuration has an advantage of a segregated of power determined by the level of the DC voltage produced in matrix network nodes. Thus could be an interesting area to be addressed in future work.
REFERENCES
[1] O. Gomis-Bellmunt, J. Liang, J. Ekanayake, R. King and N. Jenkins. 2011. Topologies of multiterminal HVDC-VSC transmission for large offshore wind farms. Electric Power System Research. Vol. 1, No. 2, pp. 271–281.
[2] J. Green, A. Bowen, L. J. Fingersh, and Y. Wan. 2007. Electrical Collection and Transmission Systems for Offshore Wind Power. The Offshore Technology Conference Houston, USA.
[3] K. Thorburn. 2004. Wave energy transmission system concepts for linear generator arrays. Ocean Engineering. Vol. 31, No. 11–12, pp. 1339–1349.
European Wave Tidal Energy Conference. EWTEC. pp. 36–43.
[5] G. Quinonez-Varela, G. W. Ault, and J. R. Mcdonald. 2007. Electrical collector system options for large offshore wind farms. IET Renewable Power Generation. Vol. 1, No. 2, pp. 107–114.
[6] K. Thorburn and M. Leijon. 2006. Analytical and Circuit Simulations of Linear Generators in Farm. IEEE PES Transmission and Distribution Conference and Exhibition . pp. 495–500.
[7] Seabased. website: www.seabased.com.
[8] AlbaTERN Ltd. website: albatern.co.uk.
[9] Pelamis .website: www.pelamiswave.com.
[10] T. W. Thorpe, I. G. Bryden, D. Milborrow and H. Krock .2010. Survey of Energy Resources.
[11] V. Straka. 2002. Future of HVDC power grid in europe.
[12] Siemens AG. High Voltage direct current (HVDC) Transmission- Proven Technology for Power Exchange. website: www.siemens.com.
[13] J. Machowski, J.W Bialek, J. R. Bumby. 2008. Power System Dynamics: Stability and Control. 2nd Ed. John
Wiley & Sons. pp .128-129.
[14] M. H. Rashid. 2002. Power Electronics Handbook. 1st
Ed. Academic Press Series in Engineering. pp. 110 - 111.