Georgia State University Georgia State University
ScholarWorks @ Georgia State University
ScholarWorks @ Georgia State University
Biology Dissertations Department of Biology
Spring 5-6-2012
The Reorganization of Primary Auditory Cortex by Invasion of
The Reorganization of Primary Auditory Cortex by Invasion of
Ectopic Visual Inputs
Ectopic Visual Inputs
Yuting Mao
Biology department
Follow this and additional works at: https://scholarworks.gsu.edu/biology_diss
Recommended Citation Recommended Citation
Mao, Yuting, "The Reorganization of Primary Auditory Cortex by Invasion of Ectopic Visual Inputs." Dissertation, Georgia State University, 2012.
THE REORGANIZATION OF PRIMARY AUDITORY CORTEX BY INVASION OF
ECTOPIC VISUAL INPUTS
by
YUTING MAO
Under the Direction of Sarah L. Pallas
ABSTRACT
Brain injury is a serious clinical problem. The success of recovery from brain injury
involves functional compensation in the affected brain area. We are interested in general
mechanisms that underlie compensatory plasticity after brain damage, particularly when multiple
brain areas or multiple modalities are included. In this thesis, I studied the function of auditory
cortex after recovery from neonatal midbrain damage as a model system that resembles patients
with brain damage or sensory dysfunction. I addressed maladaptive changes of auditory cortex
and multisensory neurons after it recovered from neonatal midbrain damage (Mao et al. 2011).
The distribution of these different neuronal responses did not show any clustering or segregation.
As might be predicted from the fact that auditory neurons and visual neurons were intermingled
throughout the entire auditory cortex, I found that residual auditory tuning and tonotopy in the
rewired auditory cortex were compromised. Auditory tuning curves were broader and tonotopic
maps were disrupted in the experimental animals. Because lateral inhibition is proposed to
contribute to refinement of sensory maps and tuning of receptive fields, I tested whether loss of
inhibition is responsible for the compromised auditory function in my experimental animals. I
found an increase rather than a decrease of inhibition in the rewired auditory cortex, suggesting
that broader tuning curves in the experimental animals are not caused by loss of lateral inhibition.
These results suggest that compensatory plasticity can be maladaptive and thus impair the
recovery of the original sensory cortical function. The reorganization of brain areas after
recovery from brain damage may require stronger inhibition in order to process multiple sensory
modalities simultaneously. These findings provide insight into compensatory plasticity after
sensory dysfunction and brain damage and new information about the role of inhibition in
cross-modal plasticity. This study can guide further research on design of therapeutic strategies to
encourage adaptive changes and discourage maladaptive changes after brain damage,
sensory/motor dysfunction, and deafferentation.
THE REORGANIZATION OF PRIMARY AUDITORY CORTEX BY INVASION OF
ECTOPIC VISUAL INPUTS
by
YUTING MAO
A Dissertation Submitted in Partial Fulfillment of Requirements for the Degree of
Doctor of Philosophy
in the College of Arts and Sciences
Georgia State University
2012
Copyright by Yuting Mao
2012
THE REORGANIZATION OF PRIMARY AUDITORY CORTEX BY INVASION OF
ECTOPIC VISUAL INPUTS
By
YUTING MAO
Electronic Version Approved:
Office of Graduate Studies
College of Arts and Sciences
Georgia State University
May 2012
Committee Chair: Prof. Sarah L. Pallas
Committee: Prof. Charles Derby
Prof. Donald Edwards
ACKNOWLEDGEMENTS
I thank my advisor Dr. Sarah Pallas for her many years of instruction in scientific
research, support in everyday life and work. I also appreciate the many years of guidance from
my committee members: Profs. Charles Derby, Donald Edwards, and Robert Liu. I also thank
members of the Pallas lab for technical assistance and their comments on manuscripts. I
sincerely thank staff in animal facility for their strenuous work. Finally, I am also grateful for the
TABLE OF CONTENTS
ACKNOWLEDGEMENTS iv
LIST OF TABLES vi
LIST OF FIGURES vii
LIST OF ABBREVIATIONS ix
CHAPTER 1 INTRODUCTION 1
CHAPTER 2 COMPETITION AND CONVERGENCE BETWEEN
AUDITORY AND CROSS-MODAL VISUAL INPUTS TO PRIMARY
AUDITORY CORTEX
15
CHAPTER 3 COMPROMISE OF AUDITORY TUNING AND
TOPOGRAPHY AFTER CROSS-MODAL INVASION BY VISUAL
INPUTS
70
CHAPTER 4 CROSS-MODAL PLASTICITY RESULTS IN
INCREASED INHIBITION IN PRIMARY AUDITORY CORTICAL
AREAS
118
CHAPTER 5 DISCUSSION 148
LIST OF TABLES
Table 2.1. The proportion of neuronal types and residual midbrain volumes in
lesioned animals
47
Table 3.1. The proportion of low-frequency neurons and residual midbrain
volumes in lesioned animals
LIST OF FIGURES
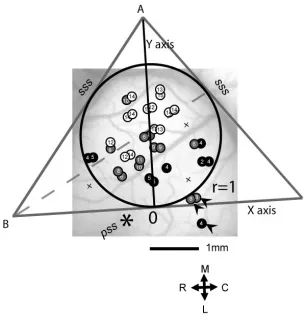
Figure 2.1. Method for quantification of distribution of neuronal response types
in auditory cortex.
49
Figure 2.2. Assessment of midbrain damage. A: an example of a section
through the inferior colliculus (IC).
50
Figure 2.3. Neuronal response types. A and B: the relative proportions of
neuronal response types in AC of all normal (A) and all lesioned
ferrets (B).
51
Figure 2.4. Relationship between midbrain lesion type and size and neuronal
response type in AC of experimental animals.
53
Figure 2.5. Statistical comparison of midbrain size between normal and
lesioned animals.
55
Figure 2.6. Neuronal response types in the 3 groups. A: the large-lesion group
contained more visual neurons than the small-lesion group.
56
Figure 2.7. Reconstruction of locations of recorded neurons in normal AC. 58
Figure 2.8. Distribution of neuronal response types in normal AC. A: polar plot
of pooled data from all 10 normal cases.
59
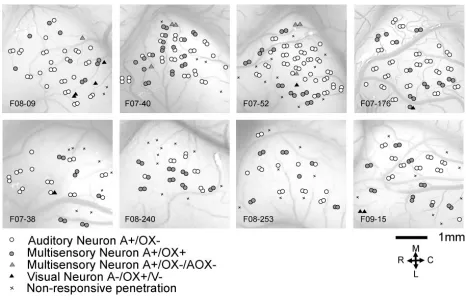
Figure 2.9. Reconstruction of locations of recorded neurons in AC of the
small-lesion group (8 examples from 10 animals are shown).
Figure 2.10. Distribution of neuronal response types in AC across the population
of small-lesion cases.
62
Figure 2.11. Reconstruction of locations of recorded neurons in AC of
large-lesion cases (5 examples from 5 animals are shown).
64
Figure 2.12. Distribution of neuronal responses in AC of large-lesion cases. 65
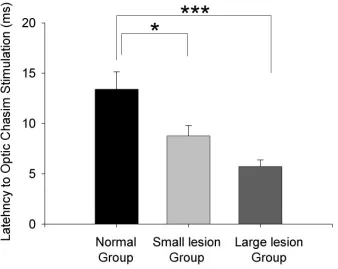
Figure 2.13. Latencies of responses to optic chiasm stimulation in normal AC
and cross-modal AC.
67
Figure 2.14. Schematic of possible inputs to normal AC, to XMAC of
small-lesion animals, and to X-modal AC of large-small-lesion animals.
68
Figure 3.1. Method for quantification of neuronal response type distribution in
auditory cortex.
101
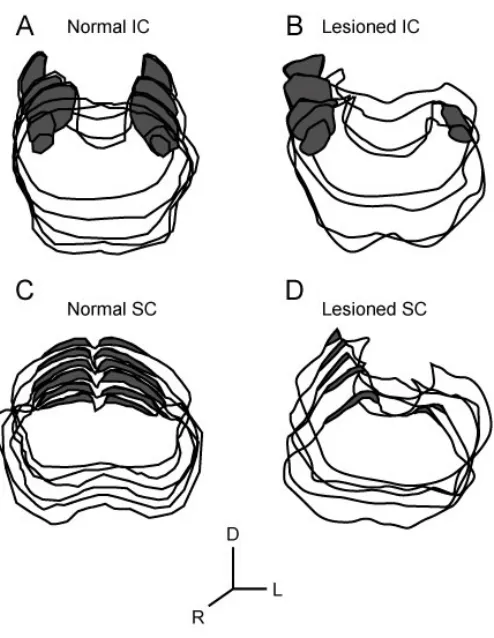
Figure 3.2. Assessment of midbrain damage. ICc was lesioned bilaterally and
sSC was unilaterally lesioned on the left side.
102
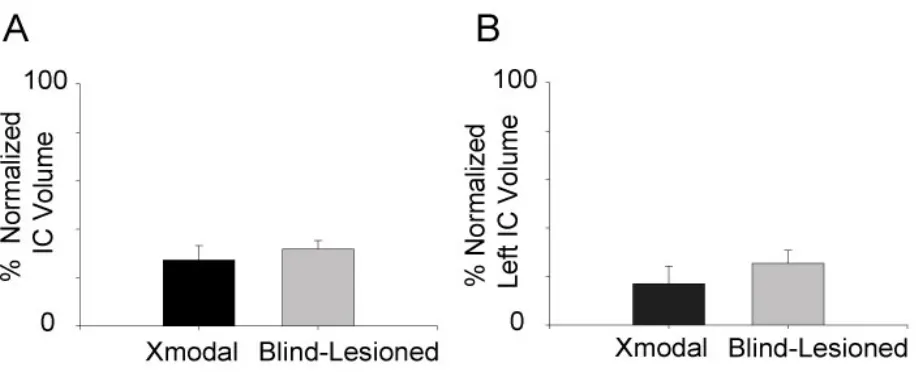
Figure 3.3. Statistical comparison of residual volume of inferior colliculi in
Xmodal animals and blind-lesioned animals.
103
Figure 3.4. Examples of tuning curves of auditory and multisensory neurons. 104
Figure 3.5. The response characteristics of neurons in Xmodal and control
animals.
Figure 3.6. Reconstruction of locations of frequency-tuned neurons in normal
AC.
107
Figure 3.7. Reconstruction of locations of frequency-tuned auditory neurons in
AC of Xmodal animals.
108
Figure 3.8. Reconstruction of locations of frequency-tuned multisensory
neurons in AC of Xmodal animals.
110
Figure 3.9. Reconstruction of locations of frequency-tuned neurons in AC of
blind-lesioned animals.
111
Figure 3.10. Reconstruction of locations of frequency-tuned neurons in AC of
three blind animals.
112
Figure 3.11. Distribution of frequency-tuned neurons in AC of ferrets using
pooled data from each group.
113
Figure 3.12. The location of frequency-tuned neurons in the 5 groups. 115
Figure 3.12. The proportion of frequency-tuned neurons in the 5 groups. 116
Figure 4.1. Effects of the GABAAR antagonist gabazine on evoked responses to
sound.
138
Figure 4.2. Two examples of gabazine’s effect on sound frequency tuning. 139
Figure 4.3. The effects of gabazine on thresholds and bandwidths of auditory
tuning curves in the population of normal and XM neurons.
Figure 4.4. The effects of gabazine on spontaneous activity and auditory
responsiveness.
141
Figure 4.5. One example of auditory neuron responses and to bisensory stimuli
before and after blocking inhibition.
144
Figure 4.6. One example of the response of multisensory neurons to auditory
and optic chiasm stimuli before and after blockade of inhibition by
gabazine.
145
Figure 4.7. The comparison of mean spike numbers from responses to optic
chiasm stimulation before and after gabazine application.
146
Figure 4.8. The distribution of neuronal responses before and after application
of gabazine. Each figure represents data from one animal.
LIST OF ABBREVIATIONS
AC Auditory cortex
A1 Primary auditory cortex
AAF Anterior auditory field
BF Best frequency
dLGN Dorsal lateral geniculate nucleus
EPSP Excitatory postsynaptic potential
FAES Auditory field of the anterior ectosylvian sulcus
FRA Frequency response area
GABA γ-aminobutyric acid
GAD Glutamic acid decarboxylase
IC Inferior colliculus
IM Intramuscular injection
IP Intraperitoneal injection
IPSP Inhibitory postsynaptic potential
LTP Long term potentiation
LTD Long term depression
MGN Medial geniculate nucleus
MRI Magnetic resonance imaging
PB Phosphate buffer
PBS Phosphate-buffered saline
PSTH Poststimulus time histogram
RF Receptive field
SC Superior colliculus
SQ Subcutaneous injection
TBI Traumatic brain injury
TMS Transcranial magnetic stimulation
XM Cross-modal
CHAPTER 1: INTRODUCTION
Brain dysfunction caused by brain injury, sensory deprivation, or motor disability can severely
affect human life. Neuroplasticity is the ability of the brain to adapt to environmental changes or
brain damage. This plasticity helps the brain to restore the loss of function and operates in
sensory, motor, and higher cognitive brain areas. The success of recovery involves the rebuilding
of function by sprouting or rewiring of neural connections, and the reorganization of excitatory
and inhibitory circuitry. These changes may be limited to a single modality, but research is
beginning to reveal that recovery from loss of inputs involves multiple modalities. Sensory
deprivation or deafferentation can cause the spared sensory region to be taken over by other
sensory modalities (Frasnelli et al. 2011; Kral and Sharma 2012). Traumatic brain injury (TBI)
can also cause cross-modal (XM) projections, which affect the reaction time for cognitive tasks
in TBI patients (Sarno et al. 2003). Sometimes cross-modal projection can be beneficial
(Frassinetti et al. 2005), whereas at other times cross-modal plasticity can be harmful (Lee et al.
2001). Therefore, understanding the mechanisms behind cross-modal plasticity is important for
understanding brain development and recovery of brain regions from damage.
In this project, I studied the reorganization of auditory cortex after invasion by visual
inputs. I use ferrets with neonatal midbrain damage in which retinal projections are redirected to
auditory thalamus (medial geniculate nucleus, MGN), then to auditory cortex. Because of the
coexistence of auditory, visual and multisensory neurons in the reorganized auditory cortex
(XMAC), this model system allows us to study the effect of cross-modal plasticity without
elimination of inputs from any sensory modalities, in contrast to studies employing complete
by which auditory function is compromised. Brain plasticity exists throughout life. In addition to
providing important insights into recovery of sensory systems from sensory dysfunction and
neonatal brain damage, results from this study may also help us to understand adult brain injury
and sensory/motor deficits.
Because plasticity affects both excitation and inhibition, the following introduction
discusses the changes in both excitatory and inhibitory circuits during recovery from sensory
deafferentation and deprivation. I first discuss changes in excitation from macro to micro level
within single modality, then recovery of brain across modalities. The third part of the
introduction discusses changes in inhibition from physiology-level to receptor-level. Lastly, the
introduction talks about the advantage of animal models and specific aims.
1. Changes in excitatory networks
a) Changes in size of brain structures
Sensory deprivation, deafferentation, and brain damage can result in shrunken subcortical target
nuclei due to loss of their inputs. This can be illustrated using several examples. Olfactory
deprivation by unilateral cauterization of the olfactory epithelium results in a smaller olfactory
bulb on the deprived side (Benson et al. 1984). After destruction of vibrissal follicles, the nucleus
interpolaris of the trigeminal nuclear complex is shrunken in mice (Hamori et al. 1986). A
reduction in the volume of cochlear nuclei also occurs in the brainstem of ferrets with cochlear
lesions (Moore and Kowalchuk 1988). In the visual system, neonatal monocular enucleation
causes significant reductions in the volume of the dorsal lateral geniculate nucleus (dLGN), the
volume of LGN and the lateral posterior nuclei of the thalamus (Restrepo et al. 2002). In contrast
to the effects of loss of sensory input, sensory experience can increase the volume of related
brain regions. Hippocampus is associated with spatial navigation. A study using Magnetic
Resonance Imaging (MRI) on London taxi drivers found that their posterior hippocampi were
significantly larger than those of normal subjects, indicating an experience-dependent increase in
the size of the affected brain regions(Maguire et al. 2000).
b) Changes in topographic representation
In addition to shrinkage of subcortical nuclei, sensory deprivation, deafferentation, and brain
damage can induce cortical reorganization. Much of sensory cortex is topographically organized
(Kaas 1997). The topographic occupation of sensory inputs can be modified by experience and
sensory deprivation. Loss of sensory inputs can cause cortical areas to respond to adjacent inputs
that represent surrounding regions at receptor sheets or to contralateral inputs. These
activity-dependent reductions in topographic area have been found in somatosensory cortex (Merzenich
et al. 1983), visual cortex (Shatz and Stryker 1978), and auditory cortex (Robertson and Irvine
1989). In contrast to sensory deprivation and deafferentation, sensory experience can expand
cortex that responds to certain stimuli. The cortical representation of musical scales in the
auditory cortex of skilled musicians is much larger than that of normal subjects (Pantev et al.
2003). These expansions of auditory representations also occur in animal models with
overexposure to selected tone frequencies since birth (Zhang et al. 2001).
c) Sprouting in the central nervous system after loss of inputs
After loss of inputs, the axons of nerve cells in the central nervous system normally degenerate.
remaining afferents to the deafferented brain area is a way to compensate for the loss of
excitatory drive. Sprouting can come from the perilesional area, ipsilateral subcortical or cortical
areas, and/or contralateral areas. Chronic peripheral nerve injuries can cause central
somatosensory neurons to respond to afferents from undamaged peripheral axons (Kalaska and
Pomeranz 1982), which reflects the sprouting or expansion of remaining afferents (Florence and
Kaas 1995). In the visual system, after monocular enucleation, retinogeniculate inputs from the
remaining eye sprout to LGN and the commissural connection is strengthened (Toldi et al. 1996).
Corticothalamic inputs are also elevated after visual deafferentation (Somogyi et al. 1987). In
addition, sprouting can occur within cortical areas. Binocular retinal lesions induce axon
sprouting of long-range neurons that project laterally to non-deprived visual cortex
(Darian-Smith and Gilbert 1994; Obata et al. 1999). An increase in intracortical connectivity was
reported in the somatosensory cortex of macaque monkeys who had undergone trauma to a
forelimb (Florence et al. 1998). Many times, sprouting is accompanied with change of
topographic representation after sensory deprivation or deafferentation (Jones 2000).
d) Changes in synaptic density
At the cellular level, one effect of sensory deprivation and deafferentation is a decrease in
synaptic density. Binocular deprivation decreases synaptic density of subcortical afferents in cat
visual cortex (Turlejski and Kossut 1985). Whisker trimming from birth decreases symmetrical
synapses and thalamocortical synapses (Sadaka et al. 2003) and dendritic spine density in layers
1 and 2/3 of barrel cortex(Briner et al. 2010). A decrease in dendritic spine density has also been
found in visual cortex of visually-deprived animals (Montey and Quinlan 2011). In some cases, a
e) Modulation of synaptic strength (LTP, LTD)
At the synaptic level, the adaption of the brain to a changing environment can be reflected by
strengthening or weakening connections between synapses. Carla Shatz famously described this
phenomenon as “cells that fire together, wire together” (Katz and Shatz 1996; Shatz 1990). Long
term potentiation (LTP) represents an increase in synaptic strength following a brief but strong
stimulation. Long term depression (LTD) represents a decrease in synaptic strength following a
weak stimulation. Because synaptic strength relies on activity, loss of sensory inputs by sensory
deprivation, deafferentation, or brain damage can significantly affect LTP and LTD.
i) LTP
Sensory deprivation can result in the reduction in size of target cortical areas and the expansion
of neighboring cortical areas. Whisker deprivation alters short-term synaptic dynamics in barrel
cortex (Finnerty et al. 1999; Fox 2002), increases the probability of inducing LTP, and decreases
the probability of inducing LTD in barrel cortex (Hardingham et al. 2011). In visual cortex,
visual deprivation facilitates LTP (Philpot et al. 2003) and depresses LTD (Kirkwood et al. 1996).
ii) Neurotransmitter systems involved in plasticity
N-methyl-D-aspartate (NMDA) type of glutamate receptors play an important role in LTP (Bear
and Colman 1990; Bear et al. 1990). The ratio of two subunits, NR2A and NR2B, is subject to
change during the critical period and this ratio affects synaptic plasticity. Insertion of NR2A in
the membrane can shorten NMDA receptor currents, thereby decreasing excitation (Fagiolini et
al. 2003), whereas NR2B has the opposite effect. Visual deprivation by dark rearing in rats
contains a higher proportion of NR2B and a longer duration of NMDA current than in
light-reared rats (Philpot et al. 2001). In contrast, visual experience increases the ratio of NR2A/2B in
visual cortex. As little as one hour of exposure reverses the effect of dark-rearing (Quinlan et al.
1999).
2. Cross-modal plasticity
In addition to the post-injury compensation that occurs within brain areas responding to a single
modality, compensation from cross-modal plasticity may help sensory-deprived and –
deafferented animals and human subjects to overcome the loss of one sense.
a) Blindness
Long-term visual deprivation leads to cross-modal plasticity.
i) Human subjects
Numerous studies have reported that auditory ability in blind people is better than sighted people.
Blind humans exhibit supra-normal abilities in locating auditory targets (Voss et al. 2004) and
respond to auditory tasks faster than normal subjects (Collignon and De Volder 2009). Magnetic
resonance imaging (MRI) studies have shown that the visual cortex of blind patients is activated
when sounds are presented (Kujala et al. 1995). Furthermore, when blind users wear a device
that translates visual stimuli into auditory sensations, transcranial magnetic stimulation (TMS) in
visual cortex impairs object recognition, further suggesting that visual cortex is recruited for
decoding images by sound (Merabet et al. 2009).
Improved tactile ability also occurs in blind humans (Wittenberg et al. 2004). Primary
tactile perceptions in blind subjects but not in normal-sighted subjects (Cohen et al. 1997;
Kupers et al. 2006). Some research argues that cross-modal projections can only be found in
early-onset blindness (Cohen et al. 1999), whereas other research suggests that cross-modal
plasticity can also occur in a mature brain (Kujala et al. 1997; Kujala et al. 2000).
ii) Animal studies
Animal studies use both enucleated/eye-sutured animals and congenitally blind animals. As seen
in studies of blind humans, both somatosensory and auditory functions are improved in blind
animals. Behaviorally, visually-deprived cats can locate sound more precisely than normal cats
(Rauschecker 1995b; Rauschecker and Kniepert 1994). Physiologically, visual cortical areas
(Heil 1991; Kahn and Krubitzer 2002; Newton et al. 2002; Piché et al. 2007) and cortical regions
along the anterior ectosylvian sulcus (Rauschecker 1996) are taken over by auditory and/or
somatosensory systems after visual deprivation. Anatomically, visual cortex in blind animals
receives both somatosensory and auditory inputs (Kahn and Krubitzer 2002; Karlen et al. 2006).
Using c-Fos immunohistochemistry, it has been shown that auditory stimulation activates
thalamic and cortical visual areas in congenitally anophthalmic mice (Piche et al. 2004). Where
do these auditory inputs originate? Anatomical research shows that inferior colliculus can project
directly to LGN or visual cortex in blind mole rats (Bronchti et al. 2002; Doron and Wollberg
1994), enucleated hamsters (Izraeli et al. 2002), and anophthalmic mice (Laemle et al. 2006). An
increase in the proportion of auditory neurons is also found in multisensory areas such as the
superior colliculus after enucleation (Rauschecker 1984). In addition to changes in visual cortex
and LGN, visual deprivation also affects somatosensory cortex and auditory cortex.
rats (Toldi et al. 1994), blind mole rats (Necker et al. 1992), and eyelid-sutured cats (Bronchti et
al. 1992; Rauschecker et al. 1992). Compared to normal animals, neuronal density in auditory
cortex of enucleated animals is increased (Ryugo 1975) and auditory spatial tuning is sharper
(Rauschecker 1995b)
b) Deafness
Long-term auditory deprivation leads to cross-modal plasticity.
i) Human subjects
Although it has been widely accepted that blind patients have supranormal auditory and
somatosensory perception, it remains unknown whether deaf people can see better than sighted
people. Some research shows that auditory cortex in deaf patients can be activated by visual
signals (Finney et al. 2001), whereas other research argues that not all aspects of vision are
changed (see Bavelier et al. 2006 for review). Specifically, deaf patients show enhanced
peripheral but not central (foveal) visual processing (Dye et al. 2007). Furthermore, visual
activation of primary auditory cortex occurred only in deaf subjects with total hearing loss and
not in subjects with residual hearing ability (Lambertz et al. 2005), suggesting a competition
between sensory inputs from different modalities. The critical period for sensory plasticity is
very important for recovery from sensory loss. Early deaf people are more likely to have
cross-modal activity than late deaf people (Buckley and Tobey 2011).
ii) Animal studies
Congenitally deaf cats have superior visual ability compared to normal cats (Lomber et al. 2011;
cortical area (Hunt et al. 2006). Using positron emission tomography, researchers found that
glucose metabolism in the primary visual cortex of deaf cats was significantly higher, and
glucose metabolism in the primary auditory cortex was significantly lower than that in normal
cats (Park et al. 2010). A recent study reported considerable somatosensory rewiring to auditory
cortices in animals that were deafened as adults (Allman et al. 2009a). Other auditory cortical
areas (auditory field of the anterior ectosylvian sulcus, FAES, and anterior auditory field, AAF)
were also found to be visually-responsive in deaf cats (Meredith et al. 2011; Meredith and
Lomber 2011).
c) Maladaptive plasticity
Cross-modal interaction can be responsible for abnormal signals, sometimes referred to as
phantom perceptions. Tinnitus can be triggered by cross modal sensory inputs (Cacace 2003). In
patients who have acute unilateral deafferentation of the auditory system after removing a tumor
in the posterior fossal region, tinnitus can be modulated by somatosensory cues such as skin
movement (Herraiz et al. 2003). Intracortical facilitation has also been found in tinnitus patients
(Langguth et al. 2005). This cross-modal interaction suggests that a maladaptive cortical
reorganization underlies some phantom perceptions.
Cross-modal plasticity can have negative effects on auditory performance during
rehabilitation of cochlear implant users (Champoux et al. 2009). Cochlear implants are auditory
prostheses that are designed for restoring speech perception. In prelingually deaf children with
cochlear implants, auditory cortex often cannot respond to auditory signals because it has been
cross-modal plasticity, deaf patients with cochlear implants may exhibit poorer than expected
performance in auditory speech recognition tasks (Doucet et al. 2006).
d) Cross-modal plasticity under normal conditions
Cross-modal activity also occurs in people with normal sensory function. Long-term training in a
sensory or motor task can induce cross-modal projections in sensory and motor systems.
Musicians demonstrate great plasticity in cortical organization. When the lips of trumpet players
are stimulated at the same time as a trumpet tone, activation in the somatosensory cortex is
increased more than it is during the sum of the separate lip and tone stimulation (Pantev et al.
2003).When musicians listen to a rehearsed music piece, their motor cortex shows an increase in
excitability than when listening to a non-rehearsed piece (D'Ausilio et al. 2006). Interestingly,
skilled Mah-Jong players can “see” visual images by touching Mah-Jong tiles, suggesting that
their primary visual cortex is activated by somatosensory cues (Saito et al. 2006).
3. Changes in inhibition
The classical literature on sensory physiology proposes that lateral inhibition from neighboring
neurons sharpens excitatory responses to sensory stimuli. Blockade of inhibition enlarges visual
receptive fields (Sillito 1975) and decreases orientation selectivity (Sillito 1979; Sillito et al.
1980; Tsumoto et al. 1979; Worgotter and Eysel 1991) in visual cortex. During development,
refinement of synaptic connections involves suppression of some responses by increasing
inhibition. Following brain damage, sensory deprivation, or deafferentation, in order to maintain
the balance between excitation and inhibition, the strength of inhibition is decreased to
compensate for the loss of inputs (Murphy 1985; Turrigiano 2011; Turrigiano 1999; Vale and
a) Physiological changes
After somatosensory deafferentation, the spared sensory cortex begins to respond to stimuli
carried by inputs to the surrounding brain tissue (Kaas et al. 1983; Merzenich et al. 1983b; Wall
et al. 1983). After focal retinal lesions, receptive fields in visual cortex are expanded and axonal
sprouting of laterally- projecting neurons is activated (Chino et al. 1992; Gilbert and Wiesel
1992). One mechanism underlying this expansion of representational area is removal of the
lateral inhibition that normally suppresses the responses to other stimuli. Applying antagonists
of GABAA receptors to the sensory cortex can alter spike number and receptive fields of neurons,
revealing the strength of inhibition. The effect of GABAA receptor antagonists is decreased in
sensory-deprived and deafferented animals as a result of loss of inhibition (Carrasco et al. 2011;
Jung and Shin 2002).
b) Changes in expression of receptors, transmitters, and enzymes
Changes in inhibition at the molecular level involve inhibitory neurotransmitter receptors, the
transmitters themselves, and enzymes involved in producing them. γ-aminobutyric acid (GABA)
is the main inhibitory neurotransmitter in mammalian central nervous systems. Glutamic acid
decarboxylase (GAD) is the synthetic enzyme for producing GABA in neurons. GAD has two
isoforms, GAD67 and GAD65, which are universally expressed in the brain. Considerable
evidence exists that the expression of GABA, GABAA receptors, and GAD are decreased in
target tissue after deafferentation. For example, peripheral nerve transection in monkeys induces
cortical reorganization and a decrease in GABA expression in somatosensory cortex (Garraghty
et al. 1991). Whisker trimming causes a loss of GABAergic neurons (Micheva and Beaulieu
GABAergic synapses (Micheva and Beaulieu 1995a) in the whisker barrel field of primary
somatosensory cortex. In the visual system, monocular deprivation in Old World monkeys
(Hendry and Jones 1986; Hendry and Miller 1996) and rats (Ribak and Robertson 1986) reduces
expression of GABA and GAD within ocular dominance columns associated with the deprived
eye. A decrease in GAD mRNA levels has also been found in deafferented dLGN of cats
(Arckens et al. 1998).
4. Choice of Model System
Many studies have shown that auditory inputs are introduced to LGN and carried to visual cortex
in blind animals (Chabot et al. 2008; Chabot et al. 2007; Doron and Wollberg 1994; Piche et al.
2004). Retinal inputs invade MGN in deaf mice (Hunt et al. 2005). The disadvantage of
studying deaf and blind animal models is that because the sensory organs are eliminated, it is
impossible to study cross-modal plasticity unless a sensory prosthesis is installed. During
recovery from sensory dysfunction, cross-modal inputs can interfere with processing of the
original sensory modality. Users of artificial cochleae may have undergone invasion of visual
inputs to auditory cortex prior to installation of the prosthesis, and it is then more difficult for
them to regain auditory ability (Kral and Sharma 2012; Lee et al. 2001). Our model system can
address this cross-modal plasticity in a manner that deaf/blind animal models cannot. Research
on cross-modal central plasticity can provide important information for understanding the
mechanism by which the original function is affected by cross-modal invasion and for design of
rehabilitative strategies after recovery from sensory dysfunction and brain injury.
Ferrets are an advantageous model for studying plasticity. The species of pigmented ferret we
visual research (Kelly et al. 1986; Linden et al, 1981. Moore et al. 1983; Stryker and Zahs 1983).
Ferrets are born with a more immature brain than many other mammalian species, including
monkeys and cats (Clancy et al. 2001; Gao and Pallas 1999; Herrmann et al. 1994), but in
adulthood they have well developed sensory pathways similar to those of cats (Law et al. 1988;
Zahs and Stryker 1988; Moore et al. 1983). Their thalamocortical projections do not reach cortex
until two weeks after they are born (Herrmann et al. 1994; Linden et al. 1981). The auditory
afferents reach the inferior colliculus but have not yet segregated into frequency bands at birth
(Brunso-Bechtold and Henkel 2005; Henkel et al. 2007). The eyelids and the ear canals of ferrets
open at 4 to 5 weeks after birth, providing an extended postnatal period for manipulating
development of the visual and auditory system. This long postnatal period of immaturity
provides an opportunity to create cross-modal rewiring. In our model system, neonatal dorsal
midbrain lesions on the day of birth cause visual afferents to project anomalously to MGN. The
recovered auditory cortex receives both residual auditory inputs and novel visual inputs. This
animal model is thus useful for studying cross-modal plasticity.
5. Specific aims of dissertation
Specific Aim 1 (Chapter 2): Do the residual auditory inputs and the ectopic visual
projections compete for limited auditory territory? After introducing anomalous visual inputs,
neurons in AC of cross-modal animals can respond to visual, auditory, or multisensory stimuli.
This implies that a cortical area originally representing one modality can be induced to process
information from two modalities. Previous anatomical research found that interhemispheric
projections between AC on the lesioned side and AC on the unlesioned side were shifted
medially. I hypothesize that the residual auditory and the ectopic visual inputs compete for
auditory cortical territory and that neurons within cross-modal AC are segregated by
modality.
Specific Aim 2 (Chapter 3): How is auditory function in auditory cortex affected by ectopic
visual invasion? I am also interested in how residual auditory function is affected by
reorganization and incorporation of visual processing circuitry. Given that visual inputs occupy
part of the originally auditory regions, and that visual neurons are intermingled with auditory
neurons, it is possible that the auditory function in cross-modal auditory cortex is impaired by
visual invasion. Therefore, I hypothesize that competition from ectopic visual inputs
compromises auditory function in cross-modal AC.
Specific Aim 3 (Chapter 4): What are the mechanisms underlying reorganization of
cross-modal auditory cortex? Inhibition plays an important role in establishing response properties
in neocortex (Allison et al. 1996; Sillito 1975; Sillito and Versiani 1977). Numerous studies have
shown that loss of inhibition is responsible for broadened tuning in sensory-deprived or –
deafferented animals. It is possible that inhibition is decreased in the cross-modal AC after
recovery from auditory deafferentation by midbrain damage. Alternatively, the coexistence of
auditory and visual neurons in cross-modal AC may result in an increase in inhibition in order to
prevent possible disruption by one modality of another. Therefore, I hypothesize that invasion
CHAPTER 2 COMPETITION AND CONVERGENCE BETWEEN AUDITORY AND
CROSS-MODAL VISUAL INPUTS TO PRIMARY AUDITORY CORTEX
by
Yu-Ting Mao, Tian-Miao Hua, and Sarah L Pallas
1. Abstract
Sensory neocortex is capable of considerable plasticity after sensory deprivation or damage to
input pathways, especially early in development. Although plasticity can often be restorative,
sometimes novel, ectopic inputs invade the affected cortical area. Invading inputs from other
sensory modalities may compromise the original function or even take over, imposing a new
function and preventing recovery. Using ferrets whose retinal axons were rerouted into auditory
thalamus at birth, we were able to examine the effect of varying the degree of ectopic,
cross-modal input on reorganization of developing auditory cortex. In particular, we assayed whether
the invading visual inputs and the existing auditory inputs competed for or shared postsynaptic
targets, and whether the convergence of input modalities would induce multisensory processing.
We demonstrate that although the cross-modal inputs create new visual neurons in auditory
cortex, some auditory processing remains. The degree of loss of auditory input to MGN was
directly related to the proportion of visual neurons in auditory cortex, suggesting that the visual
and residual auditory inputs compete for cortical territory. Visual neurons were not segregated
from auditory neurons, but shared target space even on individual target cells, substantially
increasing the proportion of multisensory neurons. Thus spatial convergence of visual and
auditory input modalities may be sufficient to expand multisensory representations. Together
these findings argue that early, patterned visual activity does not drive segregation of visual and
auditory afferents, and suggest that auditory function might be compromised by converging
visual inputs. These results inform possible ways in which multisensory cortical areas may form
during development and evolution. They also suggest that rehabilitative strategies designed to
sensory cortex may become substantially more multisensory after alteration of its input during
development.
Keywords: cross-modal plasticity, sensory substitution, cortical development, traumatic brain
injury, stroke
2. Introduction
It is well-documented that loss of sensory drive, whether as a result of sensory deprivation or
brain damage, can result in cortical plasticity, especially early in development. The changes in
circuitry that occur as a result of this reactive plasticity may help to restore function or may
instead prevent restoration of normal function. Although cortical plasticity can involve either
intra-modal or cross-modal plasticity, interference with normal function seems more likely to
occur as a result of ectopic, cross-modal invasion of the deafferented structure. For example,
loss of visual input can lead to auditory activation of visual cortex (Yaka et al. 2000) and loss of
auditory input can lead to cross-modal activation of the understimulated auditory cortex by
somatosensory or visual inputs (Bavelier and Neville 2002; Fine et al. 2005; Finney et al. 2001;
Hunt et al. 2006; Lomber et al. 2010; Neville 1990; Neville et al. 1983; Nishimura et al. 2000;
Sharma et al. 2007; Sterr et al. 2003). Cross-modal plasticity is known to interfere with the
effectiveness of subsequently implanted cochlear prostheses in humans (Lee et al. 2001; see
Sharma et al. 2009, for review). In order to promote restorative plasticity after sensory inputs are
compromised and to minimize interference from cross-modal inputs,it would be advantageous to
understand how information from existing and ectopic inputs is coordinated, and in particular
how cross-modal inputs affect the amount of territory devoted to the processing of the normal
Previous studies of sensory deafferentation or deprivation using animal models have
examined cross-modal plasticity mainly from the perspective of a complete loss of normal input,
such as bilateral enucleation or deafening by cochlear ablation. The disadvantage of using blind
or deaf animals to study reactive plasticity in sensory cortex is that the original sensory modality
can no longer be activated, preventing examination of how ectopic, cross-modal input affects
recovery of the original function, whether through natural means or by implantation of a sensory
prosthesis.
In this study, we instead employ an approach that brings both normal and cross-modal
information to sensory cortex from birth. We tested the hypothesis that cross-modal inputs
compete with normal inputs for cortical space. One possible outcome of competition is that the
smaller or less active input modality could be suppressed or taken over by the other Alternatively,
segregation of neurons with different response modalities could occur, reducing cortical space
available to each. A third possible outcome is that the cross-modal and the normal functions
could coexist within the same cortical territory, expanding multisensory processing, or perhaps
even converging onto single, multisensory neurons.
Using partial deafferentation of auditory thalamus in neonatal ferrets to examine how
establishment of auditory cortical territory is affected by invasion of cross-modal, visual
information, we find that, in addition to visual and auditory responses, multisensory responses
are present at a rate much higher than that seen in normal auditory cortex. These three response
types were not spatially segregated, suggesting that information carried by ectopic visual inputs
is not sufficient to induce segregation. Our results demonstrate that primary auditory cortex can
afferent pathways, and that multisensory function can be induced simply by experimental
convergence of two unisensory inputs. They provide insight into how multisensory cortex is
created on developmental and evolutionary time scales. Additionally, our findings provide a
more thorough understanding of the reorganization of an affected brain area after recovery from
sensory damage or deprivation, and have important implications for rehabilitative strategies in
patients with damage to sensory pathways.
Preliminary results from some of these experiments have been published previously in
abstract form (Mao et al. 2007).
3. Materials and Methods
Partial deafferentation of auditory cortex (AC) and invasion of ectopic visual inputs can be
produced in ferret kits if retinal axons are induced to invade auditory thalamus (MGN) (Sur et al.
1988) as a result of neonatal midbrain lesions. The cross-modal auditory cortex (XMAC) in
similarly-manipulated animals contains functional visual neurons (Roe et al. 1992; Sur et al.
1988; von Melchner et al. 2000). Auditory and multisensory responses were not reported in these
previous studies, perhaps because the aim was a complete deafferentation of MGN.
a) Animals
Data were obtained from 25 pigmented ferrets (Mustela putorius furo) aged 4 months or more
(ferrets reach full brain and body size at 16 weeks (Fox and Bell 1998)). Timed pregnant ferrets
were obtained from Marshall Farms (North Rose, NY) two weeks prior to parturition. Nursing
dams and kits were fed a high fat diet and kept on a 14h/10h light/dark cycle. Kits were weaned
in our colony. Non-lactating ferrets were fed Marshall Farms ferret diet and kept on a 12/12
light/dark cycle. Both male and female ferrets were included in the study. All protocols were
approved by the Institutional Animal Care and Use Committee (IACUC) at Georgia State
University and met or exceeded standards of care established by the USDA and the Society for
Neuroscience.
b) Neonatal surgery
Surgical procedures were similar to those described previously (Pallas et al. 1999). Ferret kits
were manipulated within 24 hr after birth. They were anesthetized by isoflurane (1-4%). All
surgeries were performed under sterile conditions. After a kit was anesthetized, the skull over the
midbrain was exposed and removed with a scalpel. The left superior colliculus and one or both
inferior colliculi were then lesioned to varying extents with a heat cautery, and the brachium of
the left inferior colliculus was severed with a scalpel blade. The incision was closed using either
6-0 prolene or surgical adhesive (VetBond, 3M, St. Paul, MN). After surgery, the kits were
given subcutaneous fluids and a respiratory stimulant (doxapram, 2 mg/kg, SQ) and warmed
under an incandescent lamp. Kits were observed carefully until they recovered from anesthesia,
and were returned to their dam after they became ambulatory. Analgesics (buprenorphine 0.05–
0.1 mg/kg bid) were given as needed to prevent postoperative pain.
c) Preparation for Electrophysiology
Electrophysiology experiments were done once ferrets reached adult size (>4 months of age).
Before induction of anesthesia, atropine (0.4 mg/kg SQ,) and doxapram (2 mg/kg, SQ) were
medetomidine (0.08 mg/kg IM). Dexamethasone (1mg/kg, IM) was given every 24 hr to prevent
brain swelling. Animals were intubated and the cephalic or femoral vein was cannulated.
Anesthesia was maintained with an IV solution of medetomidine (0.022 mg/kg/hr) and ketamine
(5 mg/kg/hr) in lactated Ringer’s with 5% dextrose (Bizley and King 2008; Bizley et al. 2005).
Atropine (0.06 mg/kg/hr, SQ) was given as necessary to counteract the bradycardia caused by
medetomidine. Animals were artificially respired using a small animal ventilator (SAR 830/P
ventilator, CWE Inc, Ardmore, PA). Vital signs including EKG, respiration rate, muscle tone,
withdrawal reflexes, end-tidal CO2, and SpO2 were monitored during the surgery and recordings
to ensure maintenance of adequate anesthesia. Body temperature was maintained at 38º C with a
heating pad. Pupils were dilated with atropine ophthalmic drops. Eyes were kept moist with
commercial artificial tears solution and protected with custom plano contact lenses (Conforma
Inc, Norfolk, VA). The head was stabilized in a stereotaxic device. After the scalp overlying
auditory cortex was incised and the muscle was retracted from the skull, two burr holes (at
coordinates A5.5 ±L1.5) were drilled for optic chiasm recording/stimulation electrodes. Two
tungsten rods with Teflon insulation (0.008 bare, 0.011 coated, A-M Systems, Inc., Carlsborg,
WA) connected to a preamplifier were lowered (8~10 mm) while recording responses to strobe
light stimulation until a depth yielding strong visual responses was reached. These tungsten rods
were then cemented to the skull and connected to a stimulus isolation unit (BAK Electronics, Inc,
Mount Airy, MD). A 0.8~1.0 cm diameter craniotomy was drilled over the auditory cortex and
the suprasylvian and pseudosylvian sulci were exposed.
Recording sites: The ferret AC is located on the middle ectosylvian gyrus, bounded
above by the anterior and posterior arms of the suprasylvian sulcus (sss) and below by the
to primar unlikely First, we very supe next loca inverted the banks recording cannot ex ectosylvi The dura Fair Law was clean right ear
d) Extra
The corti each reco Bowdoin stimuli. possible 2000 µm
ry auditory c
to impinge o
avoided the
erficial given
ation in the m
parabola is s
s of the sulci
g sites were
xclude the po
ian gyrus, wh
a was remove
wn, NJ) in ste
ned of tissue
bar was then
acellular rec
ical surface w
ording electr
n, ME) was u
Penetration
while avoidi
m under the p
cortex (A1) a
on multisens
e regions clo
n that we rec
map. Further
such that inc
i. These fac
in the supras
ossibility tha
here
higher-ed and AC w
erile saline to
e and a meta
n released to
cording
was photogr
rode penetrat
used to inves
locations we
ing sulci and
pial surface u
and anterior
sory regions
se to the sul
corded the fi
r, the electro
creasing reco
ctors taken to
sylvian territ
at a few of o
-level auditor
was covered
o protect its
l bracket wa
o allow acces
raphed with a
tion. A glas
stigate neuro
ere chosen to
d blood vess
using a hydra
auditory fie
of the sulci
ci. In additi
irst unit in ea
de angle com
ording depth
ogether argu
tory, althoug
our recording
ry fields hav
by either ste
surface from
as cemented
ss to the ear
a digital cam
ss-coated tun
onal activity
o sample ran
els. The ele
aulic microd
ld (AAF) (B
surrounding
ion, our reco
ach electrod
mbined with
h would mov
e that it is ve
gh we canno
g sites were
ve been desc
erile saline o
m desiccation
on the skull
for auditory
mera in order
ngsten micro
in AC in res
ndomly from
ectrode was l
drive (Kopf I
Bizley et al. 2
g AC for sev
ording depths
de pass then m
h the shape o
ve away from
ery unlikely
ot exclude th
located in th
cribed (Bizle
or 2% Agar (
n. The right
to hold it in
y stimulation
r to record th
oelectrode (1
sponse to au
m as many sit
lowered in 5
Instruments,
2005) and w
eral reasons
s were gener
moved on to
f AC as an
m and not tow
that our
e possibility
he posterior
ey et al. 2005
(Fisher Scie
t side of the s
n position. T
n.
he location o
-2 M , FH
uditory and v
tes within A
5 µm steps up
Once the first unit in each electrode pass was isolated and characterized, another recording
location was selected. Most units were isolated within 800 um of the pial surface.
Sensory stimuli: For each penetration, bars of light from a pantoscope and white noise
from a loudspeaker were used to search for responsive neurons. The loudspeaker was placed at a
45° angle between the right side and the front of the animal at a distance of approximately 10 cm.
Auditory searching stimuli were white noise bursts (5 ms ramp, 40-100 ms duration) with a
sound intensity of 60-80 dB SPL, as measured by a sound level meter (model 407764, Extech
Instruments, Waltham, MA). After a responsive neuron was found, computer-generated auditory
(noise or tones) and visual stimuli (moving or flashing bars of light) were used for testing
responses. The speaker was replaced with a calibrated earphone. The earphone was placed in the
pinna at the entrance to the ear canal and used to generate noise bursts or pure tone sounds in
closed field. (ER-2 insert earphone, Etymotic Research, IL). The earphone was calibrated with a
microphone (ER-7C probe microphone system, Etymotic Research, IL) via Sigcal software
(Tucker-Davis Technologies, Alachua, FL). The normalized file generated by Sigcal was used to
correct any non-linearities in the earphone output when sound was given. For assessing the
responses of single units isolated in each penetration, auditory stimuli were generated by TDT
System II hard- and software (Tucker-Davis Technologies, Alachua, FL) and visual stimuli were
synthesized and delivered by a VSG card (Cambridge Research Systems Ltd, Kent, England).
Light stimuli included moving bars or gratings at eight orientations moving in either direction,
presented on a computer screen ~ 40 cm distances from the eyes. Bipolar electrical stimulation of
the optic chiasm was applied (single pulses at 0.5-1 mA, 60 µs duration) in addition to light
e) Electrophysiological data analysis
Neural responses were amplified (BAK Electronics, Inc, Mount Airy, MD), filtered (500 Hz to 5
kHz), and monitored on a digital oscilloscope (Hameg Instruments, Mainhausen, Germany).
Responses to 10-15 stimulus presentations were gathered from each recording site and digitized
at 25 kHz. The evoked responses were averaged and normalized to a sample of spontaneous
activity recorded 50 ms before each trial. The recording continued for 1-2 days, after which the
animal was deeply anesthetized with sodium pentobarbital (65 mg/kg) for humane euthanasia
and harvesting of brain tissue for histological examination.
For each electrophysiological data point, Brainware software (Tucker-Davis
Technologies Inc., Alachua, FL) was used off-line to isolate extracellularly recorded spikes
derived from single neurons by their waveform. Artifact rejection was set in Brainware to extract
biphasic action potential candidates with both peaks exceeding background noise level. Spikes
with similar shape and duration were shown as clusters in the data-sorting window. Post-stimulus
time histograms (PSTHs) of the selected single units were generated using the same software
package. The mean and standard error of the number of spikes to each stimulus presentation
were calculated after subtracting spontaneous activity. Response latencies were determined by
the time between stimulus presentation and the time of the first bin in the PSTH that reached at
least 20% above background firing rate. Multisensory units were defined either as neurons that
responded both to visual and auditory stimuli or as neurons that only responded to one modality
but could be significantly modulated by stimulation with the other modality (Stein et al. 1993).
sweep (obtained from the PSTHs) as a response to different stimulus modalities using Student’s
t-test (p<0.05). The proportion of response types was compared across groups.
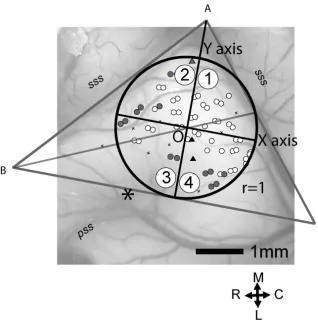
For calculating the spatial distribution of response types, the area of each AC was
normalized to a standard circle with a radius of 1. The locations of recorded units were
reconstructed on this normalized AC. In order to analyze the distribution of different neuron
types in AC, we divided AC into four quadrants numbered 1 to 4 as seen in Figure 2.1. The
quadrants were not intended to correspond to particular auditory cortical areas, although
quadrants 2 and 3 overlap more with the anterior auditory field (AAF) and quadrants 1 and 4
overlap more with primary auditory cortex (A1). Two lines were drawn along the anterior and
posterior arms of the suprasylvian sulcus to form angle A. The third line was drawn just above
the tip of the pseudosylvian sulcus and perpendicular to the dividing line of angle A. The center
of the internally tangent circle (point 0) was defined as the intersection of the dividing lines of
angle A and angle B.
Because the shape of the AC in each individual is unique, and the location of recording
sites differed somewhat across animals, we examined whether pooling data from different
animals into one polar plot would bias the data. We performed a heterogeneity Chi-square
analysis to test the homogeneity of data from each group. Heterogeneity Chi-square is a
statistical test based on the premise that if the samples are homogeneous, then the value of χ2sum
should be close to the value of χ2pooled. Therefore, the heterogeneity Chi-square value is
designated (χ2het= χ2sum -χ2pooled). The null hypothesis should be rejected if there is a large χ2het
(for details, see Sheskin 2004). If the value of the sum of Chi-squares from each sample is not
the data can be grouped. Applied to our data, the test showed that the electrode penetrations in
the four quadrants of normal AC were homogenously distributed (p>0.05). The same was true
for small lesion and large lesion groups (p>0.05). Therefore, data from all ACs in each group
were pooled into one polar plot. A Chi-square analysis was then applied to determine whether
recorded neurons were randomly distributed across quadrants independent of their response type.
In cases where the distribution was not random (p<0.05), an Analysis of Residuals (R value) was
calculated to show which quadrant(s) contained the unexpected distribution.
To examine whether neurons with similar responses were clustered, we calculated the
average distance between recording sites by translating X and Y values obtained from
normalizing AC to polar coordinates on the standard circle using Microsoft Access database
software. The distance between each pair of single units was calculated and exported to a
spreadsheet. The average distances from each single unit to other auditory, visual or
multisensory units were calculated. Then we compared the mean of average distance between
pairs across groups.
Electrophysiological data were statistically analyzed using Sigmastat software (Systat
Software Inc, Chicago, IL) and plotted with Sigmaplot (Systat Software Inc, Chicago, IL). A one
way ANOVA for multiple groups was used. A Tukey post hoc test was used for groups that had
uneven numbers, and a Fisher’s LSD post hoc test was used for groups that had even numbers of
members. A Mann-Whitney U test for non-normally distributed data was used for two group
comparisons. Means are given with standard errors of the mean (± SEM) throughout.
Magnetic Resonance Imaging (MRI) was performed in some lesioned ferrets to obtain an
assessment of the midbrain lesions prior to electrophysiological recording. Atropine (0.4 mg/kg
SQ) and doxapram (2 mg/kg SQ) were given 5 min prior to sedation. Then, medetomidine (1
mg/kg, IM) and diazepam (2 mg/kg, IM) were given to sedate the animal. Animals were put into
an MRI cradle with a heating pad underneath to maintain body temperature. End-tidal CO2,
SpO2, pulse rate, respiration rate, and body temperature were monitored during the entire process.
MRI scanning of the midbrain was normally finished within 30 min. Animals were taken out of
the cradle and given atipamezole (0.5 mg/kg, IM) to reverse the effects of the medetomidine.
Animals were then continuously monitored over the next 1 to 2 hr before being returned to the
colony to ensure that they were completely recovered from the drugs.
ii) Histology:
After electrophysiology, animals were deeply anesthetized with sodium pentobarbital (65 mg/kg)
for euthanization and perfusion with phosphate-buffered saline (PBS) followed by 2-4%
paraformaldehyde in 0.1 M PB. Brains were extracted, postfixed in 4% paraformaldehyde in 0.1
M phosphate buffer (PB) for 24 hr, and stored in 30% sucrose in 0.1 M PB at 4º C. After the
tissue was infiltrated by the sucrose solution, it was sectioned frozen at 50 µm in the coronal
plane for reconstruction of lesions. A series of sections at 200 µm intervals was stained for Nissl
substance using cresyl echt violet.
iii) Analysis:
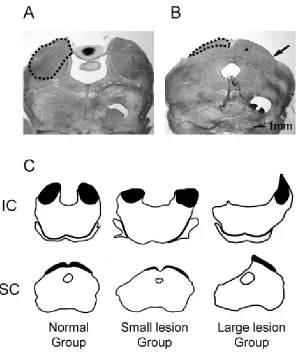
The size of the residual central nucleus of the inferior colliculus (ICc) and the superficial layers
of the superior colliculus (sSC) in each animal’s midbrain was measured from Nissl stained
MicroImaging, Inc., Thornwood, NY). The borders of ICc and sSC (areas indicted by the dashed
line in Figure 2A, B, and dark areas in Figure 2C) were very clear on our Nissl stained sections.
The volume of sSC and ICc was calculated as the sum of each measured areas multiplied by 200
µm. Proportions of residual midbrain area and volume in the lesioned animals were calculated by
comparison with an average midbrain volume derived from five normal animals. Lesioned
animals were sorted into small and large lesion groups as determined by these measurements
(Figure 2.2).
4. Results
Twenty-five ferrets in total were used in this study. Ten were entered in the normal group and
15 received neonatal lesions leading to cross-modal plasticity. Below we characterize and
compare the response properties of the 401 AC neurons recorded in the normal group and the
573 AC neurons recorded in the lesioned group.
a) Normal AC contains primarily auditory responses plus rare multisensory responses
Normal animals were used in the experiments as a negative control for the effects of the
midbrain lesion. Although primary sensory cortices are traditionally defined as brain areas that
respond only to a single sensory modality, recent research has challenged this view by reporting
the existence of multisensory neurons and neurons responding to other modalities in primary
sensory cortices. Bizley and colleagues have reported that primary auditory cortex in ferrets does
contain some auditory/visual bisensory and some visual neurons (Bizley et al. 2007). In order to
investigate whether and to what extent primary auditory cortices (A1 and AAF) in normal ferrets
vivo extracellular recording. We defined auditory neurons and visual neurons as those that
responded to only one modality. Multisensory neurons were defined as those that either
responded to both modalities or responded to one modality but were significantly modulated by
stimulation from the other modality (criterion of p<0.05, t-test on number of spikes to single vs.
bimodal stimuli, 10 trials or in some cases 15 trials, data obtained from PSTHs) (see Meredith
and Stein 1986). We found that 11% of the 401 neurons recorded in AC of normal ferrets were
multisensory. These multisensory neurons responded both to sound stimuli and to electrical
stimulation of the optic chiasm (n=45, Fig 2.3A), but not to stimulation by light. No visual-only
neurons were found in our sample of normal animals.
b) XMAC contains visual, auditory, and multisensory response types
We next tested whether auditory responses remain in AC of lesioned animals and whether the
ectopic visual inputs to MGN were associated with an increased proportion of multisensory or
visual-only units. We predicted that XMAC’s residual inputs from auditory areas would
preserve auditory responsiveness, despite earlier reports to the contrary (Roe et al. 1992; Sur et al.
1988). Callosal connections between XMAC and AC in the unlesioned hemisphere exist (Pallas
et al. 1999), and the inferior colliculi are incompletely lesioned in many cases. These inputs
could confer auditory responses on XMAC. In support of this prediction, our data showed a high
proportion of auditory neurons in XMAC despite the presence of ectopic visual responses.
Multisensory neurons were also found. In all of the lesioned animals considered together, the
relative proportion of auditory-only neurons was 56%, the proportion of multisensory neurons
was 32%, and the proportion of visual-only neurons (optic chiasm and/or light driven) was 12%
existence of auditory neurons in XMAC reveals that the neonatal midbrain lesions and ectopic
visual inputs do not eliminate or suppress the auditory function of AC. The presence of a higher
than normal proportion of multisensory neurons in XMAC suggests that auditory and visual
inputs are more likely to converge in XMAC than in normal AC.
c) Continuous and categorical differences in response type occurred by altering the extent
of midbrain sparing
The above finding that auditory and visual responses can be made to coexist in XMAC allowed
us to address the relationship between the two response types in more detail, and in particular to
examine how the induction of visually-responsive areas in auditory cortex would affect normal
auditory processing. In patients with a sensory deficit or damage that deafferents a brain area,
invasion of cross-modal inputs often occurs to varying extents, and at some point may become
maladaptive. We wished to determine whether progressively increasing the extent of visual
invasion of XMAC would result in competition (intermodal suppression) or cooperation
(multimodal convergence) between modalities. Given previous reports that auditory responses
are absent in XMAC (Roe et al., 1992), we wanted to test whether increasing levels of visual
input activity would suppress or eliminate auditory responses. Such a finding could explain why
we observed auditory responses in our data set whereas none were found in the Roe et al. (1992)
study in which very large lesions were made.
In order to investigate the effect that increasing degrees of invasion of ectopic visual
inputs would have on auditory responsiveness in AC, we measured the midbrain lesion size in
each ferret using histological techniques, and compared this measure with the relative
lesioned animals by comparing the volume of the left and right central nucleus of the inferior
colliculus (ICc) and the left and right superficial superior colliculus (sSC) in each lesioned
animal to that averaged across five normal animals used as a standard of comparison (cf. Figure
2.2, Table 2.1).
Next, it was necessary to demonstrate that increasing the lesion size would affect the
relative proportions of auditory, visual, and multisensory neurons in XMAC. We found that
midbrain lesion size was correlated with the proportion of auditory and visual response types in
an interesting way. In general, overall lesion size was correlated with the proportion of visual
units and inversely correlated with the proportion of auditory units (Fig 2.4A, D). There was a
tight relationship between spared sSC size and visual responsiveness (r = -0.7, p = 0.006) and a
correlation between spared ICc size and visual responsiveness (r = -0.48, p= 0.085; compare Figs
2.4B and C). These results suggest that establishment of visual neurons in XMAC relies more
on damage to visual midbrain than to auditory midbrain. For auditory responsiveness, the
correlations with total midbrain size, sSC size, and ICc size were similar to each other (Figs
2.4D-F). These data show that residual sSC volume predicts the relative proportions of visual
and auditory neurons, whereas ICc volume is predictive only of the proportion of auditory
neurons, demonstrating that the amount of retinal target area lost (SC lesion) is crucial for
determination of neuron types in XMAC when both ICc and sSC are lesioned. It was also
notable that even complete ablation of left IC did not eliminate auditory responses in XMAC
(Table 2.1). We did not find any correlation between the proportion of multisensory units and the
The relationship between lesion size and proportion of auditory units (Fig 2.4D) appeared
roughly linear, with increasing lesion size correlating with a decreasing proportion of auditory
responses. In terms of visual responsiveness, however, as may be predicted by examination of
Figure 2.4A and 2.4B, there was evidence of an exponentially decreasing relationship (Fig 2.4A,
r=0.8, p=0.0007; Fig 2.4B, r=0.88, p<0.0001, exponential fit) or perhaps a categorical response
to lesion size rather than a progressive, linear response.
XMAC contained light-responsive neurons (that is, neurons that responded to light as
well as to optic chiasm stimulation) only in animals in which most of the left midbrain was
ablated (less than 10% residual left midbrain). In animals with more than 10% residual left
midbrain there were no light-responsive neurons. We used this categorical distinction to divide
the cases into a large lesion or small lesion group, respectively, and conducted further analyses
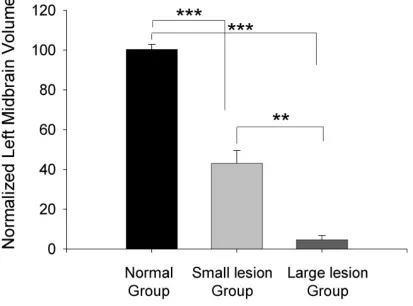
according to these categories. We performed statistical analysis to examine whether small vs.
large lesion groups have significantly different residual midbrain sizes. We found that the spared
left midbrain size of animals in both the large (5.4± 1.76%, n=5) and small lesion groups (43.7±
5.34%, n=10) was significantly smaller than that of the normal group (ANOVA, p<0.001, Fig 2.
5). The spared midbrain size in the large lesion group was also significantly reduced compared
to that in the small lesion group (Tukey post hoc test, p<0.001), allowing us to consider these
groups along with the unlesioned group as distinct categories for statistical analyses.
i) Responsiveness to light requires minimal sparing of visual midbrain
In order to determine the relationship between lesion group membership and distribution of
response types, we calculated the relative proportions of auditory, visual, and multisensory