https://doi.org/10.5194/hess-21-3307-2017 © Author(s) 2017. This work is distributed under the Creative Commons Attribution 3.0 License.
The analogue method for precipitation prediction: finding better
analogue situations at a sub-daily time step
Pascal Horton1,2, Charles Obled3, and Michel Jaboyedoff1
1Institute of Earth Sciences, University of Lausanne, Lausanne, Switzerland
2Oeschger Centre for Climate Change Research and Institute of Geography, University of Bern, Bern, Switzerland 3Laboratoire d’étude des Transferts en Hydrologie et Environnement (LTHE), Université de Grenoble-Alpes,
Grenoble, France
Correspondence to:Pascal Horton ([email protected]) Received: 18 May 2016 – Discussion started: 30 May 2016
Revised: 12 May 2017 – Accepted: 20 May 2017 – Published: 4 July 2017
Abstract. Analogue methods (AMs) predict local weather variables (predictands) such as precipitation by means of a statistical relationship with predictors at a synoptic scale. The analogy is generally assessed on gradients of geopotential heights first to sample days with a similar atmospheric circu-lation. Other predictors such as moisture variables can also be added in a successive level of analogy.
The search for candidate situations similar to a given tar-get day is usually undertaken by comparing the state of the atmosphere at fixed hours of the day for both the target day and the candidate analogues. This is a consequence of using standard daily precipitation time series, which are available over longer periods than sub-daily data. However, it is un-likely for the best analogy to occur at the exact same hour for the target and candidate situations. A better analogue situa-tion may be found with a time shift of several hours since a better fit can occur at different times of the day. In order to assess the potential for finding better analogues at a different hour, a moving time window (MTW) has been introduced.
The MTW resulted in a better analogy in terms of the at-mospheric circulation and showed improved values of the analogy criterion on the entire distribution of the extracted analogue dates. The improvement was found to increase with the analogue rank due to an accumulation of better analogues in the selection. A seasonal effect has also been identified, with larger improvements shown in winter than in summer. This may be attributed to stronger diurnal cycles in summer that favour predictors taken at the same hour for the target and analogue days.
The impact of the MTW on the precipitation prediction skill has been assessed by means of a sub-daily precipitation series transformed into moving 24 h totals at 12, 6, and 3 h time steps. The prediction skill was improved by the MTW, as was the reliability of the prediction. Moreover, the im-provements were greater for days with heavy precipitation, which are generally related to more dynamic atmospheric sit-uations in which the timing is more specific and for which fewer records are available in the meteorological archive.
The improvements of the analogy criterion and the perfor-mance scores on precipitation were both found to be higher for MTWs with a smaller time step of 3 h. A 3 h MTW pro-vides 8 times more candidate situations even though they are not fully independent. Since the MTW provides additional situations to the pool of possible analogues, it can be consid-ered as an inflation of the meteorological archive. Because this technique is simple and easily applicable, it should be considered for several applications in different contexts, such as operational forecasting or climate-related studies.
1 Introduction
circu-lation or other synoptic predictors. Referred to as the pre-dictand, the local weather variables of interest which were observed at the analogue dates are used to construct a prob-abilistic prediction for the target day (Duband, 1970; Zorita and Storch, 1999). Multiple variations of this method have been reported (Ben Daoud et al., 2016). AMs are used for op-erational precipitation forecasting in the context of weather forecasting (e.g. Hamill and Whitaker, 2006; Hamill et al., 2015; Ben Daoud et al., 2016), flood forecasting (e.g. Bon-tron and Obled, 2005; García Hernández et al., 2009; Bliefer-nicht, 2010; Marty, 2010; Marty et al., 2012; Horton et al., 2012), and hydropower production (e.g. Desaint et al., 2008), as well as for precipitation downscaling from a climate per-spective (e.g. Radanovics et al., 2013; Chardon et al., 2014; Dayon et al., 2015). AMs can provide multivariate predic-tions which are physically consistent (Raynaud et al., 2016). Their spatial transferability is analysed in Chardon et al. (2014) and Radanovics et al. (2013), and their temporal transferability has been discussed in recent studies for past or future climates (Dayon et al., 2015; Caillouet et al., 2016). The method requires two different archives. The first is a meteorological archive describing the state of the atmosphere at a synoptic scale, such as reanalysis datasets, at different hours of the day. The second is an archive of the target vari-able to be predicted, which is usually standard daily precip-itation totals from 06:00 to 06:00 UTC the following day ei-ther at a target station or integrated over a target catchment. Obviously, the period to be used is limited to the smallest period common to the two archives.
Ruosteenoja (1988) and Van Den Dool (1994) analysed the influence of the length of the meteorological archive on the quality of the analogy. They highlighted a three-way rela-tionship among the quality of the analogy, the archive length, and the size of the spatial domain (or degrees of freedom), and determined that errors increase with a larger domain but decrease with a longer archive. For that reason, limited spa-tial windows are always considered when searching for ana-logues, and the archive length is maximised.
Therefore, due to the availability of long precipitation archives at a daily time step that have no equivalent at a finer resolution, AMs are usually implemented on a daily ba-sis. Given the cumulative aspect of the predictand, the cor-responding meteorological situation is characterised by sev-eral predictors taken at different but fixed hours of the day, and the analogue situations are assessed by comparing these same predictors at the same fixed hours of the day. However, it can be expected that the best analogy of the synoptic situ-ations does not occur systematically at the same time of the day and that better candidates can be found by shifting to different hours. With this assumption, a moving time win-dow (MTW) was introduced to allow the search for candi-dates at different hours of the day. Previous tests have shown the benefit, in terms of analogy criterion values, of searching for analogue synoptic situations at a finer time step, although
such research did not assess the impact on the prediction skill of a specific predictand (Finet et al., 2008).
Other possibilities exist for increasing the prediction skill of the AMs. A classical approach is to add new predictors or new successive levels of analogy (e.g. Bontron, 2004; Hor-ton, 2012; Ben Daoud et al., 2016; Caillouet et al., 2016). AMs can also be combined with other methods (e.g. Chardon et al., 2017). Another possibility is to use a global optimisa-tion technique, such as genetic algorithms, in order to bet-ter optimise the method and to add new paramebet-ters (Hor-ton et al., 2017a, b). However, the MTW technique is not in competition with other approaches and can be combined with them.
The outline of this paper is as follows. Section 2 presents the context of the study as well as the data and methods, in-cluding the proposed MTW technique. The benefits of intro-ducing an MTW are assessed first regarding the improvement of the analogue date selection (Sect. 3.1) and then in terms of precipitation prediction skill (Sect. 3.2). Finally, the re-sults are discussed in Sect. 4, and the conclusions are found in Sect. 5. A list of the acronyms and their definitions is pro-vided in Appendix A.
2 Data and methods 2.1 Study area and data
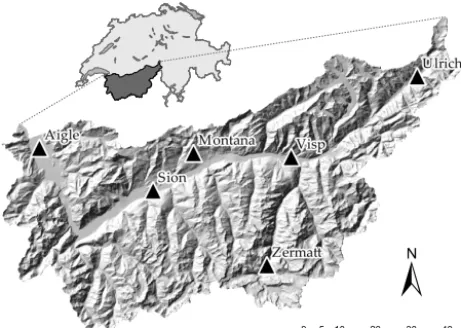
The study area is the upper Rhône catchment in Switzerland. The precipitation time series were obtained from six auto-matic weather stations, Ulrichen, Zermatt, Visp, Montana, Sion, and Aigle (Fig. 1), that are subject to various mete-orological influences (Horton et al., 2012). The data were available at an hourly time step for 29 years (1982–2010) and were also obtained at a standard daily time step of 06:00 to 06:00 UTC the following day for 50 years (1961–2010). Due to the low density of weather stations with high tem-poral resolution and long archives, no spatially aggregated rainfall was processed.
Figure 1. Position of the six weather stations of interest (Aigle, Montana, Sion, Ulrichen, Visp, and Zermatt) in the upper Rhône catchment in Switzerland.
MERRA-2 is built by assimilating observations at higher lev-els and from more sensors including satellite data, but it is more limited in time (1980–present). It is of interest to as-sess the relevance of an MTW with these two datasets be-cause they represent different types of products. The spe-cific advantages of ERA-20C are that it allows for testing an MTW with a 3 h time step, and it covers a long period. On the contrary, MERRA-2 has a higher spatial resolution and can be expected to be more accurate at higher levels of the atmosphere. The variables extracted from these datasets were geopotential heights at 500 hPa (Z500) and 1000 hPa (Z1000), the total precipitable water (TPW), and the relative humidity at 850 hPa (RH850).
2.2 The considered analogue methods
The first considered AM is based on the analogy of atmo-spheric circulation only (Table 1; Obled et al., 2002; Bon-tron and Obled, 2005). Before searching for analogue situ-ations for a target day, seasonal stratification is conducted through preselection of the potential candidates for analogy. The search is restricted to days within a 4-month window centred on the target date for every year of the archive. The similarity of the atmospheric circulation of the target date with every day of the preselection is assessed by processing the Teweles and Wobus (1954) score (S1), which is a com-parison of gradients of geopotential heights over a particular spatial window and at certain hours:
S1=100
m X
i
|1zˆi−1zi|
m X
i
max(|1zˆi|,|1zi|)
, (1)
where1zˆi is the geopotential height difference between the ith pair of adjacent points from the grid of the target
situa-Table 1.Parameters for the reference method on the atmospheric circulation (2Z). The first column shows the level of analogy (0 for preselection). The following columns show the meteorological vari-able and its hour of observation, the criterion used for the current level of analogy, and the number of analogues.
Level Variable Hour Criterion No.
0 ±60 days around the target date
1 Z1000Z500 12 h24 h S1 N1
Table 2.Parameters of the reference method with moisture vari-ables (2Z-2MI). The conventions are the same as those in Table 1.
Level Variable Hour Criterion No.
0 ±60 days around the target date
1 Z1000Z500 12 h24 h S1 N1
2 TPW
∗
RH850 12 h
RMSE N2
TPW∗RH850 24 h
tion,1zi is the corresponding geopotential height difference
in the candidate situation, andmis the number of pairs of ad-jacent points in the grid. The differences are processed sep-arately in both directions. With smallerS1 values, there is
greater similarity in the pressure fields.
The predictor variables extracted from reanalysis datasets are considered at different hours of the day. Based on Bon-tron and Obled (2005), geopotential heights are compared at 1000 hPa (Z1000) at 12:00 UTC and at 500 hPa (Z500) at 24:00 UTC. The time of the day for which the predictors are selected has a significant influence (Bontron, 2004).
Then,N1dates with the lowest values of S1 are
consid-ered as analogues to the target day, whereN1 needs to be
calibrated (Sect. 2.3). Finally, the daily observed precipita-tion amount of the corresponding dates provide the empirical conditional distribution considered as the probabilistic pre-diction for the target day. This method based on two geopo-tential height fields is referred to as 2Z.
The second reference method (2Z-2MI, Table 2; Bontron and Obled, 2005) adds a subsequent level of analogy with moisture variables, which are compared by means of the root mean square error (RMSE) criteria:
CRMSE=
v u u t 1
n n X
i=1
(vˆi−vi)2, (2)
wherevˆi is the ith predictor value from the grid of the
tar-get situation,vi is the corresponding observed value in the
[image:3.612.330.524.238.329.2]with the relative humidity at 850 hPa (RH850) at 12:00 and 24:00 UTC (Bontron, 2004). When adding a second level of analogy,N2dates are subsampled from theN1analogues on the atmospheric circulation, resulting in a smaller number of analogue situations. Moreover, when a second level of anal-ogy is added, a higher number ofN1analogues is kept on the
first level.
More complex AMs exist with additional predictors (e.g. Horton, 2012; Ben Daoud et al., 2016; Caillouet et al., 2016). The MTW can also be applied to these; however, it is eas-ier to interpret the impact of the MTW by using more basic methods.
2.3 Calibration of the analogue method
AMs rely on parameters that need to be defined for every level of analogy. Here, the selection of the meteorological variables used as predictors, as well as their corresponding pressure level and hour of the day, was considered to be identical to those used in methods 2Z (Table 1) and 2Z-2MI (Table 2) described above. The parameters calibrated in this study are listed below.
– The spatial windows are the domains in which the pre-dictors are compared. A spatial window is specific to each level of analogy; thus, its extent differs among cir-culation and moisture variables.
– There is an optimal number of analogue situations for every level of analogy.
The semi-automatic sequential procedure discussed by Bon-tron (2004) was used to calibrate the AM (Radanovics et al., 2013; Ben Daoud et al., 2016). The AtmoSwing optimiser software (Horton, 2017) was used to perform the calibration. The analogy levels (e.g. the atmospheric circulation or mois-ture index) are calibrated sequentially. The procedure, as de-fined by Bontron (2004), is described below.
1. For every level of analogy, the following steps are taken: a. First, the most skilled unitary cell of the predictor data is sought over a large domain. Every point or cell of the full domain is jointly assessed on the pre-dictors of the current level of analogy.
b. From this most skilled point, the spatial window is expanded by successive iterations in the direction of greater performance gain. The spatial window increases until no improvement is reached. c. The number of analogue situationsN1, which was
initially set to an arbitrary value, is then reconsid-ered and optimised for the current level of analogy. 2. A new level of analogy can then be added based on other variables such as the moisture index at chosen pressure levels and hours of the day. The number of analogues for the next level of analogy,N2, is initiated at a chosen
value. The procedure starts again from step 1 (calibra-tion of the spatial window and the number of analogues) for the new level. The parameters calibrated on the pre-vious analogy levels are fixed and do not change. 3. Finally, the numbers of analoguesN1 andN2 for the
different levels of analogy are reassessed. This is per-formed iteratively by varying the number of analogues of each level in a systematic manner.
The calibration is performed in successive steps and aims at minimising the objective function described below (CRPS; Eq. 3). Except for the number of analogues, previously cal-ibrated parameters are generally not reassessed. More ad-vanced techniques, such as those using genetic algorithms (Horton et al., 2017a, b), exist but are beyond the scope of the present study.
The 29-year hourly precipitation dataset was divided into a calibration period (CP) and a validation period (VP) in or-der to assess the robustness of the proposed improvements on independent data. The selection of the VP was evenly dis-tributed over the entire series (Ben Daoud, 2010) to reduce potential biases related to trends linked to climate change or to evolution in the measurement techniques. Thus, 1 out of every 5 years was selected for validation, which represents a total of 6 years for the VP and 23 years for the CP.
The continuous ranked probability score (CRPS; Brown, 1974; Matheson and Winkler, 1976; Hersbach, 2000) is often employed to assess the performance of AMs (e.g. Bontron, 2004; Bontron and Obled, 2005; Ben Daoud et al., 2008, 2016; Horton et al., 2012; Marty et al., 2012; Radanovics et al., 2013; Chardon et al., 2014; Junk et al., 2015; Caillouet et al., 2016). This allows for evaluation of the predicted cu-mulative distribution functionsF (y)of the precipitation val-uesy from analogue situations compared with the observed valuey0; a better prediction has a smaller score. This score is defined as
SCRPS=
+∞ Z
−∞ h
F (y)−H (y−y0)i
2
dy, (3)
whereH (y−y0) is the Heaviside function, which is null wheny−y0<0 and has the value of 1 otherwise.
2.4 The moving time window approach
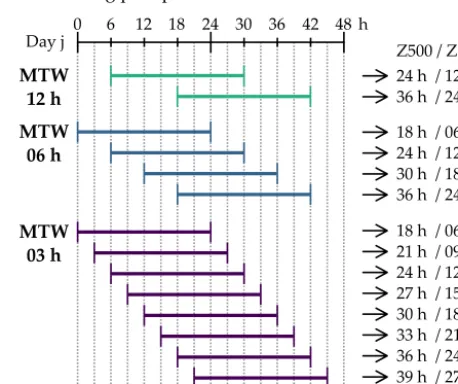
only at the same time (12:00 and 24:00 UTC) but also at other hours by allowing a time shift, according to the temporal res-olution of the predictor (Fig. 2). The ERA-20C dataset was used here to test an MTW with 12, 6, or 3 h time steps, which are referred to as 12 h MTW, 6 h MTW, and 3 h MTW, re-spectively. Thus, the candidates are 2 (12 h MTW), 4 (6 h MTW), or 8 (3 h MTW) times as many as in the conventional approach even though they are not fully independent.
The target situations and their corresponding observed pre-cipitation values do not change. The predictions are assessed on the exact same precipitation time series for both the MTW and the conventional approach so that the performance scores can be directly compared. However, in order to assess the benefit of searching for analogue situations at a sub-daily time step for quantitative precipitation prediction, an appro-priate precipitation archive is required. On the basis of the hourly time series (Sect. 2.1), 24 h totals were processed at time steps matching the MTW by building moving 24 h to-tals for the period 1982–2010, for example, starting at 00:00, 03:00, . . . , 21:00 UTC instead of 06:00 UTC as for the stan-dard archive.
3 Results
The considered AMs were applied to both ERA-20C and MERRA-2 datasets. Most of the results are presented for the ERA-20C dataset because it allows for testing a 3 h MTW, al-though similar conclusions can be found by using MERRA-2. The impact of an MTW approach was assessed on the two bases given below.
– Original parameters: the AMs were initially calibrated for each station based on the conventional fixed 24 h ap-proach. Then, the MTW was introduced into the AMs, but the parameters (spatial windows and number of ana-logues) were not reassessed. The analogy was then iden-tical, except for the fact that the MTW had more candi-dates at disposal.
– Recalibrated: the parameters of the AMs were re-assessed after the introduction of the MTW at different time steps. Indeed, one can assume that the introduc-tion of the MTW might change the optimum value of some parameters (different spatial windows and num-ber of analogues). The calibration (Sect. 2.3) was then reprocessed to adapt the AM parameters to the new in-formation available through the MTW. The main dif-ference was the increase in the optimal number of ana-logues to retain, which is discussed in Sect. 4.2. The MTW is expected to affect both the selection of ana-logue dates and the prediction skill. Both are analysed sep-arately hereafter. The results are presented for the Ulrichen station, but were similar for all other stations.
0 6 12 18 24 30 36 42 48 Day i0 6 12 18 24 30
Target day
Candidate situations allowing a moving time window 24h moving precipitation
0 6 12 18 24 30
Candidate situation in the conventional approach
Day j
Day j
Daily precipitation Daily precipitation
24 h / 12 h
24 h / 12 h
18 h / 06 h 36 42 48
36 42 48
Corresponding predictors
h h h
24 h / 12 h 30 h / 18 h 36 h / 24 h 24 h / 12 h 36 h / 24 h
18 h / 06 h 21 h / 09 h 24 h / 12 h 27 h / 15 h 30 h / 18 h 33 h / 21 h 36 h / 24 h 39 h / 27 h Z500 / Z1000
Z500 / Z1000
Z500 / Z1000
MTW 12 h MTW
06 h
[image:5.612.313.542.256.448.2]MTW 03 h
Figure 2.Illustration of the principle of a moving time window (MTW). The target situation is the same for the conventional ap-proach and the MTW, although the candidate situations with the MTW are 2, 4, or 8 times as many. The horizontal bars represent the 24 h precipitation totals; their associated predictors are listed on the right-hand side.
3.1 Influence of the MTW on the selection of analogue dates
First, the impact of the MTW on the selection of analogue dates was analysed independently of precipitation data. This was conducted for the period 1982–2010, although a longer period could have been used because no sub-daily precipita-tion series is required at this stage. The original parameters were used when assessing the impact of the MTW; no recal-ibration of the parameters was conducted.
3.1.1 Analogy of the atmospheric circulation
24 h
20 30 40 50 60 70 80
S1criteria 0.0
0.2 0.4 0.6 0.8 1.0
Cum
ulat
ive
fr
equ
enc
y
20 30 40 50 60 70 80
S1criteria 0.0
0.2 0.4 0.6 0.8 1.0
20 30 40 50 60 70 80
S1criteria 0.0
0.2 0.4 0.6 0.8 1.0
(a) 1st analogue (b) 15th analogue (c) 30th analogue
Median
[image:6.612.64.533.65.239.2]12 h MTW 6 h MTW 3 h MTW
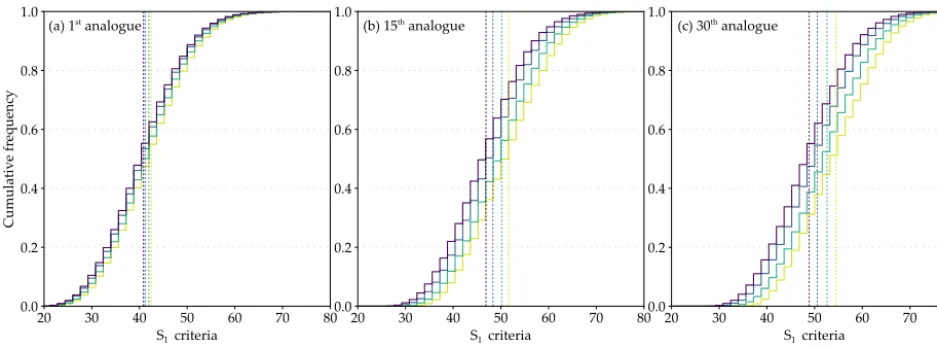
Figure 3.Changes inS1criterion distributions due to the introduction of an MTW with a 12, 6, or 3 h time step. Distributions are provided for(a)the 1st,(b)15th, and(c)30th analogue ranks for all days of the CP at the Ulrichen station.
(Sect. 2.2), up to 8 times as many candidates were provided with the MTW than before, even though they are not fully independent (Sect. 2.4). Figure 3 shows the changes in the distributions, for target dates over the CP, of the analogy cri-terion (S1) for the 1st, 15th, and 30th analogue ranks due to the introduction of an MTW with a 12, 6, or 3 h time step, re-spectively. The shapes of the distributions of the conventional approach and the MTWs were found to be similar. However, the values of the analogy criterion were gradually reduced (shifted to the left) with smaller MTW time steps and were therefore better. The circulation analogy was regularly im-proved with the halving of the MTW time step. For analogues with higher ranks (e.g. 15th or 30th), the difference between the two distributions was larger than that for the first rank, which means that the improvement increased with the rank of the analogue.
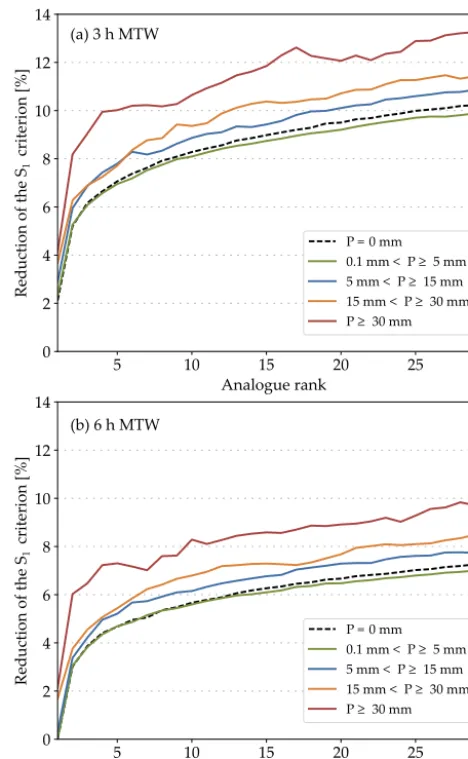
The improvements of the analogy with the rank of the analogues are summarised in Fig. 4, which shows the quan-tiles of theS1criterion for the conventional method and the MTWs at different time steps (top) and those of the increas-ing improvement due to the MTWs (bottom). The increase of the improvement with the rank of the analogue can be ex-plained by the accumulation of better analogues in the se-lection, whereby the new, better situations push the previous analogues to higher ranks. The introduction of the MTW en-ables better analogue situations to be found in the first level of analogy. This improvement was superior for MTWs with a smaller time step, which obviously allows better matching. The impact of the MTW on the analogy criterion has also been analysed per precipitation class, for the target day, for 6 and 3 h MTWs. The results are summarised in Fig. 5 by the median reduction of S1 for the days with precipitation between two a priori selected thresholds. With a reduction in the number of cases per class, the curves were not as smooth as those in the previous analyses. It is nevertheless clear that
the improvements were larger for days with higher precipita-tion for both the 6 and 3 h MTWs.
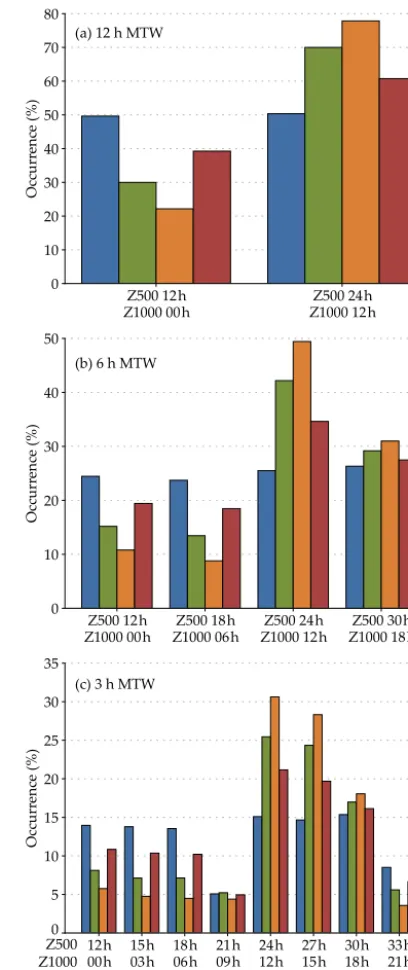
The effect of the MTW on theS1 criterion was decom-posed per season, which is presented in Fig. 6. The differ-ences among the seasons were substantial, with greater im-provements shown for winter than summer. Analysis of the selected hours for the geopotential height predictor was then performed for the MTW with different time steps (Fig. 7). The new choice of the temporal window in winter was more balanced between the different hours of the day, showing more regular repartition, for all MTW time steps. This in-dicates a change in selection of a greater portion of the ana-logue dates for winter. On the contrary, the days in summer showed a preference for the initial temporal window (Z500, 24 h and Z1000, 12 h). This is likely attributed to the more pronounced diurnal effects, which reduced the potential for improvement of the criteria. These effects are in phase with the daily cycle, and good analogues were essentially found for the same hours. When a 3 h MTW was used, the time step following the initial temporal window (Z500, 27 h and Z1000, 15 h) was selected almost as often as the initial val-ues for all seasons. This temporal window can be considered as relatively similar in terms of the solar influence. The other seasons were between these two extremes, which is consis-tent with their respective improvements inS1.
3.1.2 Moisture analogy
When adding the second level of analogy on moisture vari-ables of the 2Z-2MI method (Table 2), the number of can-didate situations for this level did not increase when using the original parameters because the candidate situations were conditioned by theN1previously selected analogues;
S1
criterion
Reduction in the
S1
criterion
[image:7.612.312.546.64.444.2][%]
Figure 4.Synthesis of the changes in theS1criterion due to the MTW with 12, 6, and 3 h time steps for the Ulrichen station depend-ing on the rank of the analogue.(a)Quantiles of theS1distributions corresponding to the MTW with different time steps; 24 h is the conventional approach without MTW.(b)Quantiles of the relative improvements of theS1criterion when using the MTW compared with the conventional approach.
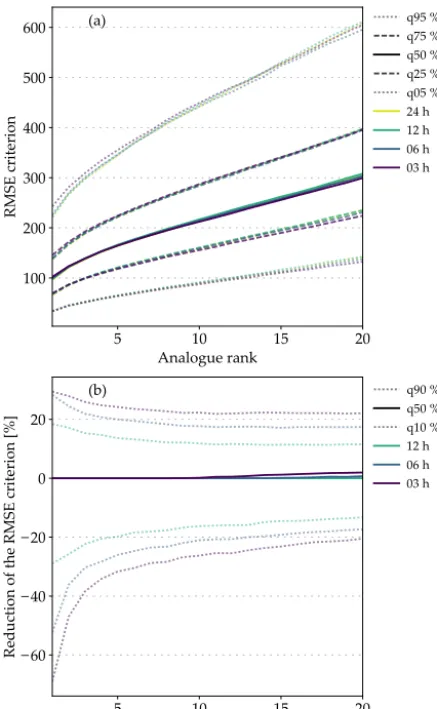
in the RMSE analogy criterion values were possible with the MTW compared with the conventional fixed approach. The results of the second level of analogy, presented in Fig. 8, showed no improvement in RMSE values regardless of the MTW time step. Unlike the first level of analogy, the rela-tive changes in the RMSE values were distributed relarela-tively symmetrically around zero.
These criterion values were not improved by the MTW be-cause the available number of candidate situations (N1) was
not higher. The use of an MTW did not increase the sample size in this case because the second level of analogy consists in subsampling in the dates provided by the first level. How-ever, this result of a globally null improvement in the RMSE values does not mean that the 2Z-2MI method cannot be
im-5 10 15 20 25 30
Analogue rank 0
2 4 6 8 10 12 14
Red
uct
ion
of
the
S1
cri
ter
ion
[%]
P = 0 mm 0.1 mm<P≥ 5 mm 5 mm< P≥ 15 mm 15 mm< P≥30 mm P≥30 mm
5 10 15 20 25 30
Analogue rank 0
2 4 6 8 10 12 14
Red
uct
ion
of
the
S1
cri
ter
ion
[%]
P = 0 mm 0.1 mm<P≥ 5 mm 5 mm< P≥ 15 mm 15 mm< P≥30 mm P≥30 mm (a) 3 h MTW
(b) 6 h MTW
Figure 5.Distribution of the median improvements of theS1 crite-rion due to the(a)3 h MTW and(b)6 h MTW, depending on the daily precipitation thresholds at the Ulrichen station.
proved by the MTW. Indeed, the selected dates changed in the first level of analogy and in the final selection; thus, the distributions of precipitation values were different, which can impact the performance of the precipitation prediction.
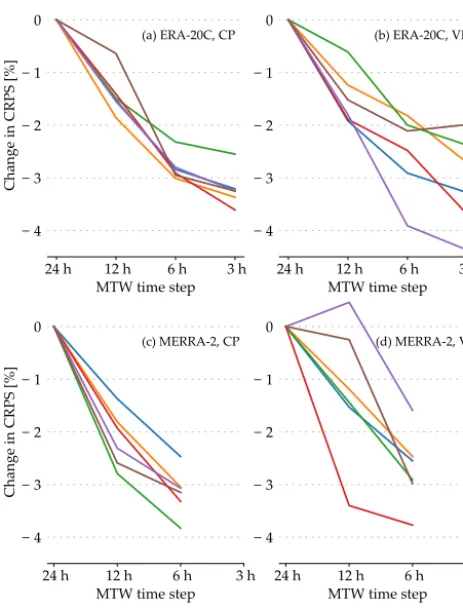
3.2 Impact of the MTW on the precipitation prediction The changes in the performance score (CRPS, Eq. 3) of the precipitation prediction are provided in Figs. 9 and 10 for the 2Z and 2Z-2MI methods, respectively. The AMs were recal-ibrated on the CP and were assessed on the independent VP. The score was processed for each station and both reanalysis datasets. For ERA-20C, the 12 h MTW, 6 h MTW, and 3 h MTW could be assessed, whereas only the two first could be processed with the MERRA-2 dataset.
[image:7.612.58.278.65.432.2]5 10 15 20 25 30 Analogue rank
0 2 4 6 8 10 12 14
Reduction
of
the
S1
criterion
[%]
[image:8.612.325.529.64.549.2]DJF MAM JJA SON
Figure 6.Seasonal effect on the median reduction of theS1 crite-rion for the Ulrichen station due to the MTW. DJF: winter; MAM: spring; JJA: summer; SON: fall.
is likely related to its shorter period of 6 years. The prediction skill for the CP was almost always improved further by re-ducing the time step of the MTW but not of the same magni-tude for every time step. For ERA-20C, the magnimagni-tude of the improvement of 2Z for the CP was relatively reduced when using a 3 h MTW instead of a 6 h MTW, and the variabil-ity for the VP increased. However, as shown in Fig. 4, the selection of analogue dates was improved relatively equally for every reduction of the MTW time step. A possible reason is that the ERA-20C dataset was built by assimilating only surface observations, whereas the AMs rely on the geopo-tential height at 500 hPa. Thus, the timing of the atmospheric circulation at higher pressure levels might not be completely in phase with the actual perturbation systems which caused the observed precipitation. The MTW with the MERRA-2 dataset and the 2Z method also showed a certain slope break after the 12 h MTW that could not be explained and was less important for the 2Z-2MI method. However, the 12 h MTW resulted in important variability for the 2Z-2MI method and the MERRA-2 dataset on the VP.
The introduction of an MTW was previously found to show greater improvement of the S1criterion for days with higher precipitation values (Sect. 3.1.1). The impact of the MTW was then assessed in terms of changes in prediction performance per precipitation class for the target day. Fig-ure 11 synthesises these differences for the Ulrichen station by using the original parameters with the MTW. After the introduction of the MTW, the performance score was gen-erally further improved with reduced CRPS for days with higher precipitation than for non-rainy days and small pre-cipitation values. This can be expected, as the CRPS values are higher when the precipitation amount to be predicted is higher. When recalibrating the parameters using the MTW, the spread of the changes in CRPS tended to decrease,
al-Z500 12h Z1000 00h
Z500 24h Z1000 12h 0
10 20 30 40 50 60 70 80
Occ
urr
enc
e
(%)
Z500 12h Z1000 00h
Z500 18h Z1000 06h
Z500 24h Z1000 12h
Z500 30h Z1000 18h 0
10 20 30 40 50
Occ
urr
enc
e
(%)
12h 00h
15h 03h
18h 06h
21h 09h
24h 12h
27h 15h
30h 18h
33h 21h 0
5 10 15 20 25 30 35
Occ
urr
enc
e
(%)
DJF MAM JJA SON
Z500 Z1000
(a) 12 h MTW
(b) 6 h MTW
(c) 3 h MTW
Figure 7.Distribution of the predictor hours on the selected ana-logue dates for the Ulrichen station when using a(a)12 h MTW, (b)6 h MTW, and(c)3 h MTW, depending on the season.
though a slight loss in performance was noted for the most rainy days (not shown).
[image:8.612.52.286.65.239.2]Figure 8.Synthesis of the changes in the RMSE criterion due to the MTW for the Ulrichen station, depending on the rank of the analogue.(a)Quantiles of the RMSE distributions with and without the MTW.(b)Quantiles of the relative improvements of the RMSE criterion when using the MTW.
the curve should be along the diagonal. The VP contains only 6 years (Sect. 2); therefore, higher variability is present for higher thresholds, and the curves are smoother and closer to the diagonals for the CP, which is longer (not shown). Fig-ure 12 shows that the MTW improved the reliability for both 2Z and 2Z-2MI methods, and for all thresholds because the curves moved towards the diagonal with decreasing MTW time steps. For P80, the 3 h MTW predictions fit well the ob-served frequency. When considering higher thresholds, the 2Z-2MI method was generally better than 2Z. The case of the P95 threshold showed a conditional dry bias associated with larger probabilities for the considered AMs; however, this was substantially reduced by the 3 h MTW. This condi-tional dry bias means that the AM did not predict the event with a probability equal to 1 for 2Z. Obtaining a predicted probability of exceedance of 1 would mean that all analogue dates for a certain target date would be above the threshold.
24 h 12 h 6 h 3 h
MTW time step
−4
−3
−2
−1
0
Chan
ge
in
CRP
S
[%]
24 h 12 h 6 h 3 h
MTW time step
−4
−3
−2
−1
0
24 h 12 h 6 h 3 h
MTW time step
−4
−3
−2
−1
0
Chan
ge
in
CRP
S
[%]
24 h 12 h 6 h 3 h
MTW time step
−4
−3
−2
−1
0
Aigle Montana Sion Ulrichen Visp Zermatt
(a) ERA-20C, CP (b) ERA-20C, VP
(c) MERRA-2, CP (d) MERRA-2, VP
Figure 9.Changes in performance score (CRPS) of the 2Z method at the different stations for MTW of varying time steps relative to the conventional approach of 24 h. Results are provided for ERA-20C for the(a)CP and(b) VP as well as for MERRA-2 for the (c)CP and(d)VP. Lower CRPS values indicate better performance.
The number of analogue dates being 30 in this case, it is less likely to have 30 values above the threshold when the thresh-old increases. This issue has been addressed by Marty (2010) who proposed a bias correction method for the AM. How-ever, as shown in Fig. 12, the introduction of an MTW, espe-cially with a 3 h time step, already improves this mismatch to some degree.
4 Discussion
4.1 Better prediction of heavy precipitation
[image:9.612.61.280.65.420.2]24 h 12 h 6 h 3 h MTW time step
−4 −3 −2 −1 0 Chan ge in CRP S [%]
24 h 12 h 6 h 3 h
MTW time step
−4
−3
−2
−1
0
24 h 12 h 6 h 3 h
MTW time step
−4 −3 −2 −1 0 Chan ge in CRP S [%]
24 h 12 h 6 h 3 h
MTW time step
−4
−3
−2
−1
0
Aigle Montana Sion Ulrichen Visp Zermatt
(a) ERA-20C, CP (b) ERA-20C, VP
[image:10.612.49.281.61.366.2](c) MERRA-2, CP (d) MERRA-2, VP
Figure 10.The same as Fig. 9 but for the 2Z-2MI method.
These situations are less numerous than anticyclonic situa-tions, which makes it less likely to find very good analogues at the same time of the day. We can, therefore, expect to more significantly improve these situations with greater dynamics when introducing an MTW because better matches to the tar-get situation may be found. In contrast, days with low dy-namics in atmospheric circulation, such as anticyclonic situ-ations, will not be radically improved by the introduction of the MTW.
The MTW improved the prediction for days with heavier precipitation. Therefore, it should improve the prediction of extremes due to selection of better analogue situations and to addition of possible new extreme precipitation values result-ing from movresult-ing 24 h totals with a certain time shift. How-ever, even though the distribution of analogue precipitation values should move towards the targeted extreme to provide better prediction, the MTW itself does not enable predic-tion of extreme events that were not yet observed and are therefore not present in the archive. However, the extremes in AMs can be modelled by extrapolation of a truncated ex-ponential or gamma distribution fitted to the analogue val-ues (Obled et al., 2002), and precipitation valval-ues can be proposed for non-observed low probabilities. Another pos-sible approach is to combine AMs with other methods (e.g. Chardon et al., 2017). From this perspective, the MTW might improve the prediction of extremes because it improves the
−25 −20 −15 −10 −5 0 5 10 15 ∆ CRP S P= 0 0.1 ≤ P < 5 5 ≤ P < 15 15 ≤ P < 30 P ≥ 30 P= 0 0.1 ≤ P < 5 5 ≤ P < 15 15 ≤ P < 30 P ≥ 30 −25 −20 −15 −10 −5 0 5 10 15 ∆ CRP S
Precipitation [mm d-1] Precipitation [mm d-1]
(a)2Z, 6h MTW (b)2Z, 3h MTW
[image:10.612.322.534.67.429.2](c)2Z-2MI, 6h MTW (d)2Z-2MI, 3h MTW
Figure 11.Differences in the CRPS values at the Ulrichen station due to the introduction of the MTW as a function of different daily precipitation thresholds for the target date. The results are provided for the 2Z method (top) and the 2Z-2MI method (bottom) with a 6 h MTW (left) and a 3 h MTW (right). Stars represent averages. Lower CRPS values indicate better improvements.
distribution of precipitation values for days with higher pre-cipitation, on which post-treatment techniques rely. How-ever, this topic is beyond the scope of the present study. 4.2 The relationship between the MTW time step and
the number of analogues
0.0 0.2 0.4 0.6 0.8 1.0
0
.0
0
.2
0
.4
0
.6
0
.8
1
.0
(a) 2Z, P80
0.0 0.2 0.4 0.6 0.8 1.0
0
.0
0
.2
0
.4
0
.6
0
.8
1
.0
0.0 0.2 0.4 0.6 0.8 1.0
0
.0
0
.2
0
.4
0
.6
0
.8
1
.0
0.0 0.2 0.4 0.6 0.8 1.0
0
.0
0
.2
0
.4
0
.6
0
.8
1
.0
0.0 0.2 0.4 0.6 0.8 1.0
0
.0
0
.2
0
.4
0
.6
0
.8
1
.0
0.0 0.2 0.4 0.6 0.8 1.0
0
.0
0
.2
0
.4
0
.6
0
.8
1
.0
(b) 2Z-2MI, P80
(c) 2Z, P90 (d) 2Z-2MI, P90
(e) 2Z, P95 (f) 2Z-2MI, P95
Observ
ed relativ
e frequency
Observ
ed relativ
e frequency
Observ
ed relativ
e frequency
Forecast probability Forecast probability
[image:11.612.84.511.79.661.2]12 hMTW 06 hMTW 03 hMTW 24 h (conventional)
24 h 12 h 6 h 3 h 25
50 75 100
24 h 12 h 6 h 3 h
50 100 150 200
24 h 12 h 6 h 3 h
20 40 60
Aigle Montana Sion
Ulrichen Visp Zermatt (a) 2Z, N1
(b) 2Z-2MI, N1
(c) 2Z-2MI, N2 0
0
0
Number of analo
gues
Number of analo
gues
Number of analo
gues
[image:12.612.55.279.62.458.2]MTW time step
Figure 13.Optimal number of analogues of the first and second levels of analogy,N1andN2, respectively, for the(a)2Z and(b, c)2Z-2MI methods after recalibration using the MTW.
As shown in Fig. 4, the improvement of the S1criterion
increases along with the rank of the analogue, which shows an accumulation of better analogue situations in the distri-butions. Widening the selection of analogues appears to be beneficial for keeping some with increased rank because they appear to be relevant in predicting the precipitation values. Thus, the number of good analogues was globally increased. A higher number of analogues generally implies a poorer analogy with an archive of fixed length. Indeed, when the choice of the predictors or the parameters improve, leading to a better prediction, the optimal number of analogue situations tends to decrease. However, when the length of the archive increases, the optimal number of analogues also tends to in-crease for better performance up to a certain threshold (Bon-tron, 2004; Hamill et al., 2006). The observed increase in the number of analogue situations with the MTW resulting in
better performance skills for the given methods can therefore be considered as an inflation of the archive.
4.3 Inflation of the archive
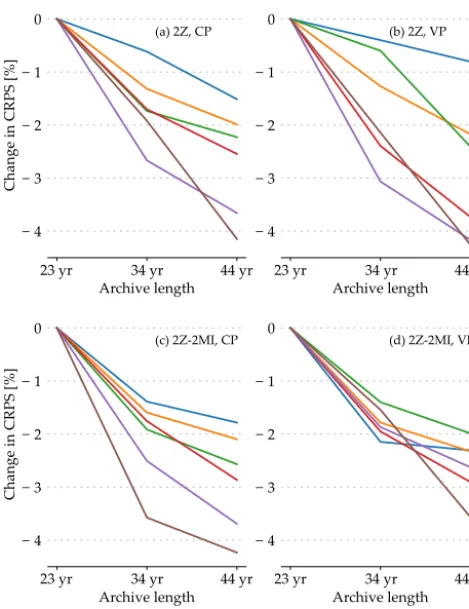
Because sub-daily precipitation time series are often avail-able over a shorter period than daily, a reduction of the over-all archive length at disposal is necessary. This usuover-ally has a negative consequence on the skill of precipitation predic-tion. The role of the archive length was assessed on the ERA-20C dataset and is presented in Fig. 14 for both 2Z and 2Z-2MI methods using the conventional approach of fixed 24 h windows. As expected, the performance of the method glob-ally increased with the length of the archive. The best per-formances were found with a 44-year archive, which corre-sponds to the period 1961–2010 with the 6 years of indepen-dent VP subtracted. This addition of 21 years of archive to the original 23 years resulted in an improvement of both 2Z and 2Z-2MI methods that was of the same order of magni-tude as the introduction of a 6 h MTW (Figs. 9 and 10). The 3 h MTW resulted in similar performance for the 2Z method and slightly superior improvements for the 2Z-2MI method.
As previously stated, the MTW can be considered as an inflation of the archive because it provides additional situa-tions to the pool of possible analogues. A 6 h MTW brought gains of the same magnitude as an almost double archive length. However, it should be noted that despite the num-ber of candidate situations being 4 times the original numnum-ber with a 6 h MTW, the gains appear to be lower than those for a quadrupled archive length. The likely reason is that an actual longer archive would contain more atmospheric situ-ations that might have been observed less frequently during a shorter period. Moreover, consecutive intra-daily situations are expected to be correlated and thus to present redundant information.
Archive length
−4
−3
−2
−1
0
Chan
ge
in
CRP
S
[%]
Archive length
−4
−3
−2
−1
0
Archive length
−4
−3
−2
−1
0
Chan
ge
in
CRP
S
[%]
Archive length
−4
−3
−2
−1
0
23 yr 34 yr 44 yr 23 yr 34 yr 44 yr
23 yr 34 yr 44 yr 23 yr 34 yr 44 yr
Aigle Montana Sion Ulrichen Visp Zermatt
(a) 2Z, CP (b) 2Z, VP
[image:13.612.49.284.72.377.2](c) 2Z-2MI, CP (d) 2Z-2MI, VP
Figure 14.Change in performance score (CRPS) of the 2Z (top) and 2Z-2MI (bottom) methods at the different stations for the CP (left) and VP (right) for an increasing archive length with the conven-tional approach of 24 h window. Lower CRPS scores indicate better results.
4.4 Reconstruction of a long precipitation archive suitable for the MTW
As discussed in Sect. 4.3, the skills of AMs improved with the length of the archive. It would then be even more prof-itable to apply the MTW to the longest archive possible rather than being limited to the period in which sub-daily precipitation data are available. One possible approach to get such long time series is to reconstruct moving 24 h to-tals from existing standard daily precipitation series (06:00 to 06:00 UTC the following day). For this purpose, disaggre-gation techniques can be used. In this study, we considered the interest of such reconstruction approach using in turn two simple disaggregation methods.
The first technique is a proportional distribution in which the observed daily precipitation was considered to be con-stant during the measurement period. Proportional parts of the original daily time series were allocated into a new mov-ing average of 24 h totals (e.g. a 00:00–24:00 UTC total would be made of one-fourth of the standard precipitation of day 1 and three-fourths of day 2).
The second approach aimed at obtaining data that are closer to the chronology of the actual precipitation by rely-ing on informative proxy variables durrely-ing the reconstruction procedure. Data from NCEP/NCAR reanalysis 1 were used for this purpose. Precipitable water and relative humidity at 1000, 925, or 850 hPa were assessed at the four points sur-rounding the study area and at different times of the day. Pre-cipitation time series from the reanalysis were not considered as potential proxy due to the presence of numerous zeros, which may not always match the prediction; this can lead to an undefined temporal repartition. The best proxy variable, precipitable water, was identified through correlation analy-ses with the 6 h precipitation time series on the period 1982– 2007 (on non-zero precipitation values). Once the best proxy selected, its temporal profile was used to disaggregate the daily precipitation time series.
These two simple (and rather crude) methods did not result in valuable outputs (results not shown). Indeed, the perfor-mance improvement brought by the MTW was lost due to the poor quality of the reconstructed precipitation archives. The second method which relied on a proxy variable performed slightly better than the proportional distribution method but not well enough to obtain a relevant time series. Another re-analysis dataset with more accurate moisture variables could produce better proxies.
These attempts to transpose the MTW on the (usually) longest meteorological archive highlight the importance of the actual rainfall chronology. The MTW is beneficial if the reconstructed precipitation series are close to the observed values. In the absence of a precipitation series with accurate sub-daily chronology, the introduction of an MTW does not improve the precipitation prediction.
5 Conclusions
The AMs are most often based on a daily time step due to the availability of long precipitation archives. However, it is unlikely that two analogue synoptic situations which evolve relatively quickly would match optimally at the same hour of the day. It is probable that better matches may be found at a different hour, which can change the selection of the ana-logue dates.
As shown in previous research (Finet et al., 2008), the in-troduction of an MTW enables better analogue situations in terms of atmospheric circulation to be obtained. Using re-cent reanalysis datasets, MTWs with 12, 6, and 3 h time steps were assessed in the present study. Improvement in theS1
criterion values increased with the rank of the analogue due to the accumulation of better analogues within the predicted distributions. Moreover, the improvement in theS1criterion
increased further for smaller MTW time steps.
sum-mer than in winter, better analogues are found at the same time of the day. The preference for the same hours in summer has been demonstrated, whereas a large part of the analogue situations were selected at a different time in winter.
The MTW improved the precipitation prediction, with the CRPS showing a global decrease for all stations for both the CP and VP. The prediction skill for the CP was almost always improved further by reducing the time step of the MTW. The results for the VP showed the same global trends but had more variability. Moreover, the reliability of the considered AMs improved for the prediction of different threshold ex-ceedances, especially with a 3 h MTW.
The improvement in the circulation analogy and the change in performance of the precipitation prediction were found to be more important for days with heavier precip-itation. These days are generally related to more dynamic atmospheric situations and are less frequent in the archive. These situations have more specific circulation patterns that are evolving more rapidly. Therefore, an MTW was found to be of particular interest in this type of situation and is bene-ficial for the prediction of heavier precipitation events.
Improvements of the analogy criterion and the perfor-mance scores were both found to be higher for MTWs with a smaller time step of 3 h. A 3 h MTW provided 8 times more candidate situations, although they were not fully indepen-dent. Because the MTW provides additional situations to the pool of possible analogues, it can be considered as an infla-tion of the archive, which can be interesting in several appli-cations. For example, the most accurate reanalysis datasets are limited to the satellite era starting in the 1980s and thus provide shorter archives than reanalysis datasets based on conventional data only. Or, in the context of a transient cli-mate, where the eventual non-stationarity of the link between predictors and precipitation might discard the relevance of analogues from the distant past, using the MTW approach allows relying on a more recent and shorter archive rather than a long one.
It is desirable for the AM to have the biggest pool of candi-date analogues available. By inflating the archive, the MTW contributes to enriching this pool. However, the use of the MTW relies partly on precipitation series at a sub-daily time step, which are available only for the last decades. It would then be even more profitable to apply the MTW to the longest archive possible rather than being limited to the recent pe-riod. Attempts to reconstruct longer sub-daily precipitation time series based on simple disaggregation methods were not successful, which demonstrated the importance of the quality of the precipitation archive to be used in the MTW technique. The precipitation prediction provided by the MTW improved only when the precipitation chronology was close to the ac-curate values. More advanced disaggregation methods might provide suitable sub-daily time series. Alternatively, another option could be to combine both the MTW and the classical approach and to look for analogue situations at a sub-daily time step from the 1980s and at a daily time step for the antecedent years. Finally, some other predictands are point observations and not temporal integrations, such as the oc-currence of hail or extreme wind gusts, which make them easier to use with the MTW, as no disaggregation is needed. The introduction of the MTW improved the selection of synoptic analogues. Regardless of the availability of precip-itation series at a sub-daily time step, the MTW can be used to provide a better diagnostic of the weather situation of the target date. It can be used, for example, to identify ana-logue dates related to extreme weather conditions in histori-cal databases.
The MTW technique is simple and easily applicable. Therefore, it should be considered for several applications in different contexts, such as operational forecasting or climate-related studies.
Data availability. The MERRA-2 reanalysis can be freely
Appendix A: Acronyms
2Z Name of the analogue method of atmospheric circulation
2Z-2MI Name of the analogue method composed of a first level on atmospheric circulation and a second level on a moisture index
AM Analogue method
CP Calibration period
CRPS Continuous ranked probability score
ERA-20C European Centre for Medium-Range Weather Forecasts 20th century reanalysis MERRA-2 Modern-Era Retrospective Analysis for Research and Applications, version 2
MTW Moving time window
NCAR National Center for Atmospheric Research NCEP National Centers for Environmental Prediction RH850 Relative humidity at 850 hPa
RMSE Root mean square error
S1 Teweles and Wobus (1954) score TPW Total precipitable water
VP Validation period
Competing interests. The authors declare that they have no conflict of interest.
Acknowledgements. The authors thank the Swiss Federal Office for
Environment (FOEV), the Roads and Water Courses Service, En-ergy and Water Power Service of the Wallis Canton, and the Water, Land, and Sanitation Service of the Vaud Canton which financed the MINERVE (Modélisation des Intempéries de Nature Extrême des Rivières Valaisannes et de leurs Effets) project which started this research. Thanks are also extended to Dominique Bérod for his support.
The fruitful collaboration with the Laboratoire d’Etude des Transferts en Hydrologie et Environnement of the Grenoble Insti-tute of Technology (G-INP) was made possible by the Herbette Foundation.
NCEP reanalysis data were obtained from the website of the NOAA/OAR/ESRL PSD, Boulder, Colorado, USA, at http://www. esrl.noaa.gov/psd/. The MERRA-2 was obtained from the Goddard Earth Sciences Data and Information Services Center, Greenbelt, Maryland, from their website at http://disc.sci.gsfc.nasa.gov/mdisc. The ERA-20C data was obtained from the ECMWF data server at http://apps.ecmwf.int/datasets/. Precipitation time series were pro-vided by MeteoSwiss.
The authors would also like to acknowledge the work of anonymous reviewers and the editor who contributed to improving the manuscript.
Edited by: Jan Seibert
Reviewed by: Thomas M. Hamill and four anonymous referees
References
Ben Daoud, A.: Améliorations et développements d’une méthode de prévision probabiliste des pluies par analogie, PhD thesis, Université de Grenoble, 2010.
Ben Daoud, A., Sauquet, E., Lang, M., Obled, C., and Bontron, G.: La prévision des précipitations par recherche d’analogues: état de l’art et perspectives, in: Colloque SHF-191e CST – Prévisions hydrométéorologiques, Lyon, 2008.
Ben Daoud, A., Sauquet, E., Bontron, G., Obled, C., and Lang, M.: Daily quantitative precipitation forecasts based on the analogue method: improvements and application to a French large river basin, Atmos. Res., 169, 147–159, https://doi.org/10.1016/j.atmosres.2015.09.015, 2016.
Bliefernicht, J.: Probability forecasts of daily areal precipitation for small river basins, PhD thesis, Universität Stuttgart, 2010. Bontron, G.: Prévision quantitative des précipitations: Adaptation
probabiliste par recherche d’analogues. Utilisation des Réanaly-ses NCEP/NCAR et application aux précipitations du Sud-Est de la France, PhD thesis, Institut National Polytechnique de Greno-ble, 2004.
Bontron, G. and Obled, C.: L’adaptation probabiliste des prévisions météorologiques pour la prévision hydrologique, La Houille Blanche, 1, 23–28, https://doi.org/10.1051/lhb:200501002, 2005.
Brown, T.: Admissible Scoring Systems for Continuous Distribu-tions, Tech. rep., available at: http://eric.ed.gov/?id=ED135799 (last access: 24 November 2014), 1974.
Caillouet, L., Vidal, J.-P., Sauquet, E., and Graff, B.: Probabilis-tic precipitation and temperature downscaling of the Twenti-eth Century Reanalysis over France, Clim. Past, 12, 635–662, https://doi.org/10.5194/cp-12-635-2016, 2016.
Chardon, J., Hingray, B., Favre, A.-C., Autin, P., Gailhard, J., Zin, I., and Obled, C.: Spatial Similarity and Transferability of Analog Dates for Precipitation Downscaling over France, J. Climate, 27, 5056–5074, https://doi.org/10.1175/JCLI-D-13-00464.1, 2014. Chardon, J., Hingray, B., and Favre, A.-C.: An adaptive
two-stage analog/regression model for probabilistic prediction of lo-cal precipitation in France, Hydrol. Earth Syst. Sci. Discuss., https://doi.org/10.5194/hess-2017-62, in review, 2017.
Dayon, G., Boé, J., and Martin, E.: Transferability in the fu-ture climate of a statistical downscaling method for precipi-tation in France, J. Geophys. Res.-Atmos., 120, 1023–1043, https://doi.org/10.1002/2014JD022236, 2015.
Desaint, B., Nogues, P., Perret, C., and Garçon, R.: La prévision hydrométéorologique opérationnelle: l’expérience d’Electricité de France, in: Colloque SHF-191e CST – Prévisions hy-drométéorologiques, Lyon, https://doi.org/10.1051/lhb/2009054, 2008.
Duband, D.: Reconnaissance dynamique de la forme des situations météorologiques. Application à la prévision quantitative des pré-cipitations, PhD thesis, Thèse de 3ème cycle de la faculté des sciences de Paris, 1970.
Finet, T., Marty, R., Zin, I., and Obled, C.: Developing and transfer-ring the ANALOG approach for PQPF’s from French OHMCV catchments to quick responding catchments in Venetia and Ro-mania, Tech. rep., LTHE & CNRS, Grenoble, France, 2008. García Hernández, J., Horton, P., Tobin, C., and Boillat, J.:
MIN-ERVE 2010: Prévision hydrométéorologique et gestion des crues sur le Rhône alpin, Wasser Energie Luft – Eau Energie Air, 4, 297–302, 2009.
Hamill, T. and Whitaker, J.: Probabilistic quantitative pre-cipitation forecasts based on reforecast analogs: Theory
and application, Mon. Weather Rev., 134, 3209–3229,
https://doi.org/10.1175/mwr3237.1, 2006.
Hamill, T. M., Whitaker, J. S., and Mullen, S. L.: Reforecasts: An Important Dataset for Improving Weather Predictions, B. Am. Meteorol. Soc., 87, 33–46, https://doi.org/10.1175/BAMS-87-1-33, 2006.
Hamill, T. M., Scheuerer, M., and Bates, G. T.: Analog Probabilistic Precipitation Forecasts Using GEFS Refore-casts and Climatology-Calibrated Precipitation Analyses, Mon. Weather Rev., 143, 3300–3309, https://doi.org/10.1175/MWR-D-15-0004.1, 2015.
Hersbach, H.: Decomposition of the continuous ranked prob-ability score for ensemble prediction systems, Weather Forecast., 15, 559–570, https://doi.org/10.1175/1520-0434(2000)015<0559:dotcrp>2.0.co;2, 2000.
archives-ouvertes.fr/tel-01441762 (last access: 21 April 2017) 2012.
Horton, P.: atmoswing/atmoswing: v1.5.0, Zenodo, http://doi.org/ 10.5281/zenodo.821559, 2017.
Horton, P., Jaboyedoff, M., Metzger, R., Obled, C., and Marty, R.: Spatial relationship between the atmospheric circulation and the precipitation measured in the western Swiss Alps by means of the analogue method, Nat. Hazards Earth Syst. Sci., 12, 777–784, https://doi.org/10.5194/nhess-12-777-2012, 2012.
Horton, P., Jaboyedoff, M., and Obled, C.: Global Optimization of an Analog Method by Means of Genetic Algorithms, Mon. Weather Rev., 145, 1275–1294, https://doi.org/10.1175/MWR-D-16-0093.1, 2017a.
Horton, P., Jaboyedoff, M., and Obled, C.: Using genetic al-gorithms to optimize the analogue method for precipita-tion predicprecipita-tion in the Swiss Alps, J. Hydrol., in press, https://doi.org/10.1016/j.jhydrol.2017.04.017, 2017b.
Horton, P., Jaboyedoff, M., and Obled, C.: Data for: The logue method for precipitation prediction – finding better ana-logue situations at a sub-daily time step, Mendeley Data, v2, https://dx.doi.org/10.17632/j3hckp2654.2, 2017c.
Junk, C., Delle Monache, L., Alessandrini, S., Cervone, G., and von Bremen, L.: Predictor-weighting strategies for probabilistic wind power forecasting with an analog ensemble, Meteorol. Z., 24, 361–379, https://doi.org/10.1127/metz/2015/0659, 2015. Kalnay, E., Kanamitsu, M., Kistler, R., Collins, W., Deaven, D.,
Gandin, L., Iredell, M., Saha, S., White, G., and Woollen, J.: The NCEP/NCAR 40-year reanalysis project, B. Am. Meteorol. Soc., 77, 437–471, https://doi.org/10.1175/1520-0477(1996)077<0437:tnyrp>2.0.co;2, 1996.
Lorenz, E.: Empirical orthogonal functions and statistical weather prediction, Tech. rep., Massachusetts Institute of Technology, Department of Meteorology, Massachusetts Institute of Technol-ogy, Dept. of MeteorolTechnol-ogy, 1956.
Lorenz, E.: Atmospheric predictability as revealed
by naturally occurring analogues, J. Atmos.
Sci., 26, 636–646,
https://doi.org/10.1175/1520-0469(1969)26<636:aparbn>2.0.co;2, 1969.
Maraun, D., Wetterhall, F., Chandler, R. E., Kendon, E. J., Wid-mann, M., Brienen, S., Rust, H. W., Sauter, T., Themeßl, M., Venema, V. K. C., Chun, K. P., Goodess, C. M., Jones, R. G., Onof, C., Vrac, M., and Thiele-Eich, I.: Precipitation downscal-ing under climate change: Recent developements to bridge the gap between dynamical models and the end user, Rev. Geophys., 48, 1–34, https://doi.org/10.1029/2009RG000314, 2010. Marty, R.: Prévision hydrologique d’ensemble adaptée aux bassins
à crue rapide. Elaboration de prévisions probabilistes de précipi-tations à 12 et 24 h. Désagrégation horaire conditionnelle pour la modélisation hydrologique, Application à des bassins de la région Cévennes Vivarais, PhD thesis, Université de Grenoble, 2010.
Marty, R., Zin, I., Obled, C., Bontron, G., and Djerboua, A.: Toward real-time daily PQPF by an analog sorting approach: Application to flash-flood catchments, J. Appl. Meteorol. Clim., 51, 505–520, https://doi.org/10.1175/JAMC-D-11-011.1, 2012.
Matheson, J. and Winkler, R.: Scoring rules for continu-ous probability distributions, Manage. Sci., 22, 1087–1096, https://doi.org/10.1287/mnsc.22.10.1087, 1976.
Obled, C., Bontron, G., and Garçon, R.: Quantitative precipita-tion forecasts: a statistical adaptaprecipita-tion of model outputs through an analogues sorting approach, Atmos. Res., 63, 303–324, https://doi.org/10.1016/S0169-8095(02)00038-8, 2002. Poli, P., Hersbach, H., Dee, D. P., Berrisford, P., Simmons, A. J.,
Vitart, F., Laloyaux, P., Tan, D. G. H., Peubey, C., Thépaut, J. N., Trémolet, Y., Hólm, E. V., Bonavita, M., Isaksen, L., and Fisher, M.: ERA-20C: An atmospheric reanalysis of the twentieth cen-tury, J. Climate, 29, 4083–4097, https://doi.org/10.1175/JCLI-D-15-0556.1, 2016.
Radanovics, S., Vidal, J.-P., Sauquet, E., Ben Daoud, A., and Bon-tron, G.: Optimising predictor domains for spatially coherent pre-cipitation downscaling, Hydrol. Earth Syst. Sci., 17, 4189–4208, https://doi.org/10.5194/hess-17-4189-2013, 2013.
Raynaud, D., Hingray, B., Zin, I., Anquetin, S., Debionne, S., and Vautard, R.: Atmospheric analogues for physically consistent scenarios of surface weather in Europe and Maghreb, Int. J. Cli-matol., 37, 2160–2176, https://doi.org/10.1002/joc.4844, 2016. Rienecker, M. M., Suarez, M. J., Gelaro, R., Todling, R.,
Bacmeis-ter, J., Liu, E., Bosilovich, M. G., Schubert, S. D., Takacs, L., Kim, G. K., Bloom, S., Chen, J., Collins, D., Conaty, A., Da Silva, A., Gu, W., Joiner, J., Koster, R. D., Lucchesi, R., Molod, A., Owens, T., Pawson, S., Pegion, P., Redder, C. R., Reichle, R., Robertson, F. R., Ruddick, A. G., Sienkiewicz, M., and Woollen, J.: MERRA: NASA’s modern-era retrospective anal-ysis for research and applications, J. Climate, 24, 3624–3648, https://doi.org/10.1175/JCLI-D-11-00015.1, 2011.
Ruosteenoja, K.: Factors affecting the occurrence and lifetime of 500 mb height analogues: a study based on a large amount of data, Mon. Weather Rev., 116, 368–376, 1988.
Teweles, S. and Wobus, H. B.: Verification of prognostic charts, B. Am. Meteorol. Soc., 35, 455–463, 1954.
Van Den Dool, H. M.: Searching for analogues, how long must we wait?, Tellus A, 46, 314–324, 1994.
Zorita, E. and Storch, H. V.: The analog method as
a simple statistical downscaling technique:
com-parison with more complicated methods, J.
Cli-mate, 12, 2474–2489,