THE NATIONAL
POLICY AND
ADVISORY BOA
FOR ENTERPRISE
TRADE, SCIENCE
TECHNOLOGY
Survey of Research
and Development in
the Business Sector
1997
BOARD MEMBERS
Peter Cassells, CHAIRMAN
Sean Dorgan, CHIEF EXECUTIVE, IDA IRELAND
Dan Flinter,
CHIEF EXECUTIVE, ENTERPRISE IRELAND
Paul Haran,
SECRETARY GENERAL, DEPARTMENT OF ENTERPRISE, TRADE AND EMPLOYMENT
Professor Michael Hillery,
CHAIR OF MANUFACTURING ENGINEERING, UNIVERSITY OF LIMERICK
John Lynch, DIRECTOR GENERAL, FÁS
William Murphy, PARTNER, TYNAN DILLON AND COMPANY
Fergal O’Rourke, FUNCTIONS OF FORFÁS
Is é Forfás an bord náisiúnta um polasaí agus comhairle le haghaidh fiontraíochta, trádála, eolaíochta, teicneolaíochta agus nuála. Is é an comhlacht é a bhfuil comhactaí dlíthiúla an stáit maidir le cur-chun-cinn tionscail agus forbairt teicneolaíochta dílsithe ann. Is é an comhlacht é freisin trína dciomnaítear
cumhachtaí ar Fhiontraíocht Éireann le tionscail dúchais a chur chus cinn agus ar ghníomhaireacht Forbartha Tionscail na hÉireann (GFT Éireann) le hinfheistíocht isteach sa tir a chur chun tosaight. Is iad feighmeanna Fhorfáis:
■ comhairle a chur ar an Aire ó thaobh cúrsaí a bhaineann le forbairt tionscail sa Stát
■ comhairle maidir le forbairt agus comhordú polasaithe a chur ar fáil d’Fhiontraíocht Éireann,
d’GFT Éireann agus d’aon fhoras eile dá leithéid (a bunaíodh go reachtúil) a d’fhéadfadh an tAire a ainmniú trí ordú
■ forbairt na tionsclaíochta, na teicneolaíochta, na margaíochta agus acmhainní daonna a spreagadh
sa Stát
■ bunú agus forbairt gnóthas tionsclaíoch ón iasacht a spreagadh sa Stát, agus
■ Fiontraíocht Éireann agus GFT Éireann a chomhairliú agus a chomhordú ó thaobh a gcuid feidhmeanna.
Forfás is the national policy and advisory board for enterprise, trade, science, technology and innovation. It is the body in which the State’s legal powers for industrial promotion and technology development have been vested. It is also the body through which powers are delegated to Enterprise Ireland for the promotion of indigenous industry and to IDA Ireland for the promotion of inward investment. The broad functions of Forfás are to:
■ advise the Minister on matters relating to the development of industry in the State
■ to advise on the development and co-ordination of policy for Enterprise Ireland, IDA Ireland and
such other bodies (established by or under statute) as the Minister may by order designate
■ encourage the development of industry, technology, marketing and human resources in the State
■ encourage the establishment and development in the State of industrial undertakings from outside
the State, and
Science, Technology and
Innovation Division, Forfás
September 1999
Survey of Research
and Development in
the Business Sector
This report presents the findings of a survey of R&D performers in the business sector relating to 1997 and updates a regular series on Business Expenditure on Research and Development (BERD) produced by Forfás. The survey relies on the co-operation of R&D performing enterprises in the country and special thanks is given to all of the enterprises that participated in the most recent survey.
If you require further information about this survey, please contact:
Science, Technology and Innovation Division Forfás
Wilton Park House Wilton Place Dublin 2 Ireland
Telephone: +3531 607 3018 Fax: +3531 607 3260
Executive Summary 4
Section A
Analysis of the Key Issues 5
A1 Overall Trend in Business Expenditure on Research and Development 5
A2 Industry Share of Gross Expenditure on Research and Development 6
A3 Government Funding of Business Sector Research and Development 7
A4 Research and Development Expenditure Across Industry Sectors 9
A5 Research and Development Expenditure
in Irish and Foreign-owned Industry 11
A6 Distribution of R&D Activity among Irish and Foreign-owned Firms 14
A7 Examination of Other Indicators of Technological Performance 16
Section B
Detailed Tabular Data 19
B1 Business Expenditure on Research and
Development as a percentage of GDP 20
B2 Total Business Sector R&D Personnel per 1000 Labour Force 21
B3 Business Sector Researchers per 1000 Labour Force 22
B4 Proportion of All R&D Performed in the Business Sector 23
B5 Proportion of Business Sector R&D Financed by Government 24
B6 Distribution of R&D Expenditure by Sector – All Firms 25
B7 R&D Expenditure in Manufacturing to Gross Output – All Firms 27
B8 R&D Expenditure in Manufacturing
to Gross Output in Selected Countries 29
B9 Distribution of R&D Expenditure by Sector
– Irish-owned Firms 30
B10 R&D Spend in Manufacturing to Gross Output
– Irish-owned Firms 32
B11 Distribution of R&D Expenditure by Sector
– Foreign-owned Firms 34
B12 R&D Spend in Manufacturing to Gross Output
– Foreign-owned Firms 36
B13 Resident patent applications per 10,000 population 38
B14 EPO patent applications per 10,000 population 39
B15 Patents granted by US Patent and
Trademark Office per 10,000 population 40
B16 Top-line Results from the Community Innovation Survey 1994-1996 41
Appendices
Appendix A
Survey Methodology 42
Appendix B
The Questionnaire for the 1997 R&D Survey 43
List of Figures
Figure 1 Business Expenditure on Research
and Development 1991-1997 5
Figure 2 International Ranking on Business
Sector R&D Aggregates 1991-1997 6
Figure 3 Gross Expenditure on R&D as a
Percentage of GDP 1991-1997 7
Figure 4 Share of Gross Expenditure on R&D
Performed in Industry 1991-1997 7
Figure 5 Government Financing of Industry R&D in Ireland 8
Figure 6 Trend in Government Financing of Industry R&D 1991-1997 8
Figure 7 Business Expenditure on Research
and Development by Industry Sector 9
Figure 8 R&D Expenditure as a Percentage of
Gross Output in Manufacturing 1997 10
Figure 9 R&D Expenditure to Gross Output –
Ireland Vs International Benchmarks 10
Figure 10 R&D Expenditure of Irish-owned
and Foreign-owned Industry 1997 12
Figure 11 R&D Intensity in Irish-owned and
Foreign-owned Manufacturing 1991-1997 13
Figure 12 Profile of R&D Activity in Irish-owned
and Foreign-owned Firms 1997 14
Figure 13 Nature of R&D Activity in Irish-owned
and Foreign-owned Firms 1997 15
Figure 14 Patenting Activity of Irish-based Inventors 16
Figure 15 Top-line Results from the
This report presents an update on indicators of R&D and innovation performance in industry. It is based, for the most part, on the Survey of R&D Performing Enterprises relating to 1997. This survey is undertaken every second year in accordance with OECD guidelines set out in the Frascati Manual. The report also makes use of patent statistics and results from the Eurostat Community Innovation Survey which was undertaken in Ireland by Forfás.
There are a number of encouraging signs about innovation activity in industry based on the data which are examined:
■ Business sector R&D activity has continued to increase, with growth in expenditure (BERD) of 15% per annum since 1995, bringing this measure to £535m (€679m) (1.1% of GDP), in line with the EU average. Indigenous firms account for £192m (€244)(36%) and foreign-owned firms account for £343m (€436m)(64%).
■ The R&D intensity of indigenous manufacturing has doubled during the 1990s from
0.5% of gross output in 1991 to an estimated 1.1% based on the most recent survey.
■ Growth in R&D activity has been witnessed in each of the main R&D performing
sectors (electronics, pharmaceuticals, food & drink, software). The increase in R&D activity has not been confined to one sector.
■ R&D accounts for one-third of all innovation expenditure – manufacturing industry
spends in total 3.3% of sales on innovation related activities. The share of sales from new or improved products is in line with the EU average.
At the same time, there are many areas which give rise to concern and this should help to avoid any complacency about the innovation performance of industry:
■ R&D intensities of certain “high-tech” sectors lag far behind those found in other
countries. The R&D intensity of the pharmaceutical sector (at 5.1%) is almost one quarter of that found in the lead country, Sweden. The R&D intensity of the electronics sector (at 1.9%) is one fifth of that found in Sweden.
■ There are signs of a slowing-down in the growth rates in R&D activity – the growth rate of 15% per annum between 1995 and 1997 is less than the 20% per annum growth witnessed in the early-1990s.
■ The aggregate position masks the fact that most firms continue to make little or no investment in R&D. R&D activity is concentrated in a relatively small number of companies and the scale of R&D activity in the “average” R&D performing company is extremely low. The median spend for R&D performers is £67,000 (€85,072). ■ Indicators which focus on genuine technical novelty – such as patents granted in
the US – paint a far poorer picture of innovative performance and point to little or no change during the 1990s.
A1
Overall Trend in Business Expenditure
on Research and Development
In aggregate terms, R&D activity in industry continued to grow between 1995 and 1997. Total business expenditure on R&D in 1997 was £535m (€679m) or 1.1% of GDP. This places Ireland in 11th place out of 26 OECD countries and brings the country on a par with the European average. Aside from some of the larger EU Member States (Germany, UK and France), Ireland still lags behind Sweden, Finland and Denmark on this measure.
The above graph relates to the following table. This shows values in Irish pounds and euro equivalents. All conversions to euro were made using the irrevocably fixed conversion rate (1 euro = 0.787564 Irish pounds).
A N A LYSI S OF THE KEY ISSUE S
Figure 1: Business Expenditure on Research and Development 1991-1997
Constant Prices Current Prices
IR £ m €m IR £ m €m
1991 195 248 172 218
1992 242 307 220 279
1993 290 368 268 340
1994 349 443 330 419
1995 405 514 392 498
1996 471 598 464 589
1997 535 679 535 679
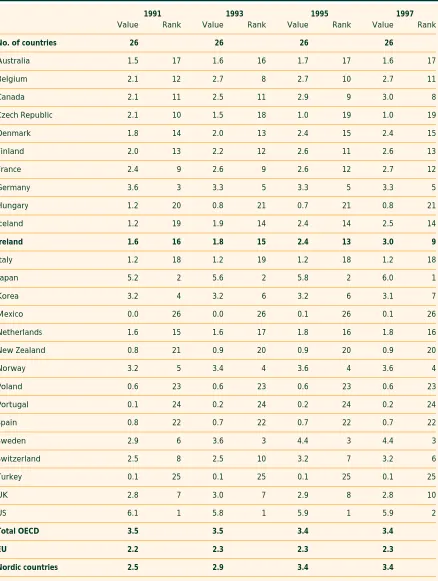
Figure 2 shows that Ireland’s overall rank on business expenditure on R&D and R&D personnel in industry has improved steadily during the 1990s. Ireland is quite unique in this regard – no other OECD economy has witnessed such a large relative change in business sector R&D performance.
It should be noted that there are signs of a slowing down in the growth rate of business sector R&D activity. The growth rate in R&D expenditure in real terms between 1995 and 1997 was 15% per annum – lower than that witnessed in the period 1991-1995 (20% per annum). Furthermore, when firms were asked in the survey to make projections for their expenditure in 1999, there is some evidence that growth on average will be lower again. This slowing down in the growth rate is not surprising as growth rates of 20% per annum could not be expected to continue indefinitely.
A2
Industry Share of Gross Expenditure
on Research and Development
The growth of business expenditure on R&D has changed the profile of R&D performance in the economy as other R&D performing sectors (higher education and government) have not witnessed the same level of growth during the 1990s. Figure 3 shows that R&D in the higher education sector has increased marginally from 0.22% of GDP in 1991 to an estimated 0.27% in 1997. R&D performed in the State sector has not increased at all as a percentage of GDP.
1991 1993 1995 1997
Business Expenditure on R&D (BERD) £172m £268m £392m £535m
Business Expenditure on R&D (BERD) €218m €340m €498m €679m
BERD as % of GDP 0.63 0.82 0.99 1.11
Rank among 26 OECD countries 17 16 13 11
Total R&D personnel 3,970 4,500 6,150 8,170
R&D personnel per 1000 labour force 3.0 3.2 4.2 5.3
Rank among 25 OECD countries 15 15 14 10
Total researchers in industry 2,128 2,576 3,690 5,098
Researchers per 1000 labour force 1.6 1.8 2.5 3.0
Rank among 26 OECD countries 16 15 13 9
See Tables B1, B2 and B3 in the appendices for detailed comparisons
The effect of this is that industry now accounts for three-quarters of R&D activity in the country compared to two-thirds at the beginning of the 1990s. Figure 4 shows how this structure of R&D performance compares with the EU and OECD averages.
The data show that the structure of R&D performance in Ireland is different to that found in the EU generally with greater reliance on the private sector in Ireland. Other countries with a high share of industry-performed R&D are Japan (71%), Korea (73%), Sweden (74%), Switzerland (71%) and USA (74%). While there is no right or wrong structure to R&D performance in an economy, it is important that private sector R&D is complemented by a research infrastructure in the public sector that provides a source of knowledge in the technologies important to industry both now and into the future.
A3
Government Funding of Business
Sector Research and Development
Government incentive schemes for R&D have played a part in the increase in R&D activity in industry. Figure 5 shows that between 1991 and 1997, a total of £150m (€190m) (in 1997 prices) has been made available to companies to encourage first time R&D performers and to get existing R&D performers to deepen their level of investment.
1991 1993 1995 1997
Business Sector (BERD) 0.61 0.82 0.99 1.11
Higher Education Sector (HERD) 0.22 0.25 0.27 0.27
Government Sector (GOVERD) 0.11 0.12 0.12 0.11
Private non-profit sector (PNP) 0.01 0.01 0.01 0.01
[image:10.595.136.473.138.249.2]Gross Expenditure on R&D (GERD) 0.95 1.20 1.39 1.50
Figure 3: Gross Expenditure on R&D as a Percentage of GDP 1991-1997
1991 1993 1995 1997
Ireland 64% 68% 71% 74%
EU average 63% 62% 62% 62%
OECD average 68% 67% 68% 68%
See Table B4 in the appendices for detailed comparisons
[image:10.595.135.473.330.422.2]These grants (mostly under EU supported initiatives such as Measure 6, Measure 1 and “RTI”) equate to 6% of the cumulative amount spent by industry on R&D over the period 1991 to 19971.
Figure 6 shows that, with the exception of 1993 (when the Measure 6 initiative was implemented), government financing of industry R&D has been in the region of 5%-6% of BERD. Furthermore, it is estimated that the £150m (€190.46m) provided in R&D grants represents 4.8% of State expenditure on enterprise development for the period 1991 to 1997.
The question raised by these data is whether this represents an adequate re-orientation of supports to industry in favour of research and development, especially given the fact that there are still large gaps in R&D intensity in key sectors in indigenous and foreign-owned industry compared to other countries.
BERD Government Government CSF element CSF element grants grants as of grants as % of
% BERD Grants
Constant Constant Constant 1997 Prices 1997 Prices 1997 Prices
1991-1997
Cumulative £2,485m £149.4m 6.0% £104m 70%
1991-1997
Cumulative €3,155m €189.7m 6.0% €132m 70%
Figure 5: Government Financing of Industry R&D in Ireland
1991 1993 1995 1997 1991-1997
cumulative (1997 prices)
Government grants for industry R&D £9.1m £32.5m £23.7m £28.9m £149.4m
Government grants for industry R&D €11.6m €41.3m €30.1m €36.7m €189.7m
Government grants for R&D
as a % of BERD 5.3% 12.2% 6.0% 5.4% 6.0%
Government grants for R&D as a % of all expenditure on
enterprise development 2.5% 8.6% 5.4% 5.3% 4.8%
[image:11.595.133.473.348.498.2]See Table B5 in the appendices for international comparisons of government financing of BERD
A4
Research and Development Expenditure Across Industry Sectors
Drilling deeper to find out more about the nature of R&D activity in the business sector, Figure 7 shows that four key sectors account for most R&D expenditure in industry. The broad electrical and electronics sector accounts for one third of expenditure (£194m) (€246m) with telecommunications related R&D being a particularly notable element. Pharmaceuticals accounts for the next largest share with £77m (€98m) being spent in this area in 1997. Food and drink accounts for £58m (€74m) and software R&D (which excludes routine development) accounts for an increasing share of BERD with £54m (€69m) being spent in this area in 1997. All other sectors combined make up the balance of R&D expenditure.
It is interesting to note that there has been a reasonably stable pattern in the sectoral composition of R&D expenditure indicating that growth has not been confined to one or two particular sectors.
The absolute amounts of money provide one perspective on the data and show the relative importance of different sectors. However, in terms of assessing how satisfactory this level of expenditure is, it is more meaningful to look at R&D intensities – R&D expressed as a percentage of the gross output of all firms. This analysis focuses on manufacturing only due to data availability problems for the services sector.
Figure 8 shows that the R&D intensity of manufacturing in Ireland was 1.2% in 1997, half the level found in OECD countries generally.
1991 1993 1995 1997
Business Expenditure on R&D (BERD) £176m £271m £392m £535m
Business Expenditure on R&D (BERD) €223m €344m €498m €679m
Electrical and electronic equipment 37% 36% 36% 36%
Pharmaceuticals 12% 18% 14% 14%
Food, drink and tobacco 12% 13% 12% 11%
Software 7% 6% 5% 10%
All other sectors 32% 27% 33% 29%
See Table B6 in the appendices for detailed sectoral breakdown
The R&D intensity of manufacturing sectors in Ireland relative to the OECD average and to the lead country for each sector are explored further in Figure 9.
[image:13.595.133.476.123.457.2]The most striking thing about this sectoral analysis is that the main gaps accounting for Ireland’s poor overall performance are in the more technologically advanced sectors (pharmaceuticals, instruments, electrical and electronic equipment, chemicals and transport equipment). The other sectors are by nature less R&D intensive so it is not surprising to find low values in Ireland. It is in Ireland’s so-called “high-tech” sectors that one sees the largest gaps. In large part, this is accounted for by the reluctance of foreign-owned multinationals to perform R&D in their Irish-based subsidiaries. It is appropriate that policy with regard to multinationals should continue to aim at encouraging this kind of activity, as operations based only on manufacturing are vulnerable to competitive forces from low cost economies.
A5
Research and Development Expenditure
in Irish and Foreign-owned Industry
The breakdown between indigenous industry and foreign-owned industry needs to be explored in order that the aggregate statistics can be better understood. Obviously, there is a different sectoral composition to indigenous industry compared to that of foreign-owned industry. This difference needs to be taken into account before a proper assessment can be made of the amounts of money being invested in R&D in indigenous industry and in foreign-owned industry.
Figure 10 provides some detail on the composition of R&D expenditure and R&D intensity in indigenous industry and foreign-owned industry.
R&D OECD Lead Percentage Percentage intensity average country point gap point gap
in Ireland – Ireland – Ireland vs.
1997 vs. OECD lead country
All Manufacturing 1.2 2.4 3.5 1.2 2.3
Pharmaceuticals 5.1 11.5 18.9 6.4 13.8
Instruments (incl.
Medical devices) 2.4 7.0 11.7 4.6 9.3
Electrical and
electronic equipment 1.9 5.6 11.1 3.7 9.2
Chemicals (less
pharmaceuticals) 0.4 3.2 6.0 2.8 5.6
Transport
equipment 2.2 4.5 6.3 2.3 4.1
Machinery and
equipment 1.7 2.1 3.6 0.4 1.9
Paper, printing
and publishing 0.1 0.4 0.7 0.3 0.6
Rubber and
plastic products 1.2 1.2 2.3 n/a 1.1
Food, drink, tobacco 0.5 0.3 0.6 n/a 0.1
Non-metallic
mineral products 1.0 0.8 1.9 n/a 0.9
Basic and fabricated metals 0.9 0.7 1.2 n/a 0.3
Wood and wood products 0.9 0.2 0.9 n/a n/a
Textiles & clothing 1.1 0.3 1.1 n/a n/a
See Table B8 in the appendices for detailed international comparisons
The table shows that:
■ The £192m (€244m) spent by indigenous industry in 1997 is concentrated in electrical and electronic equipment (19%), food and drink (18%) and software (18%). The remaining 45% is spread throughout the other sectors.
■ The £343m (€436m) spent by foreign-owned industry is concentrated primarily in electrical and electronic equipment (46%) and in pharmaceuticals (22%). The remaining 32% is spread across the other sectors but mostly in “advanced” sectors such as chemicals, instruments and software.
Irish-owned Foreign-owned
Share of R&D as a Share of R&D as a Expenditure % of gross Expenditure % of gross
output output
Food, drink, tobacco 18% 0.5% 6% 0.5%
Textiles & clothing 4% 1.9% 1% 0.5%
Wood and wood products 1% 0.7% * 1.4%
Paper, printing and publishing 2% 0.3% * 0.0%
Chemicals (less pharmaceuticals) 3% 0.8% 5% 0.4%
Pharmaceuticals 2% 4.0% 22% 5.1%
Rubber and plastic products 4% 1.7% 1% 0.8%
Non-metallic mineral products 4% 1.1% * 0.7%
Basic and fabricated metals 5% 1.3% * 0.2%
Machinery and equipment 6% 2.4% 3% 1.2%
Electrical and electronic equipment 19% 6.4% 46% 1.7%
Instruments (incl. medical devices) 4% 6.7% 7% 2.0%
Transport equipment 4% 1.8% 2% 2.8%
Other manufacturing 2% 0.5% * 0.2%
Total manufacturing 76% 1.1% 94% 1.2%
Software 18% 5%
Other services 6% 1%
Total business sector £ £192m £343m
Total business sector € €244m €436m
* Less than 1%
[image:15.595.133.474.139.550.2]See Tables B9 to B12 in the appendices for detailed analysis over time
In aggregate terms, the R&D intensity of indigenous manufacturing is similar to that of foreign-owned manufacturing (1.1% versus 1.2%). However, it is clear from Figure 10 that there is a different sectoral mix behind these aggregates. The R&D intensity of indigenous manufacturing is low by international standards because of the combined effect of R&D being performed in “low-tech” sectors and the R&D intensity of “high-tech” sectors being low by international standards. The R&D intensity of foreign-owned manufacturing is low almost exclusively because of the fact that the “high-tech” sectors in which foreign-owned companies operate (pharmaceuticals, electrical and electronics, instruments etc.) have R&D intensities that are considerably below international averages.
The detailed trends in the sectoral composition and R&D intensity of indigenous industry and foreign-owned industry are presented in the appendices. Figure 11 shows the R&D intensity of indigenous manufacturing has increased from 0.5% in 1991 to an estimated 1.1% in 1997. The R&D intensity of foreign-owned manufacturing has stayed in the range of 1.0% to 1.2% throughout the 1990s.
There are a number of issues that need to be considered in interpreting these numbers. With respect to foreign-owned manufacturing, a key point to bear in mind is that its output is likely to be based on very strong research and development – the issue is, however, that the R&D is not being done in Ireland. With respect to the greater increase in R&D intensity of indigenous manufacturing, it must be kept in mind that the
indigenous group is coming from a lower base and still accounts for only one-third of total expenditure. Also R&D intensities are affected by changes in gross output for the two groups – the gross output of foreign-owned manufacturing has been rising at a faster rate than that of indigenous manufacturing and this explains in part the larger apparent change in R&D intensity of the indigenous group.
1991 1993 1995 1997(e)
Indigenous Manufacturing
Expenditure on R&D (£m) 47.8 63.9 123.5 145.8
Expenditure on R&D (€m) 60.7 81.1 156.8 185.1
R&D as % of Gross output 0.5% 0.6% 1.1% 1.1%
Foreign-owned Manufacturing
Expenditure on R&D (£m) 107.0 179.8 241.6 323.3
Expenditure on R&D (€m) 135.9 228.3 306.8 410.5
R&D as % of Gross output 1.0% 1.2% 1.1% 1.2%
e = based on estimated gross output
See Tables B10 and B12 in the appendices for detailed sectoral breakdowns
A6
Distribution of R&D Activity
Among Irish and Foreign-owned Firms
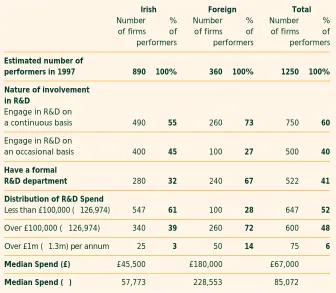
Moving down to the level of the firm, some insight can be gained into the scale of activity of the average Irish-owned R&D performer vis-à-vis its foreign-owned counterpart. In the Survey of Product and Process Innovation published in 1997, the point was made that Irish-owned firms were as likely to engage in innovative activity as their foreign-owned counterparts when comparisons are made between firms of similar size, operating in similar sectors. While this conclusion remains valid, the fact is that Irish-owned industry differs from that of foreign-owned industry in terms of its scale and positioning. Figure 12 highlights the nature of R&D activity within the two groups.
In overall terms, it is estimated that there were approximately 1,250 firms with some involvement in research and development in 1997 – 890 of these are Irish-owned and 360 are foreign-owned. However, the scale of R&D activity within these firms is very low in many cases and particularly so for the indigenous group.
45% of the indigenous performers (400 firms) describe their involvement in R&D as “occasional” indicating that their R&D personnel are only involved part-time in R&D activities. Among the foreign-owned R&D performers, a smaller proportion (27% or 100 firms) describe their involvement in R&D as “occasional”. This implies that there are approximately 500 Irish-owned companies with a continuous, full-time R&D function as against approximately 260 foreign-owned firms.
Irish Foreign Total
Number % Number % Number %
of firms of of firms of of firms of p e r f o r m e r s p e r f o r m e r s p e r f o r m e r s
Estimated number of
performers in 1997 890 100% 360 100% 1250 100%
Nature of involvement in R&D
Engage in R&D on
a continuous basis 490 55 260 73 750 60
Engage in R&D on
an occasional basis 400 45 100 27 500 40
Have a formal
R&D department 280 32 240 67 522 41
Distribution of R&D Spend
Less than £100,000 (€1 2 6 , 9 7 4 ) 547 61 100 28 647 52
Over £100,000 (€126,974) 340 39 260 72 600 48
Over £1m (€1.3m) per annum 25 3 50 14 75 6
Median Spend (£) £45,500 £180,000 £67,000
[image:17.595.137.473.284.577.2]Median Spend (€) €57,773 €228,553 €85,072
Focusing on the firms with a formal R&D department (i.e. R&D set up as a separate cost centre with its own personnel), we see that 32% of indigenous R&D performers (280 firms) claim to come within this definition as against 67% of foreign-owned performers (240 firms).
A similar picture emerges when we examine the distribution of R&D expenditure among R&D performers. Using a cut-off of £100,000 (€126,974), we find that only 39% of indigenous R&D performers are above this level (340 firms) as against 72% of foreign-owned performers (260 firms). This is reflected in the median spend of the R&D performers – in the case of indigenous firms, it is £45,500 (€57,773) and in the case of foreign-owned firms, it is £180,000 (€228,553).
In overall terms, these variables point to the same conclusion – the scale of R&D activity among indigenous firms tends to be a good deal lower than that of foreign-owned firms and really this is a reflection of the structure of the industrial base in Ireland. While it is encouraging that the numbers of R&D performers is rising (from approximately 820 in the 1993 census to approximately 1,250 in 1997), it must be borne in mind that the scale of activity is very low in many cases, particularly among the indigenous cohort.
Continuing the comparison of indigenous and foreign-owned groups, there are some differences in the nature of their R&D activity. Figure 13 shows that the indigenous firms as a group claim that 39% of their R&D is at the “research” end of the spectrum while 61% of expenditure would come under the heading of “experimental development”. This suggests there is a proportionately greater element of research in the indigenous R&D compared to the 24% of foreign-owned R&D which is classified under the “research” heading.
Irish-owned Foreign-owned
Expenditure on R&D £192m £343m
Expenditure on R&D €244m €436m
Nature of R&D Activity
Basic and applied research 39% 24%
Experimental development 61% 76%
Orientation of R&D work
Developing new products 54% 51%
Improving existing products 23% 25%
Developing new processes 13% 13%
[image:18.595.129.473.469.682.2]Improving existing processes 10% 11%
The results suggest that there is greater novelty associated with the R&D of indigenous firms and this might be explained by the suggestion that parent companies tend to give lower end development activity to their foreign subsidiaries while the more novel research resides in the home country.
The orientation of the R&D activity is also assessed in the survey in terms of whether work is focused on products or processes. Contrary to a view sometimes expressed that foreign-owned subsidiaries tend to work mostly on process R&D, the survey suggests that there is a rather similar profile to the R&D activity of indigenous firms and foreign-owned firms. In both cases, approximately three quarters of R&D expenditure is allocated to work on new or improved products.
A7
Examination of Other Indicators of Technological Performance
Finally, it is worth contrasting these R&D statistics with other indicators of technological performance to see if they paint a similar or different picture of innovation in industry. R&D statistics are only one measure of innovative capability and no one set of statistics can fully reflect the very complex nature of the innovation process.
Patent statistics provide another perspective on technological strength and might be considered more discriminatory in some respects in that they focus on genuine novelty as against minor incremental improvements. Three different measures of patenting activity are set out in Figure 14.
1991 1993 1995 1996
Resident patent applications 786 795 853 805
Resident patent application per 10,000 pop. 2.2 2.2 2.4 2.2
Rank among 28 countries 13 14 13 15
Applications to European Patent Office 64 66 131
EPO applications per 10,000 pop. 0.2 0.2 0.4
Rank among 28 countries 18 19 18
Patents granted in US 55 53 52
Patents granted in US per 10,000 pop. 0.2 0.1 0.1
Rank among 23 countries 17 18 18
[image:19.595.135.474.419.635.2]See Tables B13, B14 and B15 in the appendices for detailed comparisons
In general, these statistics present a poorer picture of innovative capacity in industry compared to the messages coming from the R&D statistics. They suggest that innovation activity has been rather static over the 1990s and this message is difficult to reconcile with the marked increase in business sector R&D activity.
Resident patent applications per 10,000 population places Ireland in 15th position out of 28 countries, a lower placing than was the case in 1991. Applications to the European Patent Office from Ireland suggest an even poorer ranking (18th out of 28 countries) and Ireland appears even weaker again (18th out of 23 countries) in terms of the number of patents granted in the US to parties resident in Ireland.
Based on a listing of firms taking out patents in the US, it is noticeable that many of the significant foreign-owned R&D performers in the country do not appear to take out patents as Irish residents. This would suggest that either their work is not being patented at all or patents are being taken out by parent enterprises.
Another source of data on innovation performance comes from the Community Innovation Survey (CIS), the Irish element of which is performed by Forfás. The first comparisons of the results from the most recent CIS suggest that, as is the case with R&D, Ireland’s performance could be considered as “average” relative to the rest of the EU.
The proportion of firms claiming to have introduced new or improved products is above the EU average but this is a very crude measure of innovation performance. 27% of firms claim to have introduced products that were new not just to the firm but to the market generally and this compares to 20% for the EU average. In terms of innovation
expenditure, Ireland is somewhat below the EU average (3.3% of sales as against 3.8% in the EU generally). Given that R&D intensity has been measured at 1.2%, it would appear that R&D accounts for approximately one third of all innovation-related expenditure in industry, a result which is consistent with the first CIS undertaken earlier in the 1990s.
Ireland EU Average
Proportion of firms with 20+ employees introducing
new or improved products between 1994 and 1996 66% 48%
Proportion of firms introducing products completely
new to the market between 1994 and 1996 27% 20%
Total expenditure on innovation activities in 1996
as a percentage of sales 3.3% 3.8%
Share of 1996 turnover from new or improved products 32% 31%
Share of 1996 turnover from products completely new
to the market 8.5% 6.6%
See Table B16 in the appendices for detailed comparisons
The share of sales coming from products developed or changed in the previous three years is 32% and this is on par with the EU average. 8.5% of sales come from products completely new to the market and not just new to the firm. It is important to keep in mind that the development work for these new or changed products may not have been undertaken in Ireland and the figures could overstate the innovative capacity of industry in Ireland.
The detailed sectoral analysis of these data is presented in Table B16 in the appendices and the data appear to be consistent with R&D statistics in the rank order of different sectors according to their “innovativeness”.
B1 Business Expenditure on Research and Development as a percentage of GDP
B2 Total Business Sector R&D Personnel per 1000 Labour Force
B3 Business Sector Researchers per 1000 Labour Force
B4 Proportion of All R&D Performed in the Business Sector
B5 Proportion of Business Sector R&D Financed by Government
B6 Distribution of R&D Expenditure by Sector – All Firms
B7 R&D Expenditure in Manufacturing to Gross Output – All Firms
B8 R&D Expenditure in Manufacturing to Gross Output – International Comparisons
B9 Distribution of R&D Expenditure by Sector – Irish-owned Firms
B10 R&D Spend in Manufacturing to Gross Output – Irish-owned Firms
B11 Distribution of R&D Expenditure by Sector – Foreign-owned Firms
B12 R&D Spend in Manufacturing to Gross Output – Foreign-owned Firms
B13 Resident patent applications per 10,000 population
B14 EPO patent applications per 10,000 population
B15 Patents granted by US Patent and Trademark Office per 10,000 population
B16 Top-line Results from the Community Innovation Survey 1994-1996
1991 1993 1995 1997
Value Rank Value Rank Value Rank Value Rank
No. of countries 26 26 26 26
Australia 0.61% 18 0.73% 17 0.89% 16 0.81% 16
Belgium 1.09% 11 1.01% 11 1.07% 12 1.07% 13
Canada 0.81% 15 0.91% 14 0.97% 14 1.03% 14
Czech Republic 1.41% 9 0.90% 15 0.68% 17 0.73% 17
Denmark 1.00% 13 1.05% 10 1.10% 10 1.26% 9
Finland 1.18% 10 1.29% 9 1.49% 7 1.91% 6
France 1.48% 7 1.51% 7 1.43% 8 1.38% 8
Germany 1.81% 6 1.62% 6 1.53% 6 1.63% 7
Hungary 0.44% 20 0.32% 22 0.33% 21 0.31% 21
Iceland 0.25% 23 0.42% 20 0.49% 19 0.57% 19
Ireland 0.63% 17 0.82% 16 0.99% 13 1.11% 11
Italy 0.69% 16 0.61% 18 0.54% 18 0.58% 18
Japan 2.13% 1 1.90% 3 1.94% 3 2.01% 3
Korea 1.98% 3 1.98% 2 1.98% 2 2.04% 2
Mexico 0.01% 26 0.02% 26 0.06% 26 0.06% 26
Netherlands 1.02% 12 0.99% 12 1.08% 11 1.10% 12
New Zealand 0.27% 22 0.31% 23 0.26% 23 0.26% 23
Norway 0.90% 14 0.93% 13 0.97% 15 0.97% 15
Poland 0.34% 21 0.34% 21 0.29% 22 0.31% 22
Portugal 0.16% 24 0.14% 24 0.12% 24 0.12% 24
Spain 0.49% 19 0.43% 19 0.41% 20 0.44% 20
Sweden 1.98% 4 2.36% 1 2.67% 1 2.67% 1
Switzerland 1.86% 5 1.86% 4 1.86% 5 1.94% 5
Turkey 0.11% 25 0.10% 25 0.09% 25 0.12% 25
UK 1.42% 8 1.44% 8 1.32% 9 1.26% 10
US 2.05% 2 1.85% 5 1.88% 4 1.96% 4
Total OECD 1.58% 1.46% 1.46% 1.49%
EU 1.23% 1.19% 1.14% 1.15%
Nordic countries 1.36% 1.52% 1.69% 1.69%
[image:23.595.28.474.139.714.2]Source: OECD – Main Science and Technology Indicators (Nearest year used if data not available for a particular year)
1991 1993 1995 1997
Value Rank Value Rank Value Rank Value Rank
No. of countries 25 25 25 25
Australia 2.5 18 2.7 17 3.0 16 2.8 16
Belgium 5.3 9 5.2 10 5.3 9 5.3 9
Canada 3.8 14 4.2 14 4.7 12 4.9 12
Czech Republic 10.8 1 5.3 9 2.2 18 2.2 18
Denmark 5.2 10 5.5 8 6.1 7 6.3 7
Finland 5.9 7 6.1 6 7.1 5 8.2 4
France 6.2 6 6.5 5 6.4 6 6.3 6
Germany 8.1 4 7.4 4 7.2 4 7.4 5
Hungary 2.9 16 1.8 19 1.7 20 1.6 21
Iceland 2.0 19 2.8 16 3.7 15 3.9 15
Ireland 3.0 15 3.2 15 4.2 14 5.3 10
Italy 2.7 17 2.7 18 2.6 17 2.6 17
Japan 8.7 2 8.8 1 8.6 2 8.8 2
Korea 4.7 12 4.7 12 4.7 13 4.2 14
Mexico 0.1 25 0.1 25 0.1 25 0.1 25
Netherlands 4.3 13 4.4 13 5.1 11 5.3 11
New Zealand 1.5 21 1.7 21 1.6 21 1.6 20
Norway 4.7 11 5.0 11 5.5 8 5.5 8
Poland 1.5 22 1.5 22 1.5 22 1.4 22
Portugal 0.4 23 0.4 23 0.4 23 0.4 23
Spain 1.9 20 1.8 20 1.7 19 1.9 19
Sweden 7.5 5 8.2 3 9.6 1 9.6 1
Switzerland 8.6 3 8.6 2 8.6 3 8.7 3
Turkey 0.1 24 0.1 24 0.2 24 0.2 24
UK 5.6 8 5.8 7 5.1 10 4.9 13
US
Total OECD
EU 5.2 5.1 5.0 5.0
[image:24.595.31.472.134.718.2]Nordic countries 6.1 6.5 7.5 7.5
1991 1993 1995 1997
Value Rank Value Rank Value Rank Value Rank
No. of countries 26 26 26 26
Australia 1.5 17 1.6 16 1.7 17 1.6 17
Belgium 2.1 12 2.7 8 2.7 10 2.7 11
Canada 2.1 11 2.5 11 2.9 9 3.0 8
Czech Republic 2.1 10 1.5 18 1.0 19 1.0 19
Denmark 1.8 14 2.0 13 2.4 15 2.4 15
Finland 2.0 13 2.2 12 2.6 11 2.6 13
France 2.4 9 2.6 9 2.6 12 2.7 12
Germany 3.6 3 3.3 5 3.3 5 3.3 5
Hungary 1.2 20 0.8 21 0.7 21 0.8 21
Iceland 1.2 19 1.9 14 2.4 14 2.5 14
Ireland 1.6 16 1.8 15 2.4 13 3.0 9
Italy 1.2 18 1.2 19 1.2 18 1.2 18
Japan 5.2 2 5.6 2 5.8 2 6.0 1
Korea 3.2 4 3.2 6 3.2 6 3.1 7
Mexico 0.0 26 0.0 26 0.1 26 0.1 26
Netherlands 1.6 15 1.6 17 1.8 16 1.8 16
New Zealand 0.8 21 0.9 20 0.9 20 0.9 20
Norway 3.2 5 3.4 4 3.6 4 3.6 4
Poland 0.6 23 0.6 23 0.6 23 0.6 23
Portugal 0.1 24 0.2 24 0.2 24 0.2 24
Spain 0.8 22 0.7 22 0.7 22 0.7 22
Sweden 2.9 6 3.6 3 4.4 3 4.4 3
Switzerland 2.5 8 2.5 10 3.2 7 3.2 6
Turkey 0.1 25 0.1 25 0.1 25 0.1 25
UK 2.8 7 3.0 7 2.9 8 2.8 10
US 6.1 1 5.8 1 5.9 1 5.9 2
Total OECD 3.5 3.5 3.4 3.4
EU 2.2 2.3 2.3 2.3
Nordic countries 2.5 2.9 3.4 3.4
[image:25.595.31.469.136.717.2]Source: OECD – Main Science and Technology Indicators (Nearest year used if data not available for a particular year)
1991 1993 1995 1997
Value Rank Value Rank Value Rank Value Rank
No. of countries 26 26 26 26
Australia 40% 21 44% 19 47% 19 47% 19
Belgium 66% 9 64% 10 67% 6 67% 9
Canada 53% 17 56% 14 60% 13 63% 11
Czech Republic 69% 5 73% 2 65% 10 63% 12
Denmark 59% 12 58% 13 57% 14 63% 13
Finland 57% 13 58% 12 63% 11 69% 7
France 61% 11 62% 11 61% 12 61% 14
Germany 69% 6 67% 8 66% 7 68% 8
Hungary 41% 19 33% 21 43% 20 42% 20
Iceland 22% 24 31% 22 32% 22 36% 22
Ireland 64% 10 68% 6 71% 4 74% 3
Italy 56% 15 54% 15 53% 16 55% 16
Japan 71% 3 66% 9 65% 9 71% 5
Korea 74% 1 74% 1 74% 2 73% 4
Mexico 10% 26 10% 26 21% 25 21% 25
Netherlands 50% 18 49% 17 52% 17 53% 17
New Zealand 27% 22 30% 23 27% 23 27% 23
Norway 55% 16 54% 16 57% 15 57% 15
Poland 41% 20 41% 20 39% 21 41% 21
Portugal 26% 23 22% 25 20% 26 20% 26
Spain 56% 14 48% 18 48% 18 49% 18
Sweden 68% 7 70% 5 74% 1 74% 2
Switzerland 70% 4 70% 4 70% 5 71% 6
Turkey 21% 25 23% 24 24% 24 26% 24
UK 67% 8 67% 7 65% 8 65% 10
US 73% 2 71% 3 72% 3 74% 1
Total OECD 68% 67% 68% 68%
EU 63% 62% 62% 62%
[image:26.595.28.474.136.715.2]Nordic countries 63% 63% 67% 67%
1991 1993 1995 1997
Value Rank Value Rank Value Rank Value Rank
No. of countries 26 26 26 26
Australia 3.0 22 2.4 22 2.4 23 2.6 23
Belgium 7.8 14 7.2 16 4.4 19 4.4 19
Canada 9.8 11 9.8 12 6.9 11 7.0 12
Czech Republic 4.1 19 4.1 20 4.5 17 7.9 10
Denmark 7.9 13 5.8 19 5.4 15 5.1 18
Finland 5.4 18 6.1 18 5.6 14 5.6 14
France 22.3 3 15.3 4 12.7 5 13.1 4
Germany 10.0 10 9.0 14 8.8 10 8.4 9
Hungary 11.4 7 11.4 8 16.2 4 14.7 3
Iceland 9.6 12 14.4 5 3.3 21 3.3 21
Ireland 3.7 20 10.6 10 4.5 17 5.3 16
Italy 11.8 6 13.4 6 16.7 3 10.0 6
Japan 1.4 24 1.4 24 1.6 26 1.1 26
Korea 3.6 21 3.6 21 3.6 20 4.4 19
Mexico 0.0 25 0.5 25 2.8 22 2.8 22
Netherlands 7.5 15 7.8 15 6.6 13 5.6 14
New Zealand 6.8 16 6.9 17 6.9 11 6.9 13
Norway 15.9 4 16.0 3 11.9 6 11.9 5
Poland 33.9 1 33.9 1 33.8 1 28.2 1
Portugal 6.5 17 9.1 13 5.2 16 5.2 17
Spain 11.3 8 10.6 10 9.2 9 7.9 10
Sweden 10.4 9 10.8 9 9.5 8 9.5 7
Switzerland 1.7 23 1.7 23 2.4 23 2.4 24
Turkey 0.0 25 0.1 26 1.7 25 1.9 25
UK 14.6 5 12.4 7 11.3 7 9.5 7
US 22.5 2 19.4 2 17.8 2 15.0 2
Total OECD 14.9 12.9 11.6 10.7
EU 13.4 11.3 10.4 9.6
Nordic countries 10.4 9.9 8.4 8.4
[image:27.595.31.470.135.718.2]Source: OECD – Main Science and Technology Indicators (Nearest year used if data not available for a particular year)
1991 1993 1995 1997
£’000 Share £’000 Share £’000 Share £’000 Share
of Total of Total of Total of Total
Food, drink, tobacco 21,404 12% 34,985 13% 46,004 12% 57,552 11%
Textiles & clothing 4,802 3% 7,129 3% 14,092 4% 9,509 2%
Wood and wood products 311 0% 262 0% 2,644 1% 3,409 1%
Paper, printing
and publishing 1,235 1% 2,671 1% 6,667 2% 3,722 1%
Chemicals
(less pharmaceutical) 10,770 6% 10,083 4% 13,274 3% 22,984 4%
Pharmaceuticals 21,239 12% 48,312 18% 54,432 14% 76,906 14%
Rubber and plastic products 2,087 1% 3,715 1% 9,558 2% 10,684 2%
Non-metallic
mineral products 3,883 2% 4,146 2% 9,559 2% 8,448 2%
Basic and fabricated metals 4,141 2% 5,342 2% 12,389 3% 10,256 2%
Machinery and equipment 5,094 3% 7,983 3% 13,751 4% 20,603 4%
Electrical and
electronic equipment 63,132 37% 96,713 36% 141,029 36% 193,901 36%
Instruments 6,290 4% 15,046 6% 23,668 6% 32,427 6%
Transport equipment 6,946 4% 4,016 2% 6,812 2% 13,911 3%
Other manufacturing 2,789 2% 2,987 1% 10,089 3% 4,414 1%
Total manufacturing 154,711 90% 243,708 91% 365,066 93% 469,048 88%
Software 12,039 7% 15,138 6% 17,845 5% 51,594 10%
Other services 5,381 3% 8,722 3% 9,414 2% 14,164 3%
Total business sector 172,132 100% 267,568 100% 392,326 100% 534,806 100%
[image:28.595.31.466.137.552.2]Source: Forfás Surveys of Research and Development 1991 to 1997
1991 1993 1995 1997
€’000 Share €’000 Share €’000 Share €’000 Share
of Total of Total of Total of Total
Food, drink, tobacco 27,177 12% 44,422 13% 58,413 12% 73,076 11%
Textiles & clothing 6,097 3% 9,052 3% 17,893 4% 12,074 2%
Wood and wood products 395 0% 333 0% 3,357 1% 4,329 1%
Paper, printing
and publishing 1,568 1% 3,391 1% 8,465 2% 4,726 1%
Chemicals
(less pharmaceutical) 13,675 6% 12,803 4% 16,855 3% 29,184 4%
Pharmaceuticals 26,968 12% 61,344 18% 69,114 14% 97,650 14%
Rubber and
plastic products 2,650 1% 4,717 1% 12,136 2% 13,566 2%
Non-metallic
mineral products 4,930 2% 5,264 2% 12,137 2% 10,727 2%
Basic and fabricated metals 5,258 2% 6,783 2% 15,731 3% 13,022 2%
Machinery and equipment 6,468 3% 10,136 3% 17,460 4% 26,160 4%
Electrical and
electronic equipment 80,161 37% 122,800 36% 179,070 36% 246,203 36%
Instruments 7,987 4% 19,104 6% 30,052 6% 41,174 6%
Transport equipment 8,820 4% 5,099 2% 8,649 2% 17,663 3%
Other manufacturing 3,541 2% 3,793 1% 12,810 3% 5,605 1%
Total manufacturing 196,442 90% 309,445 91% 463,538 93% 595,568 88%
Software 15,286 7% 19,221 6% 22,658 5% 65,511 10%
Other services 6,832 3% 11,075 3% 11,953 2% 17,985 3%
Total business sector 218,563 100% 339,741 100% 498,151 100% 679,064 100%
[image:29.595.30.467.136.563.2]Source: Forfás Surveys of Research and Development 1991 to 1997
1991 1993 1995 1997
£’000 % of £’000 % of £’000 % of £’000 % of
output output output output
Food, drink, tobacco 21,404 0.3% 34,985 0.4% 46,004 0.5% 57,552 0.5%
Textiles & clothing 4,802 0.6% 7,129 1.0% 14,092 1.8% 9,509 1.1%
Wood and wood products 311 0.1% 262 0.1% 2,644 0.8% 3,409 0.9%
Paper, printing
and publishing 1,235 0.1% 2,671 0.1% 6,667 0.2% 3,722 0.1%
Chemicals
(less pharmaceuticals) 10,770 0.5% 10,083 0.3% 13,274 0.3% 22,984 0.4%
Pharmaceuticals 21,239 4.9% 48,312 7.4% 54,432 4.2% 76,906 5.1%
Rubber and plastic products 2,087 0.4% 3,715 0.7% 9,558 1.3% 10,684 1.2%
Non-metallic
mineral products 3,883 0.7% 4,146 0.7% 9,559 1.3% 8,448 1.0%
Basic and fabricated metals 4,141 0.5% 5,342 0.6% 12,389 1.2% 10,256 0.9%
Machinery and equipment 5,094 0.7% 7,983 1.0% 13,751 1.3% 20,603 1.7%
Electrical and
electronic equipment 63,132 2.0% 96,713 2.2% 141,029 1.7% 193,901 1.9%
Instruments 6,290 1.0% 15,046 1.8% 23,668 2.4% 32,427 2.4%
Transport equipment 6,946 1.7% 4,016 1.0% 6,812 1.3% 13,911 2.2%
Other manufacturing 2,789 0.4% 2,987 0.4% 10,089 1.1% 4,414 0.4%
Total manufacturing 154,711 0.7% 243,708 1.0% 365,066 1.1% 469,048 1.2%
[image:30.595.30.473.136.495.2]Source: Forfás Surveys of Research and Development 1991 to 1997 and CSO Census of Industrial Production (estimate for 1997)
1991 1993 1995 1997
€’000 % of €’000 % of €’000 % of €’000 % of
output output output output
Food, drink, tobacco 27,177 0.3% 44,422 0.4% 58,413 0.5% 73,076 0.5%
Textiles & clothing 6,097 0.6% 9,052 1.0% 17,893 1.8% 12,074 1.1%
Wood and wood products 395 0.1% 333 0.1% 3,357 0.8% 4,329 0.9%
Paper, printing
and publishing 1,568 0.1% 3,391 0.1% 8,465 0.2% 4,726 0.1%
Chemicals
(less pharmaceuticals) 13,675 0.5% 12,803 0.3% 16,855 0.3% 29,184 0.4%
Pharmaceuticals 26,968 4.9% 61,344 7.4% 69,114 4.2% 97,650 5.1%
Rubber and plastic products 2,650 0.4% 4,717 0.7% 12,136 1.3% 13,566 1.2%
Non-metallic
mineral products 4,930 0.7% 5,264 0.7% 12,137 1.3% 10,727 1.0%
Basic and fabricated metals 5,258 0.5% 6,783 0.6% 15,731 1.2% 13,022 0.9%
Machinery and equipment 6,468 0.7% 10,136 1.0% 17,460 1.3% 26,160 1.7%
Electrical and
electronic equipment 80,161 2.0% 122,800 2.2% 179,070 1.7% 246,203 1.9%
Instruments 7,987 1.0% 19,104 1.8% 30,052 2.4% 41,174 2.4%
Transport equipment 8,820 1.7% 5,099 1.0% 8,649 1.3% 17,663 2.2%
Other manufacturing 3,541 0.4% 3,793 0.4% 12,810 1.1% 5,605 0.4%
Total manufacturing 196,442 0.7% 309,445 1.0% 463,538 1.1% 595,568 1.2%
[image:31.595.30.473.137.495.2]Source: Forfás Surveys of Research and Development 1991 to 1997 and CSO Census of Industrial Production (estimate for 1997)
Irl Can Den Ger Fin Fra Jap Nth Nor Esp Swe UK USA OECD EU
Total
manufacturing 1.2 1.2 1.7 2.3 1.9 2.6 2.7 1.7 1.4 0.6 3.5 1.8 2.9 2.4 1.8
Food, drink,
tobacco 0.5 0.2 0.4 0.1 0.5 0.3 0.6 0.5 0.4 0.1 0.4 0.3 0.3 0.3 0.2
Textiles
& clothing 1.1 0.4 0.1 0.4 0.5 0.3 0.7 0.3 0.7 0.2 0.6 0.1 0.2 0.3 0.2
Wood and
wood products 0.9 0.1 0.1 0.2 0.2 0.3 0.4 0.0 0.2 0.1 0.1 0.1 0.2 0.2 0.1
Paper, printing
and publishing 0.1 0.3 0.1 0.1 0.5 0.1 0.3 0.1 0.5 0.1 0.7 0.1 0.5 0.4 0.2
Chemicals (less
pharmaceutical) 0.4 0.7 1.3 3.9 2.5 3.6 6.0 3.5 3.1 0.5 1.9 2.9 3.0 3.2 2.7
Pharmaceuticals 5.1 8.2 13.2 8.2 16.0 8.8 13.1 8.0 13.6 2.5 18.9 16.4 13.1 11.5 9.3
Rubber and
plastic products 1.2 0.3 0.9 0.8 2.3 1.5 2.1 0.7 0.7 0.5 2.2 0.4 1.2 1.2 0.8
Non-metallic
mineral products 1.0 0.2 0.3 0.6 1.9 0.9 1.9 0.3 0.5 0.3 0.7 0.4 0.8 0.8 0.4
Basic and
fabricated metals 0.9 0.6 0.7 0.5 0.8 0.8 1.0 1.2 1.0 0.3 0.8 0.4 0.5 0.7 0.5
Machinery and
equipment 1.7 0.8 2.8 2.3 3.4 2.4 3.4 0.8 1.0 1.1 3.6 1.9 1.7 2.1 1.9
Electrical and
electronic equipt 1.9 7.9 4.5 5.5 7.9 8.3 5.1 8.2 8.9 2.5 11.1 4.1 6.0 5.6 5.3
Instruments 2.4 2.0 8.0 3.2 6.8 2.3 8.2 1.6 8.3 4.0 11.7 1.5 8.5 7.0 2.5
Transport
equipment 2.2 1.0 1.1 4.9 1.4 5.6 2.6 2.5 1.1 1.3 6.2 3.6 6.3 4.5 4.2
Other
manufacturing 0.4 1.9 8.7 0.6 1.6 0.5 0.5 1.3 0.5 0.4 0.4 0.6 1.9 1.0 0.6
[image:32.595.32.473.139.577.2]Source: OECD STAN Database (data relate to 1994 in most cases)
1991 1993 1995 1997
£’000 Share £’000 Share £’000 Share £’000 Share
of Total of Total of Total of Total
Food, drink, tobacco 12,487 22% 22,228 27% 31,654 22% 35,310 18%
Textiles & clothing 3,232 6% 1,812 2% 7,534 5% 7,173 4%
Wood and wood products 311 1% 255 0% 1,610 1% 1,970 1%
Paper, printing
and publishing 821 1% 2,130 3% 6,167 4% 3,117 2%
Chemicals
(less pharmaceutical) 3,459 6% 1,718 2% 2,992 2% 4,910 3%
Pharmaceuticals 1,788 3% 2,814 3% 3,756 3% 3,093 2%
Rubber and
plastic products 1,593 3% 2,520 3% 6,526 5% 6,962 4%
Non-metallic
mineral products 3,265 6% 3,037 4% 7,482 5% 7,588 4%
Basic and fabricated metals 3,260 6% 4,549 6% 10,555 8% 9,480 5%
Machinery and equipment 3,231 6% 4,931 6% 8,353 6% 11,259 6%
Electrical and
electronic equipment 7,440 13% 11,826 14% 19,358 14% 35,969 19%
Instruments 1,851 3% 2,107 3% 4,217 3% 7,768 4%
Transport equipment 2,236 4% 1,512 2% 4,737 3% 7,151 4%
Other manufacturing 2,225 4% 2,146 3% 7,441 5% 3,713 2%
Total manufacturing 47,756 83% 63,867 78% 123,482 88% 145,787 76%
Software 4,595 8% 9,638 12% 12,511 9% 34,553 18%
Other services 5,381 9% 8,472 10% 4,717 3% 11,631 6%
Total business sector 57,732 100% 81,977 100% 140,710 100% 191,971 100%
[image:33.595.30.467.135.563.2]Source: Forfás Surveys of Research and Development 1991 to 1997
1991 1993 1995 1997
€’000 Share €’000 Share €’000 Share €’000 Share
of Total of Total of Total of Total
Food, drink, tobacco 15,855 22% 28,224 27% 40,192 22% 44,834 18%
Textiles & clothing 4,104 6% 2,301 2% 9,566 5% 9,108 4%
Wood and wood products 395 1% 324 0% 2,044 1% 2,501 1%
Paper, printing
and publishing 1,042 1% 2,705 3% 7,830 4% 3,958 2%
Chemicals
(less pharmaceutical) 4,392 6% 2,181 2% 3,799 2% 6,234 3%
Pharmaceuticals 2,270 3% 3,573 3% 4,769 3% 3,927 2%
Rubber and plastic products 2,023 3% 3,200 3% 8,286 5% 8,840 4%
Non-metallic
mineral products 4,146 6% 3,856 4% 9,500 5% 9,635 4%
Basic and fabricated metals 4,139 6% 5,776 6% 13,402 8% 12,037 5%
Machinery and equipment 4,103 6% 6,261 6% 10,606 6% 14,296 6%
Electrical and
electronic equipment 9,447 13% 15,016 14% 24,580 14% 45,671 19%
Instruments 2,350 3% 2,675 3% 5,354 3% 9,863 4%
Transport equipment 2,839 4% 1,920 2% 6,015 3% 9,080 4%
Other manufacturing 2,825 4% 2,725 3% 9,448 5% 4,715 2%
Total manufacturing 60,638 83% 81,094 78% 156,790 88% 185,11 76%
Software 5,834 8% 12,238 12% 15,886 9% 43,873 18%
Other services 6,832 9% 10,757 10% 5,989 3% 14,768 6%
[image:34.595.30.467.136.553.2]Total business sector 73,305 100% 104,089 100% 178,665 100% 243,754 100%
1991 1993 1995 1997
£’000 % of £’000 % of £’000 % of £’000 % of
output output output output
Food, drink, tobacco 12,487 0.2% 22,228 0.4% 31,654 0.5% 35,310 0.5%
Textiles & clothing 3,232 1.0% 1,812 0.6% 7,534 2.2% 7,173 1.9%
Wood and wood products 311 0.2% 255 0.1% 1,610 0.7% 1,970 0.7%
Paper, printing
and publishing 821 0.1% 2,130 0.2% 6,167 0.6% 3,117 0.3%
Chemicals
(less pharmaceutical) 3,459 0.8% 1,718 0.4% 2,992 0.7% 4,910 0.8%
Pharmaceuticals 1,788 3.9% 2,814 5.3% 3,756 5.8% 3,093 4.0%
Rubber and
plastic products 1,593 0.7% 2,520 1.1% 6,526 2.1% 6,962 1.7%
Non-metallic
mineral products 3,265 0.7% 3,037 0.6% 7,482 1.2% 7,588 1.1%
Basic and fabricated metals 3,260 0.7% 4,549 1.0% 10,555 1.8% 9,480 1.3%
Machinery and equipment 3,231 1.4% 4,931 1.8% 8,353 2.3% 11,259 2.4%
Electrical and
electronic equipment 7,440 3.3% 11,826 4.4% 19,358 5.3% 35,969 6.4%
Instruments 1,851 5.8% 2,107 3.6% 4,217 5.6% 7,768 6.7%
Transport equipment 2,236 0.7% 1,512 0.5% 4,737 1.5% 7,151 1.8%
Other manufacturing 2,225 0.4% 2,146 0.4% 7,441 1.3% 3,713 0.5%
Total manufacturing 47,756 0.5% 63,867 0.6% 123,482 1.1% 145,787 1.1%
[image:35.595.29.474.137.510.2]Source: Forfás Surveys of Research and Development 1991 to 1997 and CSO Census of Industrial Production (estimate for 1997)
1991 1993 1995 1997
€’000 % of €’000 % of €’000 % of €’000 % of
output output output output
Food, drink, tobacco 15,855 0.2% 28,224 0.4% 40,192 0.5% 44,834 0.5%
Textiles & clothing 4,104 1.0% 2,301 0.6% 9,566 2.2% 9,108 1.9%
Wood and wood products 395 0.2% 324 0.1% 2,044 0.7% 2,501 0.7%
Paper, printing
and publishing 1,042 0.1% 2,705 0.2% 7,830 0.6% 3,958 0.3%
Chemicals
(less pharmaceutical) 4,392 0.8% 2,181 0.4% 3,799 0.7% 6,234 0.8%
Pharmaceuticals 2,270 3.9% 3,573 5.3% 4,769 5.8% 3,927 4.0%
Rubber and
plastic products 2,023 0.7% 3,200 1.1% 8,286 2.1% 8,840 1.7%
Non-metallic
mineral products 4,146 0.7% 3,856 0.6% 9,500 1.2% 9,635 1.1%
Basic and fabricated metals 4,139 0.7% 5,776 1.0% 13,402 1.8% 12,037 1.3%
Machinery and equipment 4,103 1.4% 6,261 1.8% 10,606 2.3% 14,296 2.4%
Electrical and
electronic equipment 9,447 3.3% 15,016 4.4% 24,580 5.3% 45,671 6.4%
Instruments 2,350 5.8% 2,675 3.6% 5,354 5.6% 9,863 6.7%
Transport equipment 2,839 0.7% 1,920 0.5% 6,015 1.5% 9,080 1.8%
Other manufacturing 2,825 0.4% 2,725 0.4% 9,448 1.3% 4,715 0.5%
Total manufacturing 60,638 0.5% 81,094 0.6% 156,790 1.1% 185,11 1.1%
[image:36.595.29.474.137.510.2]Source: Forfás Surveys of Research and Development 1991 to 1997 and CSO Census of Industrial Production (estimate for 1997)
1991 1993 1995 1997
£’000 Share £’000 Share £’000 Share £’000 Share
of Total of Total of Total of Total
Food, drink, tobacco 8,916 8% 12,758 7% 14,350 6% 22,242 6%
Textiles & clothing 1,570 1% 5,317 3% 6,558 3% 2,336 1%
Wood and wood products 1 0% 7 0% 1,034 0% 1,438 0%
Paper, printing
and publishing 414 0% 541 0% 500 0% 605 0%
Chemicals
(less pharmaceutical) 7,310 6% 8,365 5% 10,282 4% 18,074 5%
Pharmaceuticals 19,450 17% 45,497 25% 50,676 20% 73,812 22%
Rubber and plastic products 494 0% 1,195 1% 3,032 1% 3,722 1%
Non-metallic mineral products 618 1% 1,109 1% 2,077 1% 859 0%
Basic and fabricated metals 880 1% 793 0% 1,834 1% 775 0%
Machinery and equipment 1,863 2% 3,053 2% 5,397 2% 9,343 3%
Electrical and
electronic equipment 55,692 49% 84,887 46% 121,670 48% 157,933 46%
Instruments 4,439 4% 12,939 7% 19,451 8% 24,659 7%
Transport equipment 4,710 4% 2,504 1% 2,075 1% 6,760 2%
Other manufacturing 564 0% 841 0% 2,649 1% 702 0%
Total manufacturing 106,955 93% 179,841 97% 241,584 96% 323,261 94%
Software 7,445 7% 5,500 3% 5,334 2% 17,041 5%
Other services 1 0% 250 0% 4,697 2% 2,533 1%
Total business sector 114,400 100% 185,591 100% 251,616 100% 342,835 100%
[image:37.595.31.466.137.540.2]Source: Forfás Surveys of Research and Development 1991 to 1997
1991 1993 1995 1997
€’000 Share €’000 Share €’000 Share €’000 Share
of Total of Total of Total of Total
Food, drink, tobacco 11,321 8% 16,199 7% 18,221 6% 28,242 6%
Textiles & clothing 1,993 1% 6,751 3% 8,327 3% 2,966 1%
Wood and wood products 1 0% 9 0% 1,313 0% 1,826 0%
Paper, printing
and publishing 526 0% 687 0% 635 0% 768 0%
Chemicals
(less pharmaceutical) 9,282 6% 10,621 5% 13,055 4% 22,949 5%
Pharmaceuticals 24,696 17% 57,769 25% 64,345 20% 93,722 22%
Rubber and plastic products 627 0% 1,517 1% 3,850 1% 4,726 1%
Non-metallic mineral products 785 1% 1,408 1% 2,637 1% 1,091 0%
Basic and fabricated metals 1,117 1% 1,007 0% 2,329 1% 984 0%
Machinery and equipment 2,366 2% 3,877 2% 6,853 2% 11,863 3%
Electrical and
electronic equipment 70,714 49% 107,784 46% 154,489 48% 200,534 46%
Instruments 5,636 4% 16,429 7% 24,698 8% 31,323 7%
Transport equipment 5,980 4% 3,179 1% 2,635 1% 8,583 2%
Other manufacturing 716 0% 1,068 0% 3,364 1% 819 0%
Total manufacturing 135,805 93% 228,351 97% 306,748 96% 410,457 94%
Software 9,453 7% 6,984 3% 6,773 2% 21,638 5%
Other services 1 0% 317 0% 5,964 2% 3,216 1%
Total business sector 145,258 100% 235,652 100% 319,486 100% 435,311 100%
[image:38.595.31.466.137.540.2]Source: Forfás Surveys of Research and Development 1991 to 1997
1991 1993 1995 1997
£’000 % of £’000 % of £’000 % of £’000 % of
output output output output
Food, drink, tobacco 8,916 0.4% 12,758 0.4% 14,350 0.4% 22,242 0.5%
Textiles & clothing 1,570 0.4% 5,317 1.3% 6,558 1.5% 2,336 0.5%
Wood and wood products 1 0.0% 7 0.0% 1,034 1.1% 1,438 1.4%
Paper, printing
and publishing 414 0.0% 541 0.0% 500 0.0% 605 0.0%
Chemicals
(less pharmaceutical) 7,310 0.4% 8,365 0.3% 10,282 0.3% 18,074 0.4%
Pharmaceuticals 19,450 5.0% 45,497 7.6% 50,676 4.1% 73,812 5.1%
Rubber and
plastic products 494 0.2% 1,195 0.4% 3,032 0.7% 3,722 0.8%
Non-metallic
mineral products 618 0.5% 1,109 1.1% 2,077 1.8% 859 0.7%
Basic and
fabricated metals 880 0.2% 793 0.2% 1,834 0.5% 775 0.2%
Machinery and equipment 1,863 0.4% 3,053 0.6% 5,397 0.8% 9,343 1.2%
Electrical and
electronic equipment 55,692 1.9% 84,887 2.0% 121,670 1.6% 157,933 1.7%
Instruments 4,439 0.7% 12,939 1.7% 19,451 2.1% 24,659 2.0%
Transport equipment 4,710 5.1% 2,504 1.8% 2,075 1.0% 6,760 2.8%
Other manufacturing 564 0.2% 841 0.3% 2,649 0.8% 702 0.2%
Total manufacturing 106,955 1.0% 179,841 1.2% 241,584 1.1% 323,261 1.2%
[image:39.595.30.474.137.519.2]Source: Forfás Surveys of Research and Development 1991 to 1997 and CSO Census of Industrial Production (estimate for 1997)
1991 1993 1995 1997
€’000 % of €’000 % of €’000 % of €’000 % of
output output output output
Food, drink, tobacco 11,321 0.4% 16,199 0.4% 18,221 0.4% 28,242 0.5%
Textiles & clothing 1,993 0.4% 6,751 1.3% 8,327 1.5% 2,966 0.5%
Wood and wood products 1 0.0% 9 0.0% 1,313 1.1% 1,826 1.4%
Paper, printing
and publishing 526 0.0% 687 0.0% 635 0.0% 768 0.0%
Chemicals
(less pharmaceutical) 9,282 0.4% 10,621 0.3% 13,055 0.3% 22,949 0.4%
Pharmaceuticals 24,696 5.0% 57,769 7.6% 64,345 4.1% 93,722 5.1%
Rubber and plastic products 627 0.2% 1,517 0.4% 3,850 0.7% 4,726 0.8%
Non-metallic
mineral products 785 0.5% 1,408 1.1% 2,637 1.8% 1,091 0.7%
Basic and fabricated metals 1,117 0.2% 1,007 0.2% 2,329 0.5% 984 0.2%
Machinery and equipment 2,366 0.4% 3,877 0.6% 6,853 0.8% 11,863 1.2%
Electrical and
electronic equipment 70,714 1.9% 107,784 2.0% 154,489 1.6% 200,534 1.7%
Instruments 5,636 0.7% 16,429 1.7% 24,698 2.1% 31,323 2.0%
Transport equipment 5,980 5.1% 3,179 1.8% 2,635 1.0% 8,583 2.8%
Other manufacturing 716 0.2% 1,068 0.3% 3,364 0.8% 819 0.2%
Total manufacturing 135,805 1.0% 228,351 1.2% 306,748 1.1% 410,457 1.2%
[image:40.595.29.473.138.496.2]Source: Forfás Surveys of Research and Development 1991 to 1997 and CSO Census of Industrial Production (estimate for 1997)
1991 1993 1995 1996
Value Rank Value Rank Value Rank Value Rank
No. of countries 28 28 28 28
Australia 4.5 3 4.6 4 4.8 3 4.6 5
Austria 2.7 11 2.8 11 2.2 14 2.3 13
Belgium 0.7 22 1.0 21 0.8 20 0.9 18
Canada 0.8 21 1.3 18 0.8 19 0.9 19
Czech Republic 2.1 15 0.9 22 0.6 23 0.6 22
Denmark 2.1 16 2.3 13 2.4 12 2.5 12
Finland 4.3 4 4.3 7 4.1 8 4.3 6
France 2.2 12 2.2 15 2.2 15 2.2 14
Germany 4.1 5 4.3 6 4.7 4 5.2 3
Greece 0.4 25 0.4 25 0.4 25 0.4 25
Hungary 1.5 17 1.1 20 1.1 18 0.8 20
Iceland 1.3 19 1.3 17 0.7 21 0.6 23
Ireland 2.2 13 2.2 14 2.4 13 2.2 15
Italy 1.4 18 1.4 16 1.4 17 1.2 17
Japan 27.1 1 26.6 1 26.6 1 26.9 1
Korea 3.7 7 4.9 2 13.1 2 15.0 2
Mexico 0.1 27 0.1 27 0.0 27 0.0 28
Netherlands 1.1 20 1.2 19 1.4 16 1.6 16
New Zealand 2.9 10 3.6 9 3.6 9 3.6 9
Norway 2.2 14 2.3 12 2.5 11 3.0 11
Poland 0.7 23 0.7 23 0.7 22 0.6 21
Portugal 0.1 26 0.1 26 0.1 26 0.1 26
Spain 0.6 24 0.6 24 0.5 24 0.6 24
Sweden 3.7 6 4.4 5 4.5 6 4.7 4
Switzerland 4.5 2 4.7 3 4.4 7 3.8 8
Turkey 0.0 28 0.0 28 0.0 28 0.1 27
UK 3.3 9 3.2 10 3.2 10 3.1 10
US 3.5 8 3.9 8 4.7 5 4.0 7
Total OECD 5.5 5.6 5.8 5.8
EU 2.2 2.4 2.3 2.6
Nordic countries 3.2 3.5 3.6 3.8
[image:41.595.28.473.136.717.2]Source: OECD – Main Science and Technology Indicators (Nearest year used if data not available for a particular year)
1991 1993 1995 1997
Value Rank Value Rank Value Rank Value Rank
No. of countries 28 28 28 28
Australia 0.4 15 0.4 15 0.6 14
Austria 0.9 8 0.8 10 1.1 8
Belgium 0.5 12 0.6 12 1.0 11
Canada 0.2 17 0.3 16 0.4 17
Czech Republic 0.0 22 0.0 24 0.1 23
Denmark 0.7 9 0.9 6 1.6 5
Finland 1.0 6 1.2 4 2.2 3
France 0.9 7 0.9 8 1.0 9
Germany 1.5 2 1.4 2 1.8 4
Greece 0.0 23 0.0 23 0.0 24
Hungary 0.1 19 0.1 21 0.1 20
Iceland 0.3 16 0.2 18 0.3 19
Ireland 0.2 18 0.2 19 0.4 18
Italy 0.4 14 0.4 14 0.5 16
Japan 1.0 4 0.9 7 0.9 12
Korea 0.0 24 0.0 22 0.1 22
Mexico 0.0 27 0.0 27 0.0 27
Netherlands 1.0 5 1.0 5 1.2 6
New Zealand 0.1 20 0.2 17 0.6 15
Norway 0.5 13 0.6 13 0.8 13
Poland 0.0 26 0.0 26 0.0 26
Portugal 0.0 25 0.0 25 0.0 25
Spain 0.1 21 0.1 20 0.1 21
Sweden 1.3 3 1.3 3 2.4 2
Switzerland 2.6 1 2.4 1 2.8 1
Turkey 0.0 28 0.0 28 0.0 28
UK 0.7 11 0.7 11 1.0 10
US 0.7 10 0.8 9 1.1 7
Total OECD 0.7 0.7 0.8
EU 4.6 4.6 4.6
[image:42.595.30.469.135.721.2]Nordic countries 1.0 1.0 1.9
1991 1993 1995 1997
Value Rank Value Rank Value Rank Value Rank
No. of countries 23 23 23
Australia 0.3 14 0.2 16 0.3 16
Austria 0.5 11 0.4 11 0.4 11
Belgium 0.4 13 0.4 13 0.4 12
Canada 0.7 6 0.7 6 0.7 6
Czech Republic
Denmark 0.4 12 0.4 12 0.4 13
Finland 0.7 8 0.6 7 0.7 7
France 0.5 9 0.5 9 0.5 9
Germany 1.0 4 0.8 4 0.8 5
Greece
Hungary 0.1 20 0.1 20 0.0 20
Iceland
Ireland 0.2 17 0.1 18 0.1 18
Italy 0.2 16 0.2 15 0.2 17
Japan 1.7 3 1.8 2 1.7 2
Korea 0.1 19 0.2 17 0.3 15
Mexico 0.0 22 0.0 22 0.0 22
Netherlands 0.7 7 0.5 8 0.5 8
New Zealand 0.1 18 0.1 19 0.1 19
Norway 0.3 15 0.3 14 0.3 14
Poland 0.0 23 0.0 23 0.0 23
Portugal
Spain 0.0 21 0.0 21 0.0 21
Sweden 0.8 5 0.7 5 0.9 4
Switzerland 2.0 2 1.6 3 1.5 3
Turkey
UK 0.5 10 0.4 10 0.4 10
US 2.0 1 2.1 1 2.1 1
Total OECD
EU 4.6 4.6 4.6
Nordic countries 0.6 0.5 0.6
[image:43.595.29.474.137.721.2]Source: Second European Report on S&T Indicators, 1997