APPLICATION OF ELECTRO PROCESS FOR WATER AND
WASTEWATER QUALITY IMPROVEMENT
Fadil Othman1, Moh Faiqun Niam2, Nur Shaylinda Mohd Zin3
1Associate Professor, Faculty of Civil Engineering, Universiti Teknologi Malaysia, Skudai, Johor 2
Post Graduate Student, Faculty of Civil Engineering, Universiti Teknologi Malaysia, Skudai, Johor
3
Lecturer, Fac. of Civil & Environmental Eng., Universiti Tun Hussein Onn Malaysia, Parit Raja, Johor
Abstract
Electro process is applied for water and wastewater quality improvement usually based on electrocoagulation. It is a simple and effective method for water and wastewater treatment. It is an intention of this paper to present on a report of a study using electro process to improve wastewater quality, based on removals of colour, COD and suspended solids. A reactor made of a beaker, consists of iron plates as electrodes, a liter of solution sample, applied current density of between 35 A/m2 and 200 A/m2, with duration of between 5 minutes and 40 minutes. From the study it was shown that the reactor can remove colour, COD and SS by more than 80%, 80% and 30% respectively, with optimum duration of between 15 minutes and 30 minutes. The study also has shown that current density and duration were the most influent factors besides concentration of the solution sample.
Keywords :
Electro process, Iron electrode, Decolourization, COD removal, Suspended solids.
1. Introduction
Treatment that used electro process has been tested successfully to treat others wastewater such as restaurant wastewater and urban wastewater. Basically when electricity was used in the treatment, electrolysis process occurred. It is based on applying an electric current through the wastewater to be treated by using electrodes. Anode is a sacrificial metal (usually iron) electrode that withdraws electron from the electrode material, which result in release of Fe(II)-ions into the bulk solution. Iron upon oxidation produced iron hydroxides that remains in aqueous stream as a gelatinous suspensions removed the pollutant by complexation or electrostatic attraction (Daneshvar et al., 2004). Then cathode produces H2 gas from water and cause the floc form to be floated at the surface (Zee, 2002). Organic compound from dyes react through a combination of electrochemical reduction, electrocoagulation and electrofloatation reactions (Ching et al., 2005).
Electro process has been tested successfully for treating varian of wastewater samples such as restaurant wastewater, urban wastewater, defluoridation of water, separation of aqueous, suspension of ultrafine particle, and removal of nitrate from water (Alinsafi et al., 2004). According to Abraham and Freeman (1996), this process able to removed BOD, COD, total organic carbon, total dissolved solid, total suspended solids, and heavy metal such as chromium, copper, molybdenum and zinc. However, the performances of this approach in treating textile wastewater are not well defined.
This process is based on principles involving responses of water contaminants to strong electric fields. Basically it is the combination of electrolysis and coagulation method. Compare to conventional coagulation this process has advantages in removing small colloidal particles, have lager probability of being coagulated because of electric field that set them in motion and produce low sludge. Generally, treatment of coloured wastewater is highly in cost. However, this process offers low cost for operating and maintenance (Ching et al., 2005). Furthermore, the equipment is simple and easy to be operated (Alinsafi et al., 2004).
Electro process involved the formation of flocs of metal hydroxides within the effluent to be cleaned by electro-dissolution of soluble anodes. This process will be destabilizing and aggregating fine particles (Chen et al., 2000). In the mean time, tiny hydrogen bubble produced at the cathode induce the floatation of most flocs, and helping successfully separate particle from wastewater (Alinsafi et al., 2004). Three main processes occur during the process, electrolytic reactions at the surface of electrodes, formation of coagulant in aqueous phase, adsorption of soluble or colloidal pollutants on coagulants, and removal by sedimentation or floatation (Alinsafi et al., 2004).
Floc size and density significantly influence the performance of liquid/solid separation processes. Large and dense flocs may be preferable since they have high sedimentation velocities and are more easily dewatered. Chemical dosing with metal ions (iron or aluminum) is often used in primary treatments to remove colloids from wastewater, but new technologies as electrocoagulation are suspectible to produce flocs of higher size and density (Larue and Vorobiev, 2003).
In order to optimise the treatment process several parameter such as size, shape, and distance between electrode, current density, pH, reaction time should be properly selected (Alinsafi et al., 2004). It is important to select properly the condition of parameter to ensure the cost for treatment and removal efficiency according to the needs.
There were many type of electrode in term of material, size, shape and arrangement. Each different type of electrode affecting the process differently. Study done by Daneshvar (2004), showed that electrocoagulation with several electrodes was more effective compare to simple cell. The shape of electrode such as plate and rod gave different affect to the process. Plate electrode has more surface area compare to rod electrode. Distance between electrodes is important. The distance of electrode used by Ching et.al (2005) was 1 mm distance, while Alinsafi et al. (2004) used 2 mm and Chen et al. (2000) used 3mm. Basically the most suitable condition of parameter for the process are depending on the wastewater property that required to be treated.
textile wastewaters using iron and aluminum electrode materials. The results show that iron is superior to aluminum as sacrificial electrode material, from COD removal efficiency and energy consumption points.
2. Materials and Methods
This study to investigate the effect of electro process. The objective of the present study is to examine the feasibility of electro process in improving water/wastewater quality, and to determine the optimal operational conditions. This research was mainly focused on the capability of electro process to increase removal efficiencies of absorbance, colour, COD, and suspended solids.
2.1. Wastewater Characteristics
a. Colour Removal
In this experiment, the artificial wastewater was prepared by mixing Azo acid orange 7 dye. The dye was mix with discharged water. The discharged water was prepared by using deionization (UHQ-Elgastat 120). NaCl with 10 g/L doses were added for each sample. The sample were prepared by using different concentration, which was 25 mg/L, 50 mg/L, 100 mg/L, 150 mg/L, and 200mg/L.
b. COD and SS Removal
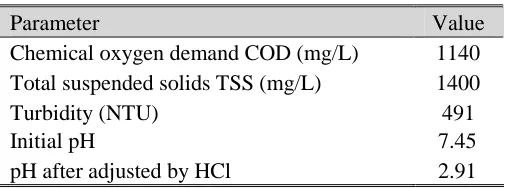
[image:3.612.99.352.452.547.2]The synthetic wastewater sample made from milk powder and treated by using HCl 1 M as pH adjusment and electrolyte. Concentration of HCl in this fluid is 5 mL/L (0.5 %). The current density was adjusted to a desired value and the coagulation was started. The composition of artificial wastewater is shown in Table A.
Table A. Characteristics of wastewater
Parameter Value
Chemical oxygen demand COD (mg/L) 1140 Total suspended solids TSS (mg/L) 1400 Turbidity (NTU) 491
Initial pH 7.45
pH after adjusted by HCl 2.91
2.2. Experimental Procedures
Preliminary test was done to obtain the range of current density, duration and concentration that will be used in the MINITAB™ analysis. At the same time, the behaviour of decolourisation, removal of absorbance, COD and suspended solids were also investigated.
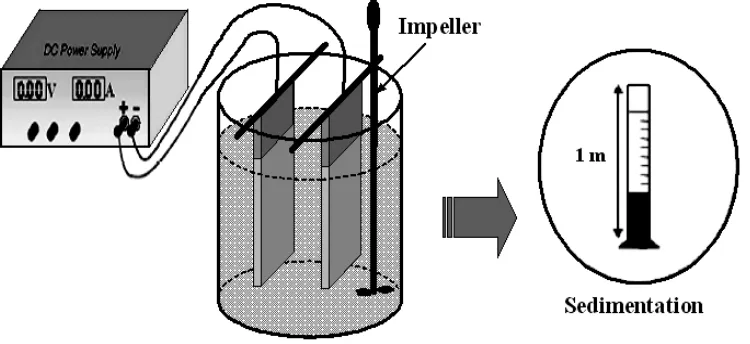
The monopolar iron (Fe) and steel plate electrodes were used in this work (Table B). The total effective electrode area was 142.40 cm2 and the net spacing between the iron electrodes (d) was varied from 14 to 50 mm. Electrodes were placed in two litres of fluid wastewater and applied current density of between 35 A/m2 and 200 A/m2. The electrodes were connected to terminals of a DC Power Supply (LODESTAR 8107 ; 30V / 10A) with potensiostatic or galvanostatic operational options. Before each run, electrodes were washed with acetone solution to remove surface grease. At the end of run, the electrodes were washed thoroughly with water to remove any solid residues on the surfaces, and dried.
Table B. Material of electrodes
Electrodes Decolourization COD & SS removal Anode Iron (Fe) Iron (Fe) Cathode Steel Iron (Fe)
For settling test, each after electro process, the treated wastewater were degassed under low stirring speed with an impeller velocity 30 rpm. Afterwards, the treated wastewater were placed in graduated sedimentation columns of 5 cm internal diameter and 1 m height (Figure 2).
Figure 2. Static system setup of electro process
2.3. Analysis
All the analysis was focusing on the performance of the electric energy that was connected to iron and steel electrode under the influence of duration, current density and concentration. The performance of the process was assessed based on the percentage of decolourisation, absorbance, COD and suspended solids removal.
wavelength to make quantitative analysis. While the colour removal was determined at 480 nm wavelength using DR/4000 (Hach) spectrophotometer.
COD was determined according to the Standard Methods for Examination of Water and Wastewater (APHA, 2002) and analysed using UV-Vis HACH DR/4000 spectrophotometer (HACH Method 8000).
To determine SS, the wastewater samples were filtered through a standard GF/F glass fibre filter. The residual retained on the filter was then oven dried at 1050C to a constant weight (APHA Method 2540 D).
The percentage of removal after electro processes were assessed using the following formula:
100 (%)
0 0
x C
C C
CR (1)
Where C0 and C are concentrations of wastewater before and after electro process in ADMI or mg/L, respectively.
Whereas the percentage of absorbance removal represent to Lambert’s Law, was determined by using formula below:
100 (%)
0 0
x A
A A
AR (2)
Where A0and A are initial and final absorbance, respectively.
Hence, the loss of particles due to coagulation after treatment process, as follows:
) (
0
kt e b a C
C
(3)
Where k is kinetic constant ; a and b are constant values.
3. Results and Discussion
3.1. Absorbance Removal and Decolourization
According to Figure 3, the tests were used to obtain the amount of current density, concentration and duration that able to give 80% of decolourisation and absorbance removal. Based on the test, value of fix concentration was determined. This test ensured the arrangement of the system that were used able to serve its function. The first test was decolourisation under the influence of current density. The percentage of decolourisation was higher than the percentage of absorbance removal. Based on result of the test (Fig. 3), the increase in current density also increases the percentage of decolourisation and percentage of absorbance removal. As shown in Figure 3 an increase of current density from 40 A/m2 to 80 A/m2 yields an increased of colour removal from 34% to 78% and absorbance removal from 17% to 74%. When current density increase, the efficiency of ion produced in anode and cathode increases. Therefore, there is an increase in floc production in the solution hence an improvement in efficiency of colour removal. Based on the graph the amount of current density that gave decolourisation and absorbance more then 80% removal was 160 A/m2.
0 10 20 30 40 50 60 70 80 90 100
0 20 40 60 80 100 120 140 160 180
Current Density (A/m2)
R e m o v al P er ce n ta g e (% ) Decolourization Absorbance removal
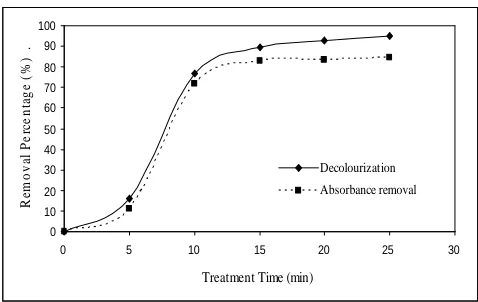
[image:6.612.193.431.218.367.2]neutralize the particle charges and thereby initiate coagulation. Colour removal efficiency depends directly on the concentrations of ions produced by the electrodes. When the treatment time increases, an increase occur in ions concentration. Accordingly as shown in Figure 4, an increase of treatment time from 5 to 10 minutes yields an increase of colour removal efficiency from 16% to 77% and absorbance removal from 11% to 72%. Based on the result, when the treatment time was 15 minutes the amount of decolourisation was 89%, which was near 90%. While, the percentage of absorbance removal was 82%. From Figure 4, to reach 90% decolourisation the amount of time required was about 18 minutes. From this we can conclude that 18 minutes was amount of the treatment time was used for the next test.
Figure 3. Percentage change of decolourization & removal of absorbance to current density (t= 10 min, c= 50 mg/L, d electrode= 30 mm)
Figure 4. Percentage change of decolourization & removal of absorbance to treatment time (current density= 80 A/m2, c= 50 mg/L, d electrode= 30 mm)
Based on previous test 100 mg/1 had been chosen as a fixed concentration for further test. Further test was required, in order to ensure the value of current density and duration obtained previously able to give more then 90% decolourisation and absorbance removal. The range of current density used for this test was from 120 A/m2to 240 A/m2. Results of the test are shown in Table C. From the result, the percentage of absorbance removal and decolourisation was more then 90% for each range of current density, this proved that the range of current density used was suitable. When the concentration was
0 10 20 30 40 50 60 70 80 90 100
0 5 10 15 20 25 30
Treatment Time (min)
[image:6.612.190.429.413.564.2]less then 100 mg/1 the percentage of absorbance removal increased because the amount of dye was less.
Table C. Result of experiment with 18 minutes duration.
Current Initial Final Percentage of Initial Final Percentage Density Colour Colour decolourisation absorption absorption of removal
(A/m2) (ADMI) (ADMI) % % 120 10920 540 95.05 3.291 0.362 89.00 160 10920 350 96.79 3.291 0.317 90.37 200 10920 250 97.71 3.291 0.279 91.52 240 10920 230 97.89 3.291 0.258 92.16
3.2. COD Removal
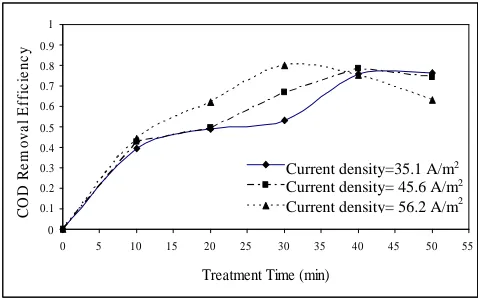
The effect of treatment time was studied at current density between 35.1 – 56.2 A/m2. Figure 5 illustrate the removal percentage of COD as a function of treatment time. It is clearly seen from this figure, the treatment time has a significant effect on the pollutant removal. When the treatment time changed from 10 to 50 minute, the removal of COD from 691 to 226 mg/L was obtained.
As seen from Fig. 5, the optimal COD removal at current density of 35.1 A/m2and 45.6 A/m2 (> 75%) is reached after 40 min of wastewater processing. Whereas for the current density of 56.2 A/m2, the optimal COD removal (80%) is reached at 30 min of electro process. And above of 30 min treatment time, COD removal percentage decreased. This change probably occurs because the Fe3+effects.
Figure 5. Effect of treatment time on the removal percentage of COD (d = 14 mm)
In this process, electrocoagulation involves two stages which are destabilization and aggregation. The first stage is usually short, whereas the second stage is relatively long. From Figure 5 explainable that metal ions as destabilization agent are produced at the anode through electrochemical reactions.
The effluent appeared greenish first and then turned yellow and turbid. This green and yellow colour must have resulted from Fe2+ and Fe3+ ions generated during the EC process. Fe2+is the common ion generated in situ of electrolysis of iron electrode. It has
0 0.1 0.2 0.3 0.4 0.5 0.6 0.7 0.8 0.9 1
0 5 10 15 20 25 30 35 40 45 50 55
Treatment Time (min)
C
O
D
R
e
m
o
v
a
l
E
ff
ic
ie
n
c
y
.
DC Current = 0.5A DC Current = 0.65A DC Current = 0.8A
Current density=35.1 A/m2
Current density= 45.6 A/m2
[image:7.612.190.429.416.565.2]relatively high solubility at acidic or neutral conditions and can be oxidised easily into Fe3+by dissolved oxygen in water.
[image:8.612.191.434.179.329.2]On the other hand, interelectrode distance (d) have a significant effect on the efficiency of COD and turbidity removal. The effects of interelectrode distance depicted in the curves of relationship between treatment time and COD removal in Figure 6. In this figure, the optimum of COD removal efficiency for the distance of 14 mm and 50 mm (80% and 77%) is reached at 30 min and 50 min of treatment time, respectively.
Figure 6. Effect of treatment time on the removal percentage of COD (Current density = 56.2 A/m2)
[image:8.612.190.430.433.581.2]To determine the influence of current density on the removal of COD, experiments were conducted with treatment time at 10 – 30 minutes. The current density was varied from 0.5A to 1.0A, corresponding to current densities in the range 35.1 – 70.2 A/m2.
Figure 7. Influence of the current density on the removal of COD efficiency (d= 14 mm)
Figure 7 illustrates the removal of COD as a function of cell current. It is clearly seen from this Figure, the current has a significant effect on the COD removal. When the current density changed from 35.1 A/m2 to 70.2 A/m2, the optimum of COD removal percentage is reached till 76% (t=10 min) and more than 80% (t= 20 and 30 min). For the treatment time of 10 and 20 min, the optimum values are reached at 70.2 A/m2. While for the treatment time of 30 min, the optimum values is reached at 56.2 A/m2.
0.44 0.62 0.80 0.75 0.63 0.15 0.26 0.71 0.74 0.77 0 0.1 0.2 0.3 0.4 0.5 0.6 0.7 0.8 0.9 1
10 20 30 40 50
Treatment Time (min)
C O D R e m o v a l E ff ic ie n cy .
distance = 14 mm distance = 50 mm
0 0.1 0.2 0.3 0.4 0.5 0.6 0.7 0.8 0.9 1
0 0.2 0.4 0.6 0.8 1 1.2
DC Current (A)
C O D R e m o v a l E ff ic ie n cy .
T reat ment T ime = 10 min
T reat ment T ime = 20 min
T reat ment T ime = 30 min
14 28 42 56 70 84
3.3. SS Removal
From the batch studies involving various settling time presented for Total Suspended Solid (TSS) removal experiment (Figure 8), the best efficiency started after 120 minutes of sedimentation. As seen in Figure 8, Suspended particles removal are increases as the settling time is increased. With an addition of treatment time from 30 becomes 50 minutes, TSS removal is increased from 17.86% to 31.86% on 1440 minutes (24 hours) of settling time. Whereas on 720 minutes (12 hrs) of settling time, TSS removal is increased of between 15.71% – 31.29%.
[image:9.612.190.434.299.454.2] [image:9.612.188.436.506.642.2]Figure 9 shows the reduction of COD in kinetics equation. The exponential curve of Fig. 9 is characteristic of a differential equation such as Eq. (3). The equation explain that the fraction of particles neutralized (b – e-kt) is increasing with time, while the overall concentration, C, is decreasing. Initially, none of the particles are neutralized, and they must migrate toward the anode. After a certain time, a rather sharp drop in concentration occurs because coagulation has begun, and finally the rate begins to slow as most of the particles have become neutralized.
Figure 8. TSS removal efficiencies as a function of settling time (current density = 56.2 A/m2; d = 50 mm; t = 30 – 50 min)
Figure 9. Effect of settling time on rate of change of COD by Electro process (t = 40 min).
0 5 10 15 20 25 30 35
0 200 400 600 800 1000 1200 1400 1600
Settling Time (min)
S
S
re
m
o
v
al
(%
)
Treatment Time : 30'
Treatment Time : 40' Treatment Time : 50'
0 0.1 0.2 0.3 0.4 0.5 0.6 0.7 0.8 0.9 1
0 60 120 180 240 300 360 420 480
Settling time (min)
C
/C
o DC Current : 0.5A
DC Current : 1.0A
C/Co = -0.7138(-0.4006-exp(-0.0719t)) C/Co = -0.3336(-1.9975-exp(-0.0154t))
Current dens: 35.1 A/m2
4. Conclusion
The current density was increasing the amount of absorbance removal and colour removal was increasing. 160 A/m2 of current density was the most suitable value to achieve 80% of absorbance removal and colour removal. The efficiency of decolourisation for 100 mg/1 to 200 mg/1 concentration was able to increase up to more than 95% of colour removal and more than 88% of absorbance removal when duration was 18 minutes and current density was 120 A/m2.
The removal efficiencies of COD and SS were high, more than 80% and 30%, respectively. The optimal COD removal (> 75%) at current density of 56.1 A/m2 and 70.2 A/m2 is reached at 30 min of electro process. The suspended particles removal efficiency is as high as 31.86% on 24 hours of settling time. The kinetics of the COD and turbidity removal were described by the empirical formulation and fit to data.
In general, the results was obtained from the curves of treatment time and settling time, explain that the electro process can enhances the settling velocity of suspended solids and removal of colour and COD. It mean that the electro process can remove the suspended solids, colour and COD from water and wastewater to improve its quality.
Acknowledgements
The authors are grateful for the financial support IRPA Grant : VOT 74146, by the Ministry of Science, Technology and Innovation (MOSTI) . We also wish to thank the Department of Environmental Engineering, Faculty of Civil Engineering, Universiti Teknologi Malaysia.
REFERENCES
Abraham, R., and Freeman, H. S. (1996).Environmental chemistry of dyes and pigments. Canada: John Wiley & Sons. Inc.
Alinsafi, A., Khemis, M., Pons, M. N., Leclerc, J. P., Yaacoubi, A., Benhammou, A., and Nejmeddine, A. (2004). Electrocoagulation of reactive textile dyes and textile wastewater.Journal of Chemical Engineering,44, 461 – 470.
Carmona M., Khemis M., Leclerc J. P., and Lapicque F. (2006). A simple model to predict the removal of oil suspensions from water using the electrocoagulation technique.
Chemical Engineering Science,61, 1237 – 1246.
Chen X., Chen G., and Yue P.L. (2000). Separation of pollutants from restaurant wastewater by electrocoagulation.Separation and Purification Techology,19, 65 – 76.
Daneshvar N., Sorkhabi H. A., and Kasiri M. B. (2004). Decolorization of dye solution containing acid red 14 by electrocoagulation with a comparative investigation of different electrode connections.Journal of Hazardous Materials,B112, 55 – 62.
Kobya M., Can O. T., and Bayramoglu M. (2003). Treatment of textile wastewaters by electrocoagulation using iron and aluminum electrodes.Journal of Hazardous Materials,
B100, 163 – 178.
Larue O., and Vorobiev E. (2003). Floc size estimation in iron induced electrocoagulation and coagulation using sedimentation data. International Journal of Mineral Processing,
71, 1 – 15.