2018 International Conference on Applied Mechanics, Mathematics, Modeling and Simulation (AMMMS 2018) ISBN: 978-1-60595-589-6
Identification of Power Quality Transient Disturbance
Based on S Transform and Wavelet Transform
Zong-bao ZHANG
1,*, Ying-qi HUANG
1, Lei LI
2, Yong-han DING
2,
Liang-liang GE
2and Yao-zhong BI
21Department of System, Operation Shenzhen Power Supply Bureau Co., Ltd, Guangdong, China
2Nari Technology Development Limited Company, Jiangsu, China
*Corresponding author
Keywords: Signal de-noising, S transform, Wavelet transform, Relieff algorithm, Support vector machine.
Abstract With the rapid advancement of the country's industrialization, intelligence, and infor- mation technology, the nonlinearity, asymmetry, and impact of power system load are becoming increasingly prominent. On the other hand, users' demands for power quality are increasing. The national grid inevitably faces severe challenges. The power quality problem in circuit systems is particularly important. The type identification of power quality transient disturbances is of great significance for analyzing power quality problems and solving power quality problems. In this paper, a method based on S transform and wavelet transform for transient power quality disturbance identification is proposed. Firstly, the wavelet signal is used to denoise the power signal. Then, after obtaining the feature vector of the power signal by the S transform and the wavelet transform, The Relieff algorithm is used to obtain the feature weights of the feature vectors generated by S transform and wavelet transform and to select features. Finally, training and classification are performed using the Support Vector Machine (SVM) classifier. The experimental results show that the power quality transient disturbance classification method proposed in this paper can accurately identify the type of disturbance and have strong robustness, and fully meet the requirements of the relevant industry for the accuracy of power quality transient disturbance recognition.
Introduction
Electric energy is a clean and practical energy category that the country has vigorously developed and promoted. It is a special kind of commodity provided by the power sector to power users. With the advancement of science and technology and the overall improvement of automation level, non-linear load power in electronic equipment such as semiconductor device rectification, variable frequency speed control devices and inverter devices are widely used in power electronic equipment, and the precision of these devices Sex, nonlinear, harmonic richness, imbalance, impact and other characteristics make users put forward higher requirements for power quality. If the power quality is unqualified, it will affect the production efficiency, cause equipment malfunction, and damage the power equipment, and even threaten the safety of the power grid. Effective power quality monitoring can quickly and accurately analyze the characteristics of power quality transient disturbances, identify the types of power quality disturbances, and provide a strong support basis for solving power quality problems. This is an indispensable part of the grid layout.
experts and scholars improve wavelet transform and S transform [8-9];In [9], an improved discrete S transform is proposed for detecting power quality disturbances. Of course, there are also many new algorithms and theories for power quality detection [10-21].The author [10] proposed a new method for power quality disturbance detection and classification, Singular spectrum analysis and Curvelet are used for signal decomposition and extraction features, and are classified by deep learning and multi-class SVM, which can be applied to many types of Power quality disturbance signal;An adaptive process noise covariance Kalman filter [11] is used to detect power quality disturbances present in a distorted power signal; The author [12] proposed a method based on Histogram of Oriented Gradients and support vector machine to check power quality events. In [16], the authors propose a method for detecting and classifying power quality interference by a method of initializing Stockwell transform and Fuzzy C-means clustering by decision tree.
Aiming at the problem of power quality transient disturbance identification, this paper proposes a method based on S transform and wavelet transform for transient power quality disturbance recognition. The wavelet transform is used to denoise the electric power. Then, after extracting the feature vector of the power signal by using the small transform and the wavelet transform, The Relieff algorithm is used to calculate the feature weights of the feature vectors generated by S transform and wavelet transform and feature selection. Finally, the extracted feature vectors are trained and classified using SVM.
Signal De-noising
The power signal is a one-dimensional signal. In actual production and life, the power signal is affected by sampling error, external noise interference and the noise of the system itself, so that the sampled power signal has various noise effects. The existence of noise will affect the extraction of subsequent power signal features, causing interference or even misidentification of power signal transient disturbance identification. Therefore, the denoising process of power signal has important significance. Add 40db Gaussian white noise, which is a high-frequency signal. We can use multi-layer wavelet decomposition to perform threshold processing on the decomposed wavelet coefficients, and then perform power signal wavelet reconstruction to achieve signal de-noising. The one-dimensional power signal is expressed as
1 , 2 , 1 , 0 ), ( ) ( ) (
s t f t e t k n (1) Where s(t) is a collected power signal, f(t) is an ideal power signal,e(t) a noise signal,In this paper we default to noise is Gaussian white noise, a high frequency signal.
The choice of wavelet basis function affects the denoising effect of power signals. Different wavelet basis functions show different characteristics in orthogonality, biorthogonality, tight support, symmetry and vanishing moment. The db wavelet has good locality in both time and frequency domain, and also has bi-orthogonality and tight support. It is commonly used in power systems. This paper chooses db4 wavelet basis function, The 5-layer wavelet decomposition, db4 has a support length of 7, a filter length of 8, and a base disappearance moment of 4 steps.
In this paper, the maximum and minimum value criterion threshold method is used, which is also a kind of fixed threshold method. This minimizes the maximization of the root mean square error within a certain set of functions. The selected threshold function is a soft threshold function, and the expressions are as
32 N 0 32 N log 1829 . 0 3936 . 0 2 N
T ( )
Where N is the length of the signal, is the noise variance in the signal, is the threshold, and
k j
d , is the wavelet coefficient after dˆ is the threshold processing. j,k
Methodology for Feature Extraction
The effect of feature extraction directly affects the accuracy of power quality transient disturbance recognition. In this paper, we use S transform and wavelet transform to extract the features of power signals respectively. Compared with the feature of power signals extracted by single transform, the features of multiple transforms are more comprehensive. Experiments show that the features extracted by S transform and wavelet transform are used for power quality transient disturbance recognition with high accuracy.
S Transform
The S transform is a windowed Fourier transform proposed by Stock well et al. in 1996, which is the inheritance and development of short-time Fourier transform and wavelet transform. The S transform uses a variable width Gaussian window function, and the time window width is inversely proportional to the frequency, that is, the time window in the low frequency band is wider, and the time window in the high frequency band is narrower. The S-transformation can perform multi-resolution analysis on signals, and is often used in the power field for power signal processing. The S transform of the time domain continuous power signal as
d e e
f u f
t
S ,
( )| | - (t-)2f2 -i2 f
) (
(4)
Where the window function is
2 2 | | ) ,
(t f f e t f
w (5)
After the power signal is S-transformed, a complex time-frequency matrix, also called S matrix, is obtained. The modulo operation is performed on each element of the S matrix. The matrix obtained at this time is called the S-module time-frequency matrix, and the S-module time-frequency matrix row element corresponds to the distribution of the amplitude of the power signal at a certain frequency with time. The element corresponds to the distribution of the amplitude of the power signal at a certain time with the frequency transformation. Therefore, the S-transformation can intuitively represent the time-frequency characteristics of the power signal. The S-mode time-frequency matrix can be extracted: the average of the fundamental frequency amplitude, the sum of the maximum and minimum values of the maximum amplitude of the column, the total harmonic content of the minimum amplitude of each row, and the amplitude of the fundamental frequency amplitude is greater than the standard value 105%. the amplitude of the fundamental frequency is greater than the standard value of 95% of the number of sampling points, the number of peaks of the frequency envelope, the spectral standard deviation and the time-frequency envelope standard deviation, These seven features can be used as S-transform to extract feature vectors of power quality transient disturbance signals.
Wavelet Transform
signal, it is necessary to consider the characteristics of the power quality transient disturbance signal waveform, and adopt the wavelet local function with good locality in both time domain and frequency domain, and the selected wavelet basis function is more sensitive to irregular changes. Combining with the needs of practical application scenarios and the requirements of wavelet basis function, some wavelet functions satisfying the condition are simulated and calculated. Considering the effect, it is found that db6 wavelet has the best performance. The wavelet has a moment order of 6, and the order is moderate. The support interval is 11, and the wavelet transform is extracted to effectively identify the power quality transient signal category.
Band division follows a principle: As far as possible, the fundamental frequency of the signal is located at the center of the lowest sub-band, which can well limit the influence of the fundamental
component on other sub-bands. The number of wavelet decomposition layers can be determined by the following formula
5 . 0 ) 8 1 ( log
0
2
f f
p x
(6) Where, fx the sampling frequency, f0 is the fundamental frequency and pis the number of bands.In this paper, the sampling frequency of the power quality transient disturbance signal is 6.4KHz, and the number of bands available from the above formula is 6, so the db6 wavelet 5 layer is decomposed.
The 5 layers db6 wavelet decomposition is performed on the power quality transient disturbance signal, and the approximate coefficient(aj) and detail coefficient (dj(n) j1,2, ,5,) of the wavelet transform are obtained, nis the number of sampling points. The energy distribution of the wavelet transform as
n
i j
j d i
Ed
1
2
)) ( (
(7)
n
i j
j a i
Ea
1
2
)) ( (
(8)
The feature quantity constitutes the energy function, which is the feature vector extracted by the db6 wavelet 5 layer power quality transient disturbance signal decomposition
] , , , ,
[Ed1 Ed2 Ed5 Eda5
E
(9)
Relieff Algorithm
The Relief algorithm is often used for feature selection methods, but the Relief algorithm is for the two-class problem. Power quality transient disturbance signals include voltage sag, voltage swell, voltage interruption, voltage pulse and transient oscillation. Therefore, this paper uses the improved Relieff algorithm to deal with the extracted two types of power quality transient disturbance features. The main idea of the Relieff algorithm is to randomly take a sample R from the training sample set, Then find the K neighbor samples of R from the same sample set of R, and then find K neighbor samples from the different sample sets of each R. Finally update the weight of each feature as
feature difference of the same classification, plus the difference of the feature of different classifications. 1 0 ) min( ) max( || | | | | ) , , ( 2 1 2 1 A A A R A R R R A diff (10)
Kj CclassR
k
j
j
j diff A R M C mk
R class p C p mk H R A diff A W A W
1 ( ) 1
) /( ] )) ( , , ( )) ( ( 1 ) ( [ ) /( ) , , ( ) ( ) ( (11) Experiment
Use MATLAB tools to simulate five types of disturbance signal waveform data such as voltage sag, voltage swell, voltage interruption, voltage pulse and transient oscillation, as shown in the following table. Simulated power quality transient disturbance waveform data, First, through the 5-layer db4 wavelet decomposition, the threshold value of the decomposed wavelet coefficients is processed. After that, the power signal wavelet reconstruction is performed to achieve signal denoising; hen, the features of the power quality transient disturbance signal are extracted by S transform and db6 wavelet transform respectively; then, the Relieff algorithm is used to perform feature weight calculation and feature selection on the extracted two types of feature vectors. Finally, the SVM classifier is used to train and classify the features extracted from the power quality transient disturbance signal samples.
(a)
(b)
(c)
IF A Is Continuous
IF A Is Discrete And R1[A]=R2[A]
(d)
[image:6.595.119.479.219.318.2]Figure 1. Experimental simulation diagram of partial power quality transient disturbance signal.
Table 1. Experimental sample data set.
Number of samples Train samples Test samples
voltage sag voltage swell voltage interruption
voltage pulse transient oscillation
1500 500
1500 500
1500 500
1500 500
1500 500
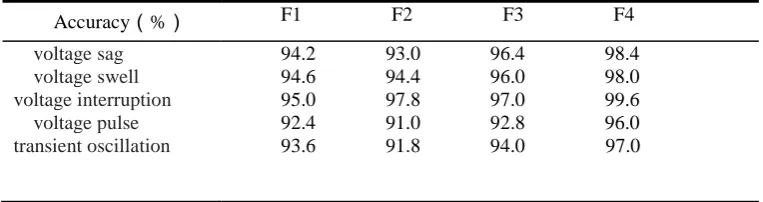
Table 2. The results of identifying the power quality transient disturbance using the SVM classifier.
Accuracy(%) F1 F2 F3 F4
voltage sag voltage swell
voltage interruption voltage pulse transient oscillation
94.2 93.0 96.4 98.4 94.6 94.4 96.0 98.0 95.0 97.8 97.0 99.6 92.4 91.0 92.8 96.0
93.6 91.8 94.0 97.0
F1 represents the feature extracted by the S transform;F2 represents the feature extracted by the wavelet transform; F3 represents the feature vector obtained after the S-transform and wavelet transform features are respectively extracted and selected by Relieff feature weights;F4 differs from F3 in that F4 is de-noised by db4 wavelet.
The Table 2 show that the recognition rate of F3 in the voltage sag is 96.4%, which is 2.2% higher than the F1 in the 94.2% of the voltage sag recognition rate;F3 increases by 0.4% in voltage pulse and transient oscillation than F1,That is, F3 has a maximum increase of 2.2% in the recognition accuracy of different transient disturbance signal categories than F2, and the minimum increase is 0.4%;F3 is 0.8% lower than F2 except for voltage interruption, and has a great improvement in other power quality transient disturbance signals, especially in voltage sag, up to 3.4%;The F4 has a higher recognition rate than the F3, and the recognition rate of the F4 is 3.2% higher than the recognition rate of the F3 on the identification voltage pulse, and the F4 is used to identify the five power quality transient disturbances, and the recognition accuracy is recognized more than 96%.
In general, the method based on wavelet transform power signal denoising proposed in this paper can effectively remove the Gaussian noise existing in the signal and improve the recognition effect of transient signals. The proposed power quality transient disturbance classification algorithm based on S transform and wavelet transform has higher recognition rate than the current single signal transform (taking S transform and wavelet transform as an example), and the recognition rate is over 96%.
Summary
[image:6.595.107.489.345.446.2]It can effectively identify the power quality transient disturbance signal. In the experiment, only five common power quality transient disturbance signals are taken as research objects. In the future, more different types of power quality transient disturbance signals will be taken as research objects. At the same time, the recognition rate of power quality transient disturbances is further improved to better serve the power industry.
References
[1] Umashankar S, Shankar V K A, Paramasivam S, et al. Survey of Power Quality Discrete Disturbances in an Educational Institution[M].Advances in Power Systems and Energy Management. Springer, Singapore, 2018: 377-391.
[2] Nashad N R, Islam M J, Alam S, et al. A simplistic mathematical approach for detection and classification of power quality events[C]. Electrical, Computer and Communication Engineering (ECCE), International Conference on. IEEE, 2017: 698-703.
[3] Sharma A K, Mahela O P, Ola S R. Detection of Power quality disturbances using discrete wavelet transform[C]. Electrical Power and Energy Systems (ICEPES), International Conference on. IEEE, 2016: 450-455.
[4] Poisson O, Rioual P, Meunier M. Detection and measurement of power quality disturbances using wavelet transform[J]. IEEE transactions on Power Delivery, 2000, 15(3): 1039-1044.
[5] Eristi B, Yildirim O, Eristi H, et al. A new embedded power quality event classification system based on the wavelet transform[J]. International Transactions on Electrical Energy Systems, 2018: e2597.
[6] Wang H, Wang P, Liu T. Power quality disturbance classification using the S-transform and probabilistic neural network[J]. Energies, 2017, 10(1): 107.
[7] Bhuiyan M J U, Begum M T A, Alam M R. S-transform and mahalanobis distance based approach for classifying power quality disturbances[C]//Electrical, Computer and Communication Engineering (ECCE), International Conference on. IEEE, 2017: 681-685.
[8] Enshaee A, Enshaee P. A New S-Transform-Based Method for Identification of Power Quality Disturbances[J]. Arabian Journal for Science and Engineering, 2018, 43(6): 2817-2832.
[9] Biswal M, Dash P K. Detection and characterization of multiple power quality disturbances with a fast S-transform and decision tree based classifier[J]. Digital Signal Processing, 2013, 23(4): 1071-1083.
[10] Liu H, Hussain F, Shen Y, et al. Complex power quality disturbances classification via curvelet transform and deep learning[J]. Electric Power Systems Research, 2018, 163: 1-9.
[11] Xi Y, Li Z, Zeng X, et al. Detection of power quality disturbances using an adaptive process noise covariance Kalman filter[J]. Digital Signal Processing, 2018, 76: 34-49.
[12] Kapoor R, Gupta R, Jha S, et al. Detection of power quality event using histogram of oriented gradients and support vector machine[J]. Measurement, 2018, 120: 52-75.
[13] Borrás, M. D., Bravo, J. C., & Montaño, J. C. Disturbance ratio for optimal multi-event classification in power distribution networks. IEEE Transactions on Industrial Electronics, 2016, 63(5), 3117-3124.
[15] Zheng, Z., Xiao, X., Chen, X. Y., Huang, C., & Xu, J. Performance evaluation of a mw-class smes-based dvr system for enhancing transient voltage quality by using d–q transform control. IEEE Transactions on Applied Superconductivity, 2018, 28(4), 1-5.
[16] Mahela O P, Shaik A G. Recognition of power quality disturbances using S-transform and rule-based decision tree[C]//Power Electronics, Intelligent Control and Energy Systems (ICPEICES), IEEE International Conference on. IEEE, 2016: 1-6.
[17] Huang, J., Jiang, Z., Rylands, L., & Negnevitsky, M. Svm-based pq disturbance recognition system. Iet Generation Transmission & Distribution, 2018, 12(2), 328-334.
[18] Samantaray, S., Achlerkar, P., & Manikandan, M. S. Variational mode decomposition and decision tree based detection and classification of powerquality disturbances in grid-connected distributed generation system. IEEE Transactions on Smart Grid, 2016, PP(99), 1-1.
[19] Ferreira, D. D., Seixas, J. M., Cerqueira, A. S., Duque, C. A., Bollen, M. H. J., & Ribeiro, P. F. Extracting the transient events from power system signals by independent component analysis. International Transactions on Electrical Energy Systems, 2016, 26(4), 884-900.
[20] Jeevitha, S. S., & Mabel, M. C. Novel optimization parameters of power quality disturbances using novel bio-inspired algorithms: A comparative approach. Biomedical Signal Processing and
Control, 2018, 42, 253-266.