2019 International Conference on Computer Science, Communications and Multimedia Engineering (CSCME 2019) ISBN: 978-1-60595-650-3
Design and Optimization of Kernel Function in Time-Frequency Analysis
Zi-wen ZHOU, Guo-bao RU
*and Liang-cai GAN
School of Electronic Information, Wuhan University, Wuhan Hubei 430072, China
*Corresponding author
Keywords: Time-frequency analysis, Kernel function, Reny.
Abstract. The time-frequency distribution reflects the frequency energy distribution of the signal in different time periods, and the time-frequency analysis can effectively extract the relevant characteristic parameters of the signal. Aiming at the difficulty of regulation of time-frequency distribution kernel function, poor frequency aggregation and weak ability to suppress cross-terms, this paper proposes a kernel function with four parameters. By selecting the kernel function parameters, on the one hand, the core function passband and transition band can be effectively controlled to achieve the ideal filtering effect, and on the other hand, the interference between signal components is greatly suppressed, and the time-frequency aggregation is further improved. At the same time, the kernel function parameters are optimized by using the third-order Renyi information, so that the time-frequency distribution performance and the filtering effect are optimized, which lays a foundation for effectively extracting the relevant characteristic parameters of the signal.
Introduction
Kernel Function Design
The self-term part of the signal in the fuzzy domain is generally concentrated around the center of the origin, and the interference term is distributed around the origin and far from the origin. Therefore, the kernel function is required to have such a property: the passband should contain the self-term, and the stopband contains Cross-term, the transition zone is as steep as possible.
Time-frequency Analysis Structure Frameworks
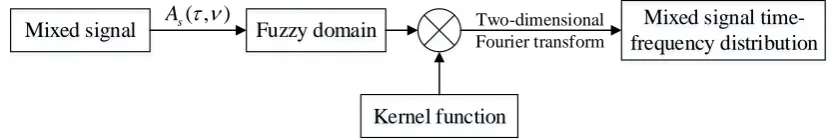
Figure 1 shows the structural framework of time-frequency analysis. By the formula (2) mixing the blur function s t( ) can be transformed to fuzzy domain signal, then multiplied with the kernel function ( , ) , frequency distribution is then obtained through two-dimensional Fourier transform to the mixed signals:
2 ( )
TFR ( , )s t f As( , ) ( , ) ej t f d d
(1)The fuzzy function As( , ) is:
* 2
( , )
2 2
j t s
A s t s t e dt
(2) In equation (2), is the time delay and is the frequency offset. Usually, the self-term part of the signal in the fuzzy domain is concentrated around the center of the origin, and the interference term is distributed around the origin and farther away from the origin. Therefore, the designed kernel function should have the following characteristics: the passband contains the self-term, the stopband contains the cross term, and the transition zone is steep.Mixed signal Fuzzy domain Mixed signal time-frequency distribution
Kernel function ( , )
s
A Two-dimensional
[image:2.595.88.506.430.500.2]Fourier transform
Figure 1. Time-frequency analysis structure framework.
Kernel Function Design
The kernel function of the Butterworth distribution is:
2 2
0 0
1 ( , )
1 ( / ) M( / ) N
(3)
Take, M=1, N1, 0=0.07, 00.07 and get ( , ) the contours in the blur domain as shown in Figure 2. As can be seen from the figure, the passband of the kernel function is a cross shape, which includes both the center of the origin and the central axis of the delay and the central axis of the frequency offset. 0 and 0 respectively regulate the kernel width of the kernel function on the
2 2 2 2
0 0 0 0
1 ( , )
1 ( / ) M ( / ) N ( / ) M( / ) N
(4)
[image:3.595.191.393.280.417.2]The designed kernel function passband range is in the center of the origin, and the passband range on the center axis of the delay and the center axis of the frequency offset is no longer infinitely extended. The kernel width of the kernel function on the time-delay axis and the frequency off-axis can be controlled by 0 and 0 respectively, and M and N jointly control the size of the transition band and the smoothness of the pass band.
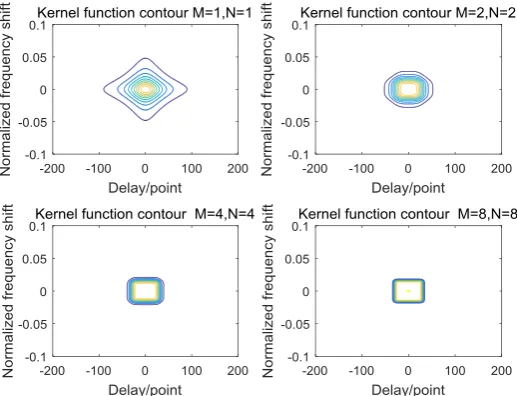
Figure 3 is a contour plot of the enhanced kernel function under different parameters for 0 30
[image:3.595.167.426.449.647.2]and 0 0.016. It can be seen that as the value of M, N increases, the shape of the kernel function changes from a prism shape to a rectangle, and at this time, the transition band region becomes smaller and the shape becomes steeper, and the pass band region becomes larger and becomes flat. At the same time, the designed kernel function can well preserve the self-term of the analyzed signal and filter out the cross-interference items.
Figure 2. Butterworth distribution kernel function contour.
Figure 3. Contour of enhanced kernel function under different parameters.
Kernel Function Parameter Optimization Based on 3rd Order Renyi Information
2
1
R (TFR ) log ( TFR ( , ) ) 1
s s t f dtdf
(5)In the formula, is an order. On the one hand, the Renyi value can measure the complexity of the time-frequency distribution information of the signal, and the other aspect can be used as the inverse measure of the time-frequency aggregation performance in the time-frequency analysis[13]. The larger the Renyi value is, the higher the information and complexity of the time-frequency distribution is, and the worse the time-frequency aggregation performance is. It can be seen that Renyi information is able to effectively evaluate the performance of time-frequency distribution.
Due to the information metric of the odd-order Renyi of the time-frequency distribution, the information metric of the cross-interference term is negligible, and the Renyi information is only related to the signal self-term. In this way, the Renyi information can be used to optimize the parameter delay width 0 and the frequency offset width 0 of the kernel function. Taking M=N=2, the kernel function parameter optimization process of the third-order Renyi information is:
Step 1: First set two parameter sets 0 { 0,0, 0,1,...,0,m1}, 0 { 0,0, 0,1,...,0,n1} of the enhanced
kernel function;
Step 2: First take the first value of the 0 set, then traverse all the values in the 0 set, calculate the
time-frequency distribution 0 of the kernel function according to the 3rd-order Renyi information
value according to the formula (5), and store the values in the first order. Drawing in the matrix to obtain a curve;
Step 3: Search for the inflection point of the slope of the curve. Calculate the slope of each point on the curve R3'( )0 . If R3'(0,1) R3'(0 2,)R3'(0 3,), the optimal value of 0 is 0,opt 0,2;
Step 4: Then repeat step 2, but at this time, 0 takes the second value of the set, and then proceeds to
step 3. At this time, the best value corresponding to 0 is obtained, and after 0 passes through the set,
it will be obtained. First-order optimal value matrix, find the matrix mean, and take the value avg opt,
as the best parameter;
Step 5: At this time, avg opt, is taken as the 0 optimal value, and then the 0 sets are traversed, and
the 3rd-order Renyi information value of the time-frequency distribution of the enhanced kernel function is calculated according to the formula (5), and the values are saved in the first-order matrix. Drawing to get a curve;
Step 6: Search for the inflection point of the slope of the curve. Calculate the slope R3'( )0 of each
point on the curve. If 1R3'(0,1) R3'(0 2,)R3'(0 3,), the optimal value of 0 is 0,opt 0,2.
Simulation Results and Analysis
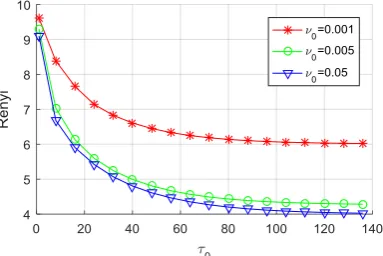
Figures 4 and 5 are plots of Renyi information as a function of 0 and 0 for M = N = 2, respectively.
In Fig. 4, 0=16, 0=32, and 0=48 are taken, respectively. It can be seen from the figure that when
domain, and the subsequent frequency offset width increases so that more cross terms fall on the kernel function. Within the passband, but the influence of the cross terms on the odd-order Renyi information entropy can be neglected. Therefore, the variation of the Renyi information value is not large, and the curve performance is relatively flat. In Fig. 5, 0=0.001, 0=0.005, 0=0.05 are taken
respectively. It can be seen from the figure that when the value of 0 is very small, the delay width corresponding to the pass band of the kernel function is small, and the self-term of the mixed signal in the fuzzy domain is truncated, and the complete retention is not obtained, so the frequency aggregation performance is extremely poor at this time. Renyi has a large information entropy value; As 0 increases, the passband delay width of the kernel function increases, and the mixed signal is
gradually included in the passband region of the kernel function in the fuzzy domain. At this time, the time-frequency aggregation performance is gradually improved, so the Renyi information entropy value Constantly decreasing; When 0 is continuously increased to a certain value, the delay width of the pass band of the kernel function has completely preserved the self-term of the mixed signal in the fuzzy domain, and the increase of the delay width will only cause more cross terms to fall. The kernel function is in the passband, but the influence of the cross term on the odd-order Renyi information entropy is negligible. Therefore, the variation of the Renyi information value is not large, and the curve performance is relatively flat. The inflection point of the speed change on the curve of Fig. 4 and Fig. 5 is taken as the optimal parameter of 0, 0. The optimum parameter value of 0 which can
[image:5.595.306.498.385.513.2]be obtained from Fig. 4 is 0.005; the optimum parameter value of 0 which can be obtained from Fig. 5 is 40.
Figure 4. The 3rd-order Renyi information value with 0. Figure 5. The 3rd-order Renyi information value with 0
Conclusion
Acknowledgement
This research was financially supported by the National Natural Science Foundation of China (No. 61671333).
References
[1] Reddy M J, Adarsh S. Time-frequency characterization of sub-divisional scale seasonal rainfall in India using the Hilbert-Huang transform[J]. Stochastic Environmental Research and Risk Assessment, 2016, 30(4):1063-1085.
[2] Wu J, Long Y, Ji C, et al. Time-frequency analysis of vibration signals generated by high-pressure gas pipeline bursting based on the Hilbert-Huang transform[J]. Journal of Vibration and Shock, 2018, 37(8):113-119.
[3] Zhang Y, Jia X, Yin C. Time-frequency analysis of frequency hopping signal based on partial reconstruction, Xiamen, Fujian, China, 2017[C]. IEEE Inc., 2017.
[4] Li C, Zhu L, Zhang Z. Non-orthogonal frequency hopping signal underdetermined blind source separation in time-frequency domain[J]. Infocommunications Journal, 2016, 8(3):1-7.
[5] Jin Y, Zhou L, Ji H. Parameter Estimation of Frequency-hopping Signals Based on Sparse Time-frequency Distribution[J]. Journal of Electronics and Information Technology, 2018, 40(3):663-669.
[6] Chen Lihu. Research on reconnaissance technology of frequency hopping signal[D]. University of Science and Technology for National Defense, 2009.
[7] Maning. Study on parameter estimation of linear frequency-modulated signal[D]. Nanjing University of Technology, 2014.
[8] Guo Jiantao. Parameter estimation of frequency hopping signal based on time-frequency analysis [D]. Huazhong University of Science and Technology, 2009.
[9] Feng Tao. Research on Frequency hopping Communication Reconnaissance Technology based on time-Frequency Analysis [D]. Beijing University of posts and Telecommunications, 2012.
[10] Zhou Ziwen. Research on frequency hopping signal detection and blind parameter estimation based on enhanced kernel function filtering [M]. Wuhan University, 2019.
[11] Baraniuk R G, Flandrin P, Michel O. Measuring time-frequency information and complexity using the Renyi entropies, Whistler, BC, Can, 1995[C]. IEEE, 1995.
[12] Boutana D, Benidir M, Marir F, et al. A comparative study of sometime-frequency distributions using Renyi criterion, Antalya, Turkey, 2005[C]. European Association for Signal Processing (EURASIP), 2005.