http://dx.doi.org/10.4236/as.2016.74024
How to cite this paper:Cummins, A.M., Widmar, N.J.O., Croney, C.C. and Fulton, J.R. (2016) Exploring Agritourism Expe-rience and Perceptions of Pork Production. Agricultural Sciences, 7, 239-249. http://dx.doi.org/10.4236/as.2016.74024
Exploring Agritourism Experience and
Perceptions of Pork Production
Ann M. Cummins
1, Nicole J. Olynk Widmar
1*, Candace C. Croney
2, Joan R. Fulton
11Department of Agricultural Economics, Purdue University, West Lafayette, IN, USA
2College of Veterinary Medicine, Purdue University, West Lafayette, IN, USA
Received 12 March 2016; accepted 17 April 2016; published 22 April 2016
Copyright © 2016 by authors and Scientific Research Publishing Inc.
This work is licensed under the Creative Commons Attribution International License (CC BY).
http://creativecommons.org/licenses/by/4.0/
Abstract
The interest of consumers in farming activities is evident and agricultural producers have re-sponded to this increasing interest in a number of ways, including inviting visitors to farm opera-tions through tourism or farm visits. Livestock industries, in particular, are interacting with the public in numerous ways, including via marketing channels for their products, interacting with community leaders and community members in regard to location siting and regulations, and in-viting people onto their operations via agritourism. An improved understanding of who visits agricultural locations (particularly livestock operations) and consumers’ perceptions about lives-tock agriculture is needed in order to begin to understand the possible relationships between on- farm experiences and consumers’ perceptions. Thus, it is important to gain a deeper understand-ing in consumers’ interests, includunderstand-ing their levels of concern for production process attributes, such as animal welfare, relative to product attributes like price and taste. This analysis investi-gates the demographics of consumers who have (and have not) visited various agritourism opera-tions, studies differences in preferences for (or perceptions of) animal welfare relative to other pork attributes between consumers who have or have not visited a livestock operation, as well as amongst consumers with varying levels of involvement in household food production. Indeed the relationships explored are between having visited a livestock operation and the perceptions. This study found that 69% of participants had visited a livestock operation (pig farm, dairy farm, and/or horse farm) at some point. The majority of respondents agreed that agriculture was an important industry, yet, those who had visited livestock operations were more likely to note con-cerns about the impact of livestock operations on water quality in their county.
Keywords
Agritourism, Animal Welfare, Best-Worst Scaling, Pork Production
1. Introduction
Livestock producers today are interacting with the public in many ways including through the products they sell in stores, communication and marketing of their products, interacting with their neighborhoods and communities, and inviting people onto their farms. Consumers’ interest in farming activities is evident and producers have re-sponded to this increasing interest in multiple ways, including inviting consumers to farms through tourism or farm visits. The livestock industry has displayed an increased interest in understanding consumers’ perceptions and preferences for different agriculture outputs (food products, mainly) and practices used to produce those products. Thus, it is important to gain a deeper understanding of consumers’ interests, including their levels of concern for production process attributes, such as animal welfare, relative to produce attributes like price and taste.
The pork industry has received attention recently regarding the welfare of the pigs raised in specific housing systems or using certain practices. Recent literature on livestock product consumption has demonstrated an in-creasing concern for how livestock animals are handled and raised [1]-[5]. Consumers’ preferences for different production practices and consumers’ willingness to pay for verified production practices have been studied at length [2] [5]-[9].
Along with an interest in understanding consumers’ preferences for pork attributes, production practices or product attributes, another area of interest is in understanding relationships between preferences for production processes and other factors, such as knowledge or consumer demographics. Showing people what occurs on farms in order to better inform them about daily farming practices and activities is currently a major topic of discussion in animal agriculture. The underlying assumption is that if people can see the farm they will better understand what happens and why, resulting in reduced concern about animal welfare or the production practic-es used. In order to begin to understand the possible relationships between farm experiencpractic-es and perceptions, better understanding of who visits agricultural locations (particularly livestock operations) and consumers’ per-ceptions about livestock agriculture is needed. The definition of agritourism differs across much of the literature; agritourism experiences can vary with the amount of contact participants who have with nature, the authenticity of the experience, and whether or not the farm visited is a working farm [10]. As a starting point in this analysis, agritourism is investigated as a function of people’s experiences with visiting a farm operation.
There has been discussion in the international literature surrounding agritourism related to tourism and rural development in recent times and especially over the past 20 years [10]. Agritourism is frequently discussed in its relation to rural development, potential impacts of diversification and stabilization of small farm income, or in regard to the analysis of key success factors for the development of an agritourism enterprise. However, little is known about the impact agritourism has on consumers’ preferences for agricultural products. Consumers’ pre-ferences and perceptions in relation to their experiences with agriculture are particularly important in the discus-sion of production practices used in livestock production. No research that we are aware of addresses the differ-ences in preferdiffer-ences for (or perceptions of) animal welfare relative to other pork attributes between consumers who have or have not visited a livestock operation.
The goal of this analysis was to first examine the differences between those individuals in the population who have and have not been to a livestock operation. Second, this analysis sought to expand understanding about how respondents who have been to a livestock operation might differ in their preferences for pork production attributes and their perspectives of livestock operation growth compared with those who have not been to a li-vestock operation. Overall, this study sought to link preferences for pork products with lili-vestock farm expe-rience. Cummins, Widmar and Croney [11] studied consumers’ preferences for seven pork attributes (animal welfare, price, taste, environmental impact, pork/food safety, locally raised/farmed pigs, and locally processed pork) to gain an understanding of the relative importance of these attributes for pork. Shares of preference were estimated for each of the seven pork attributes; by design the shares must sum to 100%, thereby allowing rela-tive ranking of each attribute against each other attribute. Cummins, Widmar, and Croney [11] found that the mean preference share for animal welfare was 16% and that animal welfare ranked the third most important (out of the seven attributes studied).
2. Materials and Methods
Survey Instrument and Data
23-August 6 of 2014. A large opt-in panel provider, Light speed GMI, was used to recruit participants who were at least 18 years of age. The survey was targeted to be representative of U.S. households in terms of age, gender, pre-tax income, and region of residency.
According to the U.S. Census Bureau the total U.S. population is 308,745,538 people (2010 Census, Revised 2014). In order to have a sufficient sample size to offer insight, the sample size needed, S, was calculated in the
following way: S= X/[1+(X/P)] where P is the total size of the U.S. population and X Z Z F 1 F D D
−
= × ×
×
where Z is the value associated with the confidence interval desired assuming a normal distribution. In this case the confidence interval desired is 95%, thus 1.96 is the value of Z. The value of F is 0.5 which was the frequen-cy of the factor in the study. The variable D was defined to be the maximum difference between the sample and population means that is acceptable, D = 0.05 in this study. Thus for the U.S. population the sample size needed to offer insights into U.S. households is 385. The survey collected 1,004 responses, however, a simple validation test was used within the survey and 857 individuals (85.4%) answered this validation question correctly (or, passed the test).
According to Gao, House, and Bi [12] the use of a simple validation test is a way to improve data quality. In their study Cummins, Widmar and Croney [11] found by testing within their sample that the respondents who passed this validation test had statistically different sample mean and variance values for the size shares of pre-ference for many attributes studied compared to those who didn’t pass the validation test. Thus, only the 857 respondents who passed the validation test have been used in this analysis. Given the calculated required sample size of 385, the sample size for this analysis of 857 individuals is more than sufficient.
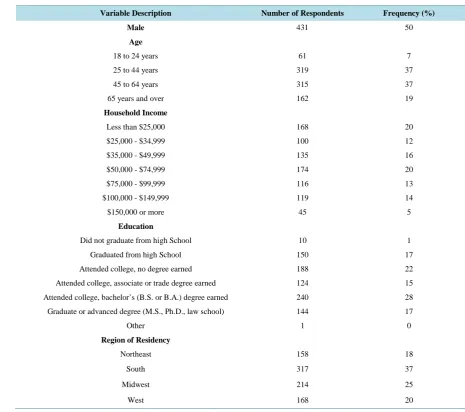
A recap of survey respondent demographics and level of education for the sample being analyzed is displayed inTable 1. According to the U.S. Census Bureau [13] 49% of the U.S. population is male and in this sample 50% were male. According to the U.S. Census Bureau [13] 70% of the U.S. population over the age of 18 was 25 - 64 years old; this sample had 74% of respondents indicate they were between the ages of 25 and 64 years old. The average pre-tax income in the U.S. is $73,034 [14] and this sample had $67,453 for the mean income. The four regions of residency according to the U.S. census [15] are Northeast, South, Midwest, and West with 18%, 38%, 22% and 22% of the U.S. population respectively. These numbers are very similar to the sample used in this analysis. According to the U.S. Census Bureau [16] the percentage of the population 25 years and over who have at least a high school degree is 86.9% and 30.1% have at least a bachelor’s degree. This sample was slightly more educated than the U.S. population and had 99% of the population (18 years and older) with at least a high school degree and 45% with at least a bachelor’s degree.
Along with basic demographic data, information was collected regarding consumers’ participation in a wide variety of tourism activities, including having visited different operations, such as livestock or crop farms, and food plants or production facilities. Participants were given the list of operation types and asked when last they had visited each operation. Respondents were asked, for each operation type, to select one of the following res-ponses: “within the last year”, “1 - 10 years ago”, “over 10 years ago”, and “I have never visited such an opera-tion”. Individuals who selected “within the last year”, “1 - 10 years ago” and “over 10 years ago” were com-bined and defined as the group who had ever visited the operation type. The full list of operation types and per-centage of respondents who had ever visited the respective types are displayed inFigure 1. It is important to note that while participants were counted as having visited an operation type when they indicated that they had done so, the purpose of the visit or the depth of the experience was not measured. Since this analysis is focused on gaining deeper insight on the relationships between visiting agritourism operations, particularly focused on livestock, and preferences for pork products, it is of interest to study the group of individuals who have been to one of the livestock operations. Sixty-nine percent of participants indicated that they had visited a livestock op-eration; in other words, a total of 69% of respondents had been to a dairy farm, pig farm and/or horse farm.
Table 1. Sample demographics (n = 857).
Variable Description Number of Respondents Frequency (%)
Male 431 50
Age
18 to 24 years 61 7
25 to 44 years 319 37
45 to 64 years 315 37
65 years and over 162 19
Household Income
Less than $25,000 168 20
$25,000 - $34,999 100 12
$35,000 - $49,999 135 16
$50,000 - $74,999 174 20
$75,000 - $99,999 116 13
$100,000 - $149,999 119 14
$150,000 or more 45 5
Education
Did not graduate from high School 10 1
Graduated from high School 150 17
Attended college, no degree earned 188 22
Attended college, associate or trade degree earned 124 15
Attended college, bachelor’s (B.S. or B.A.) degree earned 240 28
Graduate or advanced degree (M.S., Ph.D., law school) 144 17
Other 1 0
Region of Residency
Northeast 158 18
South 317 37
Midwest 214 25
West 168 20
Seven pork attributes (animal welfare, price, pork/food safety, taste, environmental impacts, locally farmed/ raised pigs, locally processed pork) were studied in a previous analysis by Cummins, Widmar, and Croney [11]. Allocation of total shares of preference, necessarily summing to 100% across all seven attributes, were com-pleted; these results are referred to as preference shares for each of the attributes. The results of the mean esti-mated shares of preference for the seven different pork attributes are shown inFigure 2. Correlations between the calculated individual shares of preference for the seven pork attributes from Cummins, Widmar and Croney
[11] and participants’ responses to questions about visiting various agricultural operation types were completed using Pearson correlations and statistical significance at the 5% and 1% levels.
3. Results and Discussion
3.1. Tourism Participation
Figure 1. Percent of respondents who have ever visited the operation types investigated (n = 857).
Figure 2. U.S. consumer shares of preference for pork attributes (n = 857).
68% 43%
64%
76% 58%
32%
52%
72% 43%
52% 45%
51%
0% 10% 20% 30% 40% 50% 60% 70% 80% Pumpkin Patch
Corn Maze Apple Orchard or Pick your own fruit Farm stand, food stand, restaurant on farm Dairy Farm Pig Farm Vineyard or winery tour Animal shelter or rescue organization Fish Hatchery Brewery Tour Food plant or production tour Horse Farm
Animal Welfare 16%
Price 9%
Pork/Food Safety 42% Taste
22% Environmental
Impact 5%
Locally Raised/Farmed Pigs
3%
Locally Processed Pork
[image:5.595.149.503.487.712.2]Relationships between gender, age, income, and respondents who had been to each operation type were inves-tigated using cross-tabulations (Table 2). In addition, relationships between region of residence and having vi-sited the various operation types investigated are presented inTable 3. The values in each of the cells in the ta-ble represent the percentage of those in the corresponding demographic group that have been to the particular operation type (e.g. 70.8% of males have been to a livestock operation). Men more frequently reported having been to a dairy farm, pig farm, fish hatcher, brewery tour and food plant or production tour than did women. In
Table 2. Cross-tabulations of basic demographics and having ever visited the operation type (n = 857).
Gender1 Age (in years)2 Income3
Ever visited the following operation
type Fem
al e (* ) M al e ( **) 18 24 (a ) 25 44 (b ) 45 64 (c ) 65 + (d ) < $25, 000 (A ) $25, 000 - $34, 999 (B ) $35, 000 - $49, 999 (C ) $50, 000 - $74, 999 (D ) $75, 000 - $99, 999 (E ) $100,
000 -
$149, 999 (F ) $150, 000 + (G )
Livestock operation 67.1 70.8 60.7 64.6 72.7 73.5 59.5 F 67.0 68.1 67.8 75 81.5A 66.7
Pumpkin patch 70.2 65.0 67.2 71.2 66.7 62.3 50.6DEFG 63.0F 65.2F 71.3A 73.3A 82.4ABC 80.0A
Corn maze 43.9 42.9 67.2cd 50.8cd 37.8ab 30.9ab 25.6DEFG 27.0DEFG 40.0F 47.1ABF 51.7AB 67.2ABCD 57.8AB
Apple orchard or
pick your own fruit 60.8 66.4 52.5 65.5 63.8 63.6 48.2 DFG 56.0F 63.0F 64.9AF 66.4 83.2 ABCD 75.6A Farm stand, food
stand, restaurant on farm
75.4 77.0 59.0cd 72.1 80.3a 82.7a 64.9EF 68.0F 74.8F 78.2 83.6A 89.9ABC 77.8
Dairy farm 54.0** 61.3* 42.6cd 52.7d 61.3a 66.0ab 47.0EF 55.0 57.0 55.7 66.4A 70.6A 55.6
Pig farm 24.6** 40.1* 29.5 35.4 30.2 32.1 26.2F 24.0F 30.4 32.8 37.1 48.7AB 24.4
Horse farm 50.0 51.0 52.5 49.5 54.3 46.3 44.0F 45.0F 46.7F 44.8F 57.8 71.4ABCD 53.3
Vineyard or winery
tour 48.6 55.2 32.8cd 49.5d 51.4ad 64.8abc 26.8CDEFG 38.0EFG 53.3AFG 54.0AFG 61.2AB 74.8ABCD 80.0ABCD
Animal shelter or
rescue organization 74.4 69.6 67.2 71.5 73.7 71.6 66.1 69.0 71.9 75.9 72.4 79.0 66.7
Fish hatchery 36.2** 49.7* 26.2cd 39.5d 44.4a 53.1ab 28.6EF 34.0EF 40.0 44.3 55.2AB 57.1AB 51.1
Brewery tour 45.3** 58.5* 37.7d 50.8 52.1 59.3a 31.0DEFG 40.0FG 45.9F 54.6AF 59.5AF 79.8ABCDE 71.1AB
Food plant or
production tour 40.1** 49.4* 36.1 45.1 46.3 44.4 33.3EF 31.0EF 43.0F 44.8F 53.4AB 63.9ABCD 51.1
1Significant differences at the 5% level are marked by * and **; 2Significant differences at the 5% level are marked by a, b, c, d’; 3Significant
differ-ences at the 5% level are marked by A, B, C, D, E, F, G.
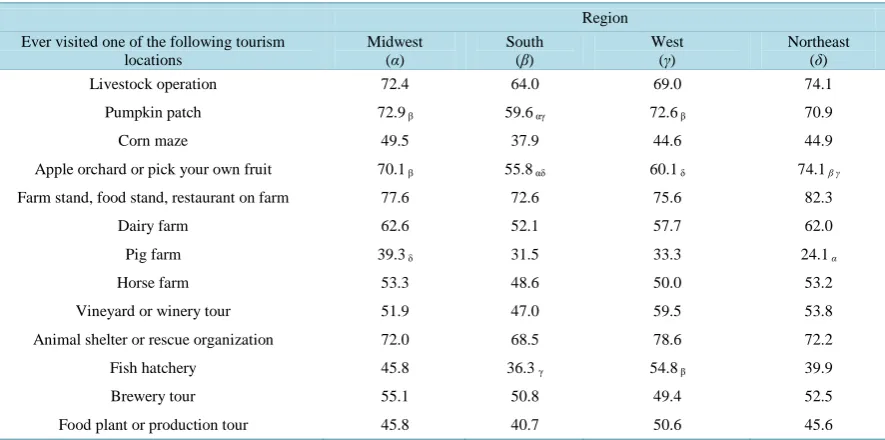
Table 3. Cross-tabulations between region of residency and having ever visited the operation type (n = 857).
Region Ever visited one of the following tourism
locations
Midwest (α)
South (β)
West (γ)
Northeast (δ)
Livestock operation 72.4 64.0 69.0 74.1
Pumpkin patch 72.9 β 59.6 αγ 72.6 β 70.9
Corn maze 49.5 37.9 44.6 44.9
Apple orchard or pick your own fruit 70.1 β 55.8 αδ 60.1 δ 74.1βγ Farm stand, food stand, restaurant on farm 77.6 72.6 75.6 82.3
Dairy farm 62.6 52.1 57.7 62.0
Pig farm 39.3 δ 31.5 33.3 24.1α
Horse farm 53.3 48.6 50.0 53.2
Vineyard or winery tour 51.9 47.0 59.5 53.8
Animal shelter or rescue organization 72.0 68.5 78.6 72.2
Fish hatchery 45.8 36.3 γ 54.8 β 39.9
Brewery tour 55.1 50.8 49.4 52.5
Food plant or production tour 45.8 40.7 50.6 45.6
[image:6.595.95.538.489.709.2]general, those reporting higher income levels (up to $150,000) more frequently reported having been to each of the operations studied, with the exception of those who had attended an animal shelter or rescue organization where no statistical differences were found between income levels. Individuals living in the Midwest or West more frequently reported having been to a pumpkin patch than did those living in the South. Individuals who lived in the Midwest statistically more frequently reported having been to a pig farm than those living in the Northeast. These regional differences are not surprising in that it is reasonable to assume that those living in the vicinity of the respective operations have easier access to an operation type, and are therefore more likely to have had the opportunity to visit one.
Six operation types were found to have differing levels of reported attendance across age groups, namely corn maze, “farm stand, food stand, restaurant on farm”, dairy farm, vineyard or winery tour and brewery tour. In each of the eight, with the exception of having been to a corn maze, those in the age category 65 and older more frequently reported having been to the operation than did individuals in the age category 18 - 24. This finding is probably due in to increased experience over time. There were no statistical differences in age categories of those who had attended pumpkin patches, apple orchards or pick your own fruit locations, pig farm, horse farm, animal shelter or rescue organization or food plant/production tour.
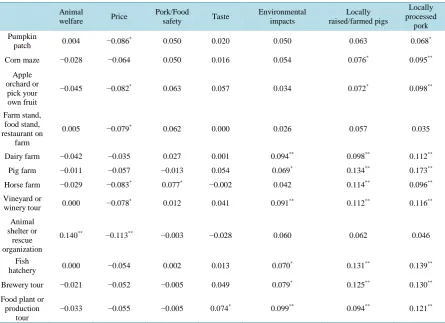
[image:7.595.91.537.387.710.2]Correlations between the size of preference shares for pork attributes and individuals who had attended each operation type were analyzed; these correlations are displayed inTable 4. Reporting having visited an animal shelter or rescue organization was positively correlated with the size of the share of preference for animal wel-fare when purchasing pork. This result is consistent with previous findings. The idea that individuals with con-nections or interactions with animals, primarily pets such as cats or dogs, tend to be more concerned about the welfare of all animals, including livestock, is not novel. Rothgerber and Mican [17] found that individuals who owned pets as children had stronger empathy for animals. McKendree, Croney and Widmar [3] postulated that
Table 4. Pearson correlations between having ever visited an operation type and the size of the share of preference for pork attributes (n = 857).
Animal
welfare Price
Pork/Food
safety Taste
Environmental impacts
Locally raised/farmed pigs
Locally processed
pork Pumpkin
patch 0.004 −0.086
*
0.050 0.020 0.050 0.063 0.068*
Corn maze −0.028 −0.064 0.050 0.016 0.054 0.076* 0.095**
Apple orchard or
pick your own fruit
−0.045 −0.082* 0.063 0.057 0.034 0.072* 0.098**
Farm stand, food stand, restaurant on
farm
0.005 −0.079* 0.062 0.000 0.026 0.057 0.035
Dairy farm −0.042 −0.035 0.027 0.001 0.094** 0.098** 0.112** Pig farm −0.011 −0.057 −0.013 0.054 0.069* 0.134** 0.173**
Horse farm −0.029 −0.083* 0.077* −0.002 0.042 0.114** 0.096**
Vineyard or
winery tour 0.000 −0.078
* 0.012 0.041 0.091** 0.112** 0.116**
Animal shelter or rescue organization
0.140** −0.113** −0.003 −0.028 0.060 0.062 0.046
Fish
hatchery 0.000 −0.054 0.002 0.013 0.070
*
0.131** 0.139** Brewery tour −0.021 −0.052 −0.005 0.049 0.079* 0.125** 0.130**
Food plant or production
tour
−0.033 −0.055 −0.005 0.074* 0.099** 0.094** 0.121**
human-animal interactions or relationships, particularly pet ownership, had the potential to influence people’s perceptions of livestock animal welfare, and found that in U.S. households, pet owners were significantly more concerned about livestock animal welfare than those who did not own dogs and/or cat. The findings of Cummins, Widmar and Croney [11] also included that the ownership of a dog and/or cat was positively correlated with the size of the share of preference for animal welfare in the seven different pork attributes examined. Thus, finding that individuals who have visited animal shelters or rescues, which are predominantly directed towards species commonly classified as pets, are more sensitive to animal welfare concerns is supported by past studies.
Further, it is interesting to note that of all the tourism locations investigated, having visited an animal shel-ter/rescue organization was the only visit experience correlated with the size of the share of preference for the pork attribute of animal welfare. In particular, given the popularity of agritourism as a way to communicate with the general public by agricultural circles, it is indeed interesting to note that having visited a livestock operation was not significantly correlated with the size of the preference share for animal welfare.
3.2. Household Production and Involvement in Agriculture
In addition to visiting agricultural operations, people have many different ways of being exposed to agriculture and food production practices; direct ownership and/or household production of food can be among these. Par-ticipants were therefore asked, “Do you, a family member or relative own or operate a farm business (in any ca-pacity, including a partnership or part-owner)?” Respondents selected all responses that applied from the list: “Yes, I own or operate a farm business”, “Yes, I have a family member or relative who owns or operates a farm business”, and “No.” Eighty-eight percent of respondents did not report any familial ties (including self) to any-one who owned or operated a farm business in any capacity.
Cross-tabulations revealed that individuals who reported having been to a livestock operation more frequently also reported being an owner or operator of a farm operation and also more frequently reported having family members or relatives who owned or operated a farm business than those who had not been to a livestock opera-tion. The cross-tabulation analysis revealed that individuals who had visited a livestock operation more fre-quently reported having been involved in each of the household production practices individually assessed. In-dividuals reporting having never been to a livestock operation more frequently reported not being involved in any of the household production practices examined in the previous three years.
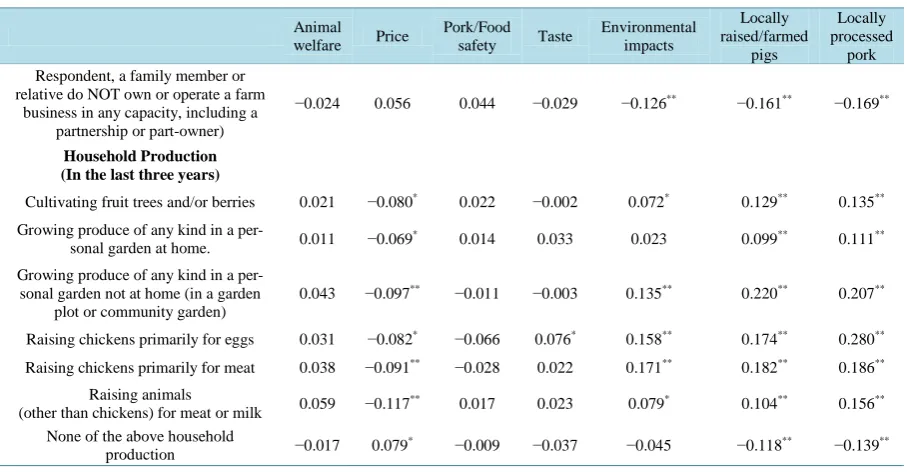
To further understand households involved in home production of food products, participants were asked, “in the last three year time period, has your household been actively involved in producing food for your own fami-ly through any of the following ways?” The options included producing fruits and berries, growing produce in a garden at home or in a community garden, raising chickens for eggs or meat and raising other animals for meat or milk as well as the option of “none of the above.” The results revealed that in the previous three year period, 13% of participants’ households had been involved in cultivating fruit trees and/or berries, 33% of their house-holds grew produce of some kind in a personal garden at home, 5% grew produce of some kind in a personal garden not at home, 6% raised chickens primarily for eggs, 4% raised chickens primarily for meat, and 4% raised animals (other than chickens) for meat or milk. Sixty-five percent of households reported not being in-volved in any household production. Participation in any type of household production was positively correlated with being involved in all other household production practices (at the 1% significance level) and negatively correlated with having self or familial ties to owning or operating a farm operation (at the 1% significance level). In other words, those individuals who produced one type of food for their household use were more likely to produce other types of food. In addition, those who owned or operated a farm were less likely to grow food for their own household consumption.
Table 5. Pearson correlations between involvement in agriculture and size of the share of preference for pork attributes (n = 857).
Animal
welfare Price
Pork/Food safety Taste
Environmental impacts
Locally raised/farmed
pigs
Locally processed
pork Respondent, a family member or
relative do NOT own or operate a farm business in any capacity, including a
partnership or part-owner)
−0.024 0.056 0.044 −0.029 −0.126** −0.161** −0.169**
Household Production (In the last three years)
Cultivating fruit trees and/or berries 0.021 −0.080* 0.022 −0.002 0.072* 0.129** 0.135**
Growing produce of any kind in a
per-sonal garden at home. 0.011 −0.069
* 0.014 0.033 0.023 0.099** 0.111**
Growing produce of any kind in a per-sonal garden not at home (in a garden
plot or community garden)
0.043 −0.097** −0.011 −0.003 0.135** 0.220** 0.207**
Raising chickens primarily for eggs 0.031 −0.082* −0.066 0.076* 0.158** 0.174** 0.280**
Raising chickens primarily for meat 0.038 −0.091** −0.028 0.022 0.171** 0.182** 0.186**
Raising animals
(other than chickens) for meat or milk 0.059 −0.117
** 0.017 0.023 0.079* 0.104** 0.156**
None of the above household
production −0.017 0.079
* −0.009 −0.037 −0.045 −0.118** −0.139**
Note: Statistical significance (2-tailed) at the 5% and 1% level is represented by * and ** respectively.
production activities except for growing produce in a personal garden not at home” was positively correlated with the size of the share of preference for environmental impacts.
3.3. Perceptions of Agriculture and Growth
Participants were shown a series of 10 statements about agriculture or livestock growth and asked to respond with how much they agreed or disagreed on a Likert-scale of one through seven, where one was “very strongly disagree” and seven was “very strongly agree.” The statements provided and the mean responses received are as follows: “I would oppose the building of new livestock operations in my county” (3.36), “I believe that livestock farms are environmentally harmful” (3.67), “I would oppose the growth of livestock operations in my county” (3.21), “I am concerned about the impacts of water quality from livestock operations in my county” (4.18), “I have experienced negative impacts from livestock operations located near my home or work” (2.54), “I am sup-portive of the growth of livestock agriculture in my county” (4.83), “I am supsup-portive of the growth of livestock agriculture in my state but would prefer growth outside of my county/region” (3.84), “agriculture is an important industry in my state” (5.32), “odor/smell from livestock operations is a major concern for me” (3.99), and “I feel that livestock operations make good neighbors” (3.91).
Cross-tabulations between participant’s responses to the agriculture and livestock growth statements and whether they had been to a livestock operation were assessed and are reported for a subset of those statements (Table 6). Respondents who indicated that they had been to a livestock operation more frequently selected re-sponse “6” and less frequently selected “4” in rere-sponse to the statement, “I am concerned about impacts on wa-ter quality from livestock operations in my county” than did those who had not been to a livestock operation. The most significant differences in responses between those who had and had not been to a livestock operation were responses to the statements “I am supportive of the growth of livestock agriculture in my county.” In re-sponse to this statement, those who had been to a livestock operation more frequently selected rere-sponse options “5”, “6”, and “7”and less frequently selected options “2” and “4” than those who had not been to a livestock op-eration. Thus, respondents who had been to a livestock operation more frequently indicated agreement that they were supportive of the growth of livestock agriculture in their county.
Table 6. Cross-tabulations between perspective on agriculture and livestock growth with having visited a livestock operation (n = 857).
I w o u ld o pp o se t h e b u il d in g o f n ew li v es to ck o p er at io n s in m y c o u n ty . 1 I a m co n ce rn ed ab o u t i m pa ct s o n w at er q u al it y f ro m liv es to ck o p er at io n s in m y c o u n ty . 3 I h av e ex p er ien ced n eg at iv e i m p ac ts fr o m l iv es to ck o p er at io n s l o ca te d n ear m y h o m e o r w o rk . 4 I a m s u pp o rt iv e o f th e g ro w th o f li v es to ck ag ri cu lt u re i n m y co u n ty . 5 A g ri cu lt u re i s a n im po rt an t i nd u st ry in m y s ta te . 6 I fe el th at liv es to ck o p er at io n s m ak e g o o d n ei g h b o rs . 7 Ever visited a livestock operation No (ᶏ)
Yes (ᶀ)
No (*)
Yes
(**) No (α) Yes
(β)
No (•)
Yes (••)
No
(□) (□□) Yes No (ϕ)
Yes (θ)
Very strongly disagree 1
20.7ᶀ 21.8ᶏ 10.9 10.5 45.1 41.1 4.9 2.5 6.4□□ 1.7□ 12.0θ 7.3ϕ 2 12.4 18.1 9.0 9.8 11.7β 22.0α 6.0•• 2.9• 3.4 2.4 13.9 10.3
3 9.0 13.7 10.2 12.5 10.5 8.6 7.9 6.8 6.4 4.4 15.8 13.9
4 33.1ᶀ 21.5ᶏ 29.3** 19.8* 19.5β 11.0α 39.8•• 24.2• 27.1□□ 15.6□ 38.7 32.3 5 12.0 10.0 21.4 19.5 7.9 6.8 16.2•• 22.3• 15.4 19.8 10.5 14.9
6 6.0 9.3 10.9** 16.2* 3.8 6.1 14.3•• 24.7• 16.2□□ 23.4□ 6.8θ 13.7ϕ Very
Strongly Agree 7
6.8 5.6 8.3 11.7 1.5β 4.4α 10.9•• 16.6• 25.2□□ 32.8□ 2.3θ 7.6ϕ
1Significant differences at the 5% level are marked by ᶏ and ᶀ; 2Significant differences at the 5% level are marked by A and B’; 3Significant
differ-ences at the 5% level are marked by * and **; 4Significant differences at the 5% level are marked by α and β; 5Significant differences at the 5% level
are marked by • and ••; 6Significant differences at the 5% level are marked by □ and □□; 7Significant differences at the 5% level are marked by ϕ and θ.
(neutral). This implies that those who had been to a livestock operation felt that agriculture is an important in-dustry in their state.
4. Conclusions
The focus of this analysis was to examine individuals who have visited livestock operations and determine how they might differ in their preferences for pork attributes, their involvement in agriculture, and their perceptions about agriculture overall (and specifically growth in the agriculture sector). The results showed that 69% of par-ticipants had visited a livestock operation (pig farm, dairy farm, and/or horse farm) at some point. Results also showed that those who had visited livestock operations did not differ in gender, age, or region of residency, but they tended to have higher incomes. Those who had been to a livestock operation were more likely to have also owned or were related to someone who owned or operated a farm business than those who had not been to a li-vestock operation. Similarly, those who had visited a lili-vestock operation more frequently participated in each of the home production practices examined. This suggests that those who had been to a livestock operation had more familiarity with agricultural practices (whether for production or personal purposes).
While the majority of participants indicated that they agreed that agriculture was an important industry in their state, those who had been to a livestock operation stated stronger levels of agreement than those who had not been to a livestock operation. Despite the belief that agriculture is important in their state, those who had been to a livestock operation more frequently agreed with the statements “I would oppose the growth of lives-tock operations in my county”, and “I am concerned with the impacts on water quality from liveslives-tock operations in my county”. While this study sought to measure levels of concern and agreement with various statements about animal agriculture, a limitation of this analysis is that there was not data collected specific to why respon-dents may or may not be concerned. Additional insights into the factors (beyond agritourism involvement) that may be influencing levels of agreement with beliefs or perceptions of agriculture should be explored in future studies.
Acknowledgements
provided the funding for the study. Researchers at Purdue University conducted the study and analysis without input, collaboration, sharing of survey design or participation in data collection by the funders, Fair Oaks Farms or Belstra Milling Co. in order to avoid biases or the perception of biases arising from working with industry groups.
References
[1] Carpio, C.E., Wohlgenant, M.K. and Boonsaeng, T. (2008) The Demand For Agritourism in the United States. Journal
of Agricultural and Resource Economics, 33, 254-269. http://www.jstor.org/stable/41220626
[2] McKendree, M.G.S., Croney, C.C. and Widmar, N.J.O. (2014) Effects of Demographic Factors and Information Sources on United States Consumer Perception of Animal Welfare. Journal of Animal Science, 92, 3161-3173.
[3] McKendree, M.G.S., Croney, C.C. and Widmar, N.J.O. (2014) Current Factors Influencing Perceptions of Animals and Their Welfare. Journal of Animal Science, 92, 1821-1831.
[4] Olynk Widmar, N.J. and Ortega, D.L. (2014) Comparing Consumer Preferences for Livestock Production Process Attributes Across Products, Species, and Modeling Methods. Journal of Agricultural and Applied Economics, 46, 375-391.
[5] Olynk, N.J., Tonsor, G.T. and Wolf, C.A. (2010) Consumer Willingness to Pay for Livestock Credence Attribute Claim Verification. Journal of Agricultural and Resource Economics, 35, 261-280.
http://www.jstor.org/stable/41960517
[6] Lusk, J. and Briggeman, B. (2009) Food Values. American Journal of Agricultural Economics, 91, 184-196.
[7] McKendree, M.G.S., Widmar, B.O., Ortega, D.L. and Foster, K.A. (2013) Consumer Preferences for Verified Pork-Rearing Practices in the Production of Ham Products. Journal of Agricultural and Resources Economics, 38, 397-417.
http://ageconsearch.umn.edu/bitstream/165935/2/JARE,Dec2013,%237,McKendree,pp397G%C3%87%C3%B4417.pd f
[8] Tonsor, G., Nicole J Olynk, and Christopher Wolf. (2009) Consumer Preferences for Animal Welfare Attributes: The Case of Gestation Crates. Journal of Agricultural and Applied Economics, 41, 713-730.
[9] Sacket, H.M., Shupp, R. and Tonsor, G. (2013) Consumer Perceptions of Sustainable Farming Practices: A Best-Worst Scenario. Agricultural and Resource Economics Review, 42, 275-290.
[10] Flanigan, S., Blackstock, K. and Hunter, C. (2014) Agritourism from the Perspective of Providers and Visitors: A To-pology-Based Study. Tourism Management, 40, 394-405. http://dx.doi.org/10.1016/j.tourman.2013.07.004
[11] Cummins, A.M., Widmar, N.J.O. and Croney, C.C. (2016) Understanding Consumer Pork Attribute Preferences.
Theoretical Economic Letters, 6, 166-177.http://dx.doi.org/10.4236/tel.2016.62019
[12] Gao, Z.F., House, L.A .and Bi, X. (2012) Finding True Consumer Attitudes: Do Validation Questions Help? Food and Resource Economics Department, University of Florida, Gainesville.
http://ageconsearch.umn.edu/bitstream/123922/1/aaea-poster-05-18.pdf
[13] U.S. Census Bureau (2014) DP-1 Profile of General Population and Housing Characteristics: 2010, 2010 Demographic Profile Data.
http://factfinder.census.gov/faces/tableservices/jsf/pages/productview.xhtml?pid=DEC_10_DP_DPDP1&prodType=ta ble
[14] U.S. Census Bureau (2008-2012) DP01: Selected Economics: 2008-2012 American Community Survey 5-Year Esti-mates.
http://factfinder.census.gov/faces/tableservices/jsf/pages/productview.xhtml?pid=ACS_12_5YR_DP03&prodType=tab le
[15] U.S. Census Bureau (2013) Annual Estimates of Housing Units for the United States, Regions, Divisions, States and Counties: April 1, 2010 to July 1, 2013: 2013 Population Estimates.
http://factfinder.census.gov/faces/tableservices/jsf/pages/productview.xhtml?pid=PEP_2013_PEPANNHU&prodType =table
[16] U.S. Census Bureau (2014) Educational Attainment: 2014 American Community Survey-One Year Estimates.
http://factfinder.census.gov/faces/tableservices/jsf/pages/productview.xhtml?pid=ACS_14_1YR_S1501&prodType=ta ble
[17] Rothgerber, H. and Mican, F. (2014) Childhood Pet Ownership, Attachment to Pets, and Subsequent Meat Avoidance. The Mediating Role of Empathy towards Animals. Appetite, 79, 11-17.