© 2016, IRJET | Impact Factor value: 4.45 | ISO 9001:2008 Certified Journal | Page 70
STUDY OF BEHAVIOUR OF FLOATING COLUMN FOR SEISMIC ANALYSIS
OF MULTISTOREY BUILDING
Ms.Waykule.S.B
1*, Mr.Kadam.S.S
2, Ms.Lale S.V
31PG Student of SKN Sinhgad College of Engineering, Korti, Pandharpur, Maharastra, India.
2Assistant Professor Of Civil Engineering Department, SKN Sinhgad College of Engineering, Korti, Pandharpur.
3Assistant Professor Of Civil Engineering Department, SKN Sinhgad College of Engineering, Korti, Pandharpur.
Abstract:
Now a day’s lots of multistory buildings are constructed with floating column for aesthetic point of view and for getting more space at parking areas for movement. But such building are highly get damaged during earthquake in highly seismic zone as compared to normal building.
In this paper present study about analysis of G+5 Building with and without floating column in highly seismic zone v. four models are created such as floating column at 1st ,2nd,and 3rd floor buildings and without floating column building. Linear static and time
history analysis are carried out of all the four models .from linear static analysis compare all the of models result obtained in the form of seismic parameter such as time period, base shear ,storey displacement ,storey drift .and from time history analysis plot the response of all the models .modeling and analysis done by using sap 2000v17 software.
Keyword
:
with and without floating column building, linear static analysis, time history analysis, sap2000v17.I .Introduction
In recent times, multi-storey buildings in urban cities are required to have column free space due to shortage of space, population and also for aesthetic and functional requirements. For this buildings are provided with floating columns at one or more storey. These floating columns are highly disadvantageous in a building built in seismically active areas. The earthquake forces that are developed at different floor levels in a building need to be carried down along the height to the ground by the shortest path. Deviation or discontinuity in this load transfer path results in poor performance of the building. The behavior of a building during earthquakes depends critically on its overall shape, size and geometry, in addition to how the earthquake forces are carried to the ground. Many buildings with an open ground storey intended for parking collapsed or were severely damaged in Gujarat during the 2001 Bhuj earthquake.
Floating Column:
© 2016, IRJET | Impact Factor value: 4.45 | ISO 9001:2008 Certified Journal | Page 71 Fig no.1 floating column in building
II. Objectives of the present work
The main objectives of the proposed work are:1. To compare the modal response of all the models (Mode shapes, Time period, Frequency). 2. To compare the Base shear, Storey drift, Storey displacement and maximum displacement of each storey.
3. To plot the response of the structure for Time history analysis.
III. Model Description
A G+5 storied building with floating column and building without floating column located in zone v of India as per code IS 1893(Part1):2002 were taken for the investigation. In this study first a normal building without floating column is modeled as model1 .then there types of models namely 2,3and 4 are modeled. In model 2 floating column is located at 1st floor ,in model3 floating column located at 2nd floor and in model 4 floating column is
located at 3rd floor. Modeling and analysis was carried out in sap 2000v17.
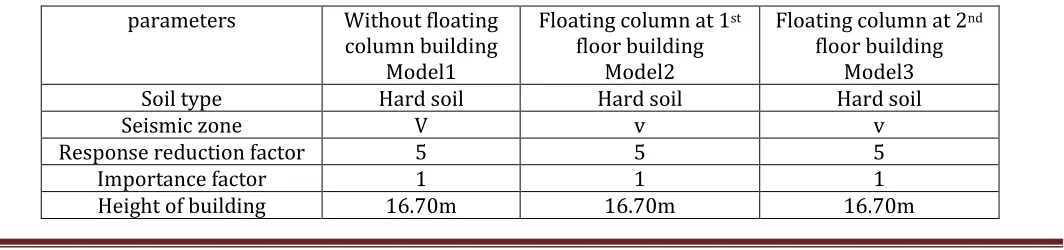
TABLE 1. BUILDING DATA
parameters Without floating column building
Model1
Floating column at 1st
floor building Model2
Floating column at 2nd
floor building Model3
Soil type Hard soil Hard soil Hard soil
Seismic zone V v v
Response reduction factor 5 5 5
Importance factor 1 1 1
[image:2.612.46.578.605.730.2]© 2016, IRJET | Impact Factor value: 4.45 | ISO 9001:2008 Certified Journal | Page 72
Floor to floor height 3.1m 3.1m 3.1m
Thickness of slab 125mm 125mm 125mm
Beam sizes 230×450mm 230×450mm 230×450mm
Column sizes
Ground to 2nd floor 230×450mm 230×450mm 230×450mm
3rd floor to 5th floor 230×380mm 230×380mm 230×380mm
Material properties M20 Grade of concrete
M20 Grade of concrete
M20 Grade of concrete
For analysis purpose four models considered namely as:
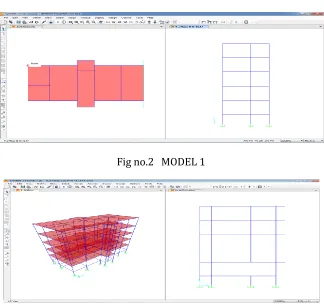
MODEL1- Building without floating column
MODEL2-Building in which floating column located at 1st floor.
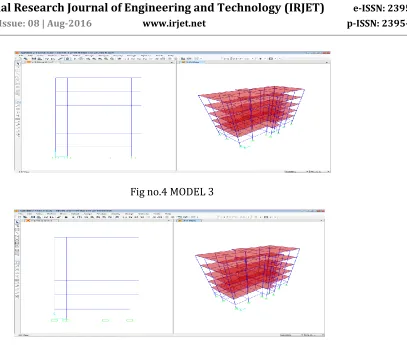
MODEL 3-Building in which floating column located at 2nd floor
[image:3.612.49.558.78.223.2]MODEL 4- Building in which floating column located at 3rd floor.
Fig no.2 MODEL 1
[image:3.612.145.469.386.694.2]© 2016, IRJET | Impact Factor value: 4.45 | ISO 9001:2008 Certified Journal | Page 73 Fig no.4 MODEL 3
Fig no.5 MODEL4
IV
.
Method Of Seismic Analysis
Seismic analysis is a subset of structural analysis and the calculation of the response of a building structure to earthquake .It is a part of the process of structural design ,earthquake engineering or structural assessment in region where earthquake is are prevalent.
A building has the potential to ‘wave back and forth during an earthquake (or even a severe wind storm ).This is ‘fundamental mode’ and is the lowest frequency of building response .most building ,however higher modes of response ,which are uniquely activated during earthquake.
1.Linear Static Analysis.
© 2016, IRJET | Impact Factor value: 4.45 | ISO 9001:2008 Certified Journal | Page 74
2. Time History Analysis
A linear time history analysis overcomes all the disadvantages of modal response spectrum analysis, provided non-linear behavior is not involved. This method requires greater computational efforts for calculating the response at discrete time. One interesting advantage of such procedure is that the relative signs of response qualities are preserved in the response histories. This is important when interaction effects are considered in design among stress resultants.
IV. Result and discussion
In present study, comparison of seismic response parameter such as time period ,base shear, storey displacement, storey drift and dynamic response are done by varying the location of floating column floor wise by using linear static and time history analysis. Result are compared in tabular and graphically for the analysis of building with and without floating column
.
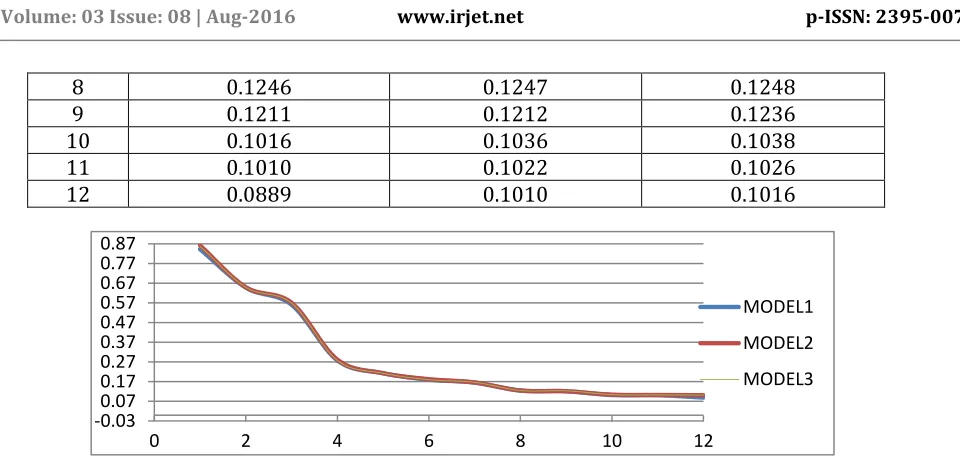
1.Time Periods in sec.
The time period of the structure for particular mode shape is the time required to complete the oscillation for corresponding mode shape. After giving a unit displacement to the structure and when releasing the displacement suddenly the structure moves in back and forth motion having some time period which is called as fundamental time period of the structure.
Time period determined for building with and without floating column for different cases are given in table 2.also variation in time period as shown in fig. 6 graphically. It has been found that 5-10% increase in time period of floating column building as compared to building without floating column.
Table no.2 Comparison of Time period in sec.
Mode RCC building without floating column
(Model1)
RCC building with floating column at 1st
floor (Model2)
RCC building with floating column at 2nd
floor (Model3)
1 0.8423 0.8614 0.8572
2 0.6475 0.6493 0.6487
3 0.5604 0.5706 0.5685
4 0.2776 0.2816 0.2774
5 0.2124 0.2128 0.2124
6 0.1799 0.1822 0.1798
© 2016, IRJET | Impact Factor value: 4.45 | ISO 9001:2008 Certified Journal | Page 75
8 0.1246 0.1247 0.1248
9 0.1211 0.1212 0.1236
10 0.1016 0.1036 0.1038
11 0.1010 0.1022 0.1026
[image:6.612.78.558.63.296.2]12 0.0889 0.1010 0.1016
Fig no .6 Comparative graph of Time Period in sec
2. Base Shear in KN
Base shear is the horizontal reaction at the base against horizontal earthquake load. This base shear is acting at the base or supports of the structure or wherever structure is fixed.
The variation in base shear due to different location of floating column floor wise are tabulated in table 3.also variation in base shear are shown through graph in fig no.7
The base shear is decreases by 5-10% for floating column building as compared to without floating column building.
Table no. 3. Comparison of Base Shear in KN
Model No. Base shear in KN
Model 1 631.704
Model 2 617.074
Model 3 619.687
Model 4 623.201
-0.030.07 0.17 0.27 0.37 0.47 0.57 0.67 0.77 0.87
0 2 4 6 8 10 12
© 2016, IRJET | Impact Factor value: 4.45 | ISO 9001:2008 Certified Journal | Page 76 Fig no.7. Comparison of Base Shear in KN
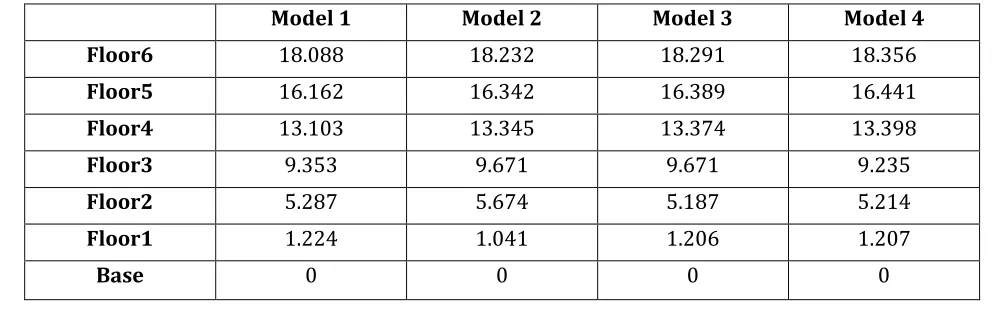
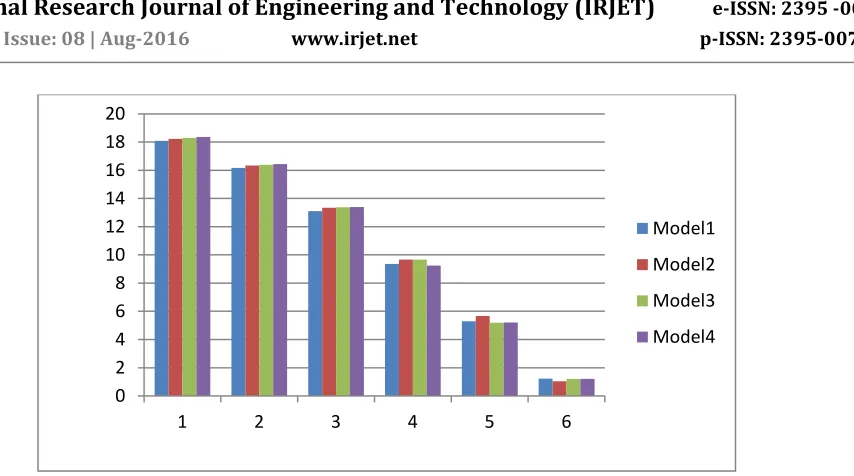
3. Storey Displacement
Storey displacement is the lateral movement of the structure caused by lateral force. The deflected shape of a structure is most important and most clearly visible point of comparison for any structure. No other parameter of comparison can give a better idea of behavior of the structure than comparison of storey displacement.
The results variation of storey displacement due to different location of floating column floor wise are tabulated in table no 4.also variation of storey displacement are shown through graph in fig no.8 .
The storey displacement increases 5-10% for floating column building as compared to building without floating column.
Table no 4.Comparision of Storey Displacement
Model 1 Model 2 Model 3 Model 4
Floor6 18.088 18.232 18.291 18.356
Floor5 16.162 16.342 16.389 16.441
Floor4 13.103 13.345 13.374 13.398
Floor3 9.353 9.671 9.671 9.235
Floor2 5.287 5.674 5.187 5.214
Floor1 1.224 1.041 1.206 1.207
Base 0 0 0 0
605 610 615 620 625 630 635
MODEL1 MODEL2 MODEL3 MODEL4
[image:7.612.55.558.556.716.2]© 2016, IRJET | Impact Factor value: 4.45 | ISO 9001:2008 Certified Journal | Page 77 Fig no.8 Comparison of Storey Displacement.
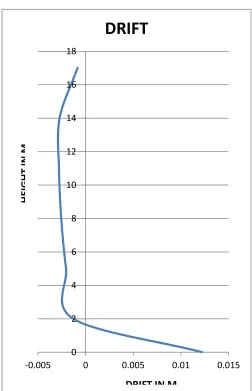
4. Storey Drift
Storey drift is the relative displacement of the floor. The results variation of storey drift due to different location of floating column floor wise are tabulated in table no 4.also variation of storey displacement are shown through graph in fig no.8 .
The storey drift increases 5-10% for floating column building as compared to building without floating column.
Table no.5 8 Comparison of Storey Drift
Height Model 1 Model 2 Model 3
17 -0.00085 -0.0009 -0.00082
14 -0.00273 -0.00294 -0.00271
11 -0.00279 -0.00276 -0.00306
8 -0.00255 -0.00251 -0.00254
5 -0.00205 -0.00202 -0.00202
2
-0.00128
-0.00126
-0.00127
0
0.012254
0.012388
0.012409
0 2 4 6 8 10 12 14 16 18 20
1 2 3 4 5 6
[image:8.612.88.523.482.650.2]© 2016, IRJET | Impact Factor value: 4.45 | ISO 9001:2008 Certified Journal | Page 78
Fig no.9 With floating column Storey Drift
0 2 4 6 8 10 12 14 16 18
-0.005 0 0.005 0.01 0.015
DRIFT
DRIFT IN M
HEI
G
HT
IN
[image:9.612.133.385.90.481.2]© 2016, IRJET | Impact Factor value: 4.45 | ISO 9001:2008 Certified Journal | Page 79
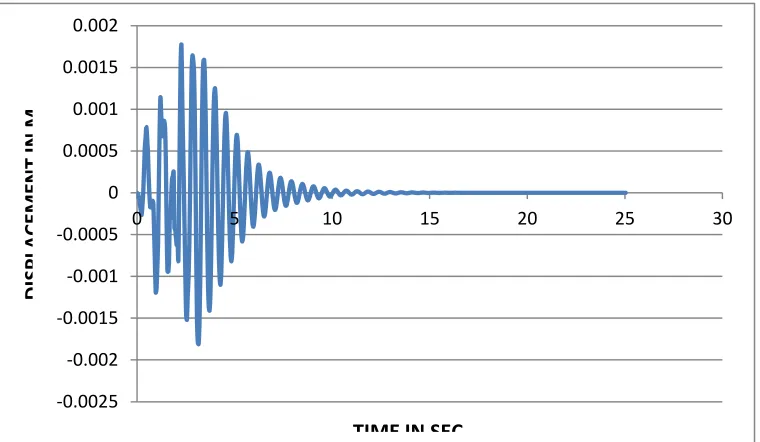
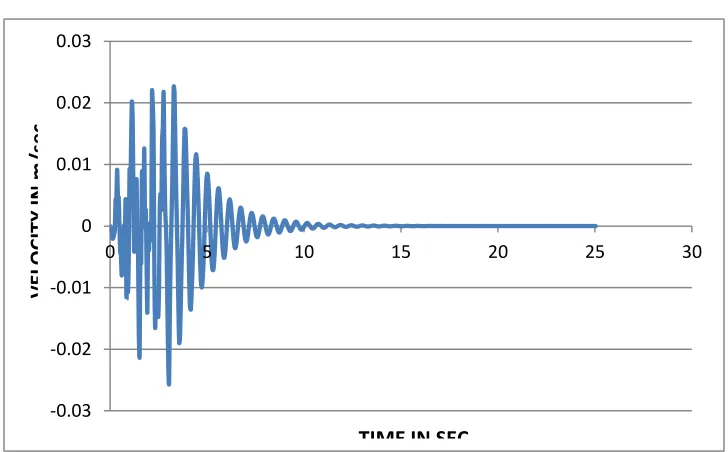
5. Plot of response of buildings for Time History analysis.
[image:10.612.135.515.158.379.2]Without floating column for Bhuj earthquake
Fig no. 11. Plot of graph Displacement Vs Time.
Fig no.12 Plot of graph Velocity Vs Time.
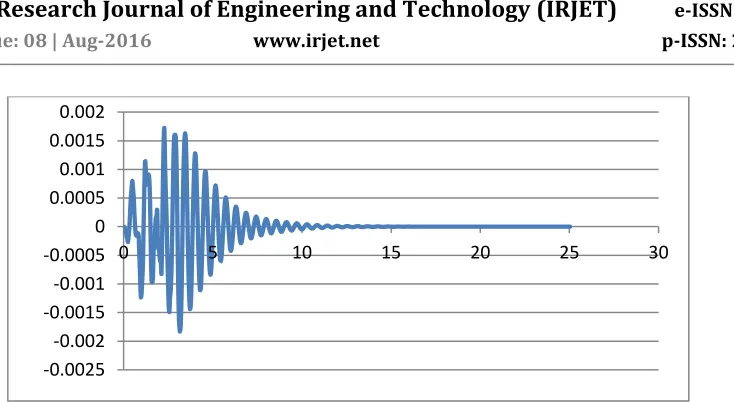
Floating column at 1st floor for bhuj earthquake.
-0.0025 -0.002 -0.0015 -0.001 -0.0005 0 0.0005 0.001 0.0015 0.002
0 5 10 15 20 25 30
TIME IN SEC
DI
SPLA
C
EM
EN
T I
N
M
-0.03 -0.02 -0.01 0 0.01 0.02 0.03
0 5 10 15 20 25 30
TIME IN SEC
V
ELOC
IT
Y
IN
m
/s
e
© 2016, IRJET | Impact Factor value: 4.45 | ISO 9001:2008 Certified Journal | Page 80
Fig no. 13. Plot of graph Displacement Vs Time.
Fig no.14. Plot of graph Velocity Vs Time
Floating column at 2nd floor
-0.0025 -0.002 -0.0015 -0.001 -0.0005 0 0.0005 0.001 0.0015 0.002
0 5 10 15 20 25 30
TIME IN SEC
DI
SPLA
C
EM
EN
T I
N
M
-0.03 -0.02 -0.01 0 0.01 0.02 0.03
0 5 10 15 20 25 30
TIME IN SEC
V
ELOC
IT
Y
IN
m
/s
e
© 2016, IRJET | Impact Factor value: 4.45 | ISO 9001:2008 Certified Journal | Page 81
Fig no. 15. Plot of graph Displacement Vs Time.
Fig no.16. Plot of graph Velocity Vs Time
V. Conclusion
Following are some of the conclusions which are drawn on the basis of this comparative study.
1 .It was observed that in building with floating column has more time period as compared to building without floating columns.
2. It was also observed that shifting of floating column towards top of the building results in increasing time period which is majorly because of decreased lateral stiffness of the building
3. It was observed that in building with floating column has less base shear as compared to building without floating column
4. It was also observed that shifting of floating column from 1st storey towards top storey of the building results in
increasing base shear.
5. It was observed that displacement floating column building is more as compared to without floating column building.
-0.0025 -0.002 -0.0015 -0.001 -0.0005 0 0.0005 0.001 0.0015 0.002
0 5 10 15 20 25 30
-0.03 -0.02 -0.01 0 0.01 0.02 0.03
© 2016, IRJET | Impact Factor value: 4.45 | ISO 9001:2008 Certified Journal | Page 82
6. It was also observed that shifting of floating column from 1st storey towards top storey of the building results in
increasing storey displacement.
7. It was observed that building with floating column has more storey drift as compared to building without floating column.
8. It was also observed that shifting of floating column from 1st storey towards top storey of the building results in
increasing storey drift.
9. From dynamic analysis it was observed that floating column at different location results into variation in dynamic response.
VI. References
1. Sukumar Behera (may2012)-Seismic analysis of multistory building with floating column , Department of Civil Engineering, National Institute of Technology Rourkela- 769008 MAY 2012.
2. Shrikanth .M.K (2014) –Seismic response of complex building with floating column and without floating column, International journal of Engineering Research-Online. A Peer Reviewed International Journal .Vol. 2., Issue.4, 2014 .ISSN: 2321-7758
3. T.Raja. Sekhar (2014) –Study of behavior of seismic analysis of multistory building with and without floating column. T. Raja Sekhar et al, Carib .j. SciTech, 2014, Vol2, 697-710.
4.A. P. Mundada (2014) – Comparative seismic analysis of multi storey building with and without floating column ,International Journal of Current Engineering and Technology, Vol.4, No.5 (Oct 2014)
5.Hardik Bhensdadia(2015)- Pushover analysis of Rc structure with floating column and soft storey in different earthquake zones , frameInternational Journal of Research in Engineering and Technology .Volume: 04 Issue: 04 | Apr-2015 .
© 2016, IRJET | Impact Factor value: 4.45 | ISO 9001:2008 Certified Journal | Page 83
7.Prerna Nautiyal(2014)-Seismic response evaluation of Rc frame building with floating column considering different soil conditions ,International Journal of Current Engineering and Technology, Vol.4, No.1.
8.Susanta Banerjee and Dr. Sanjaya K Patro(2014)-Estimation of park-Ang damage index for floating column building with infill wall., 55th AnnualTechnical, Journal of Orissa State Centre, Institute of Engineers(India),2014, pp.211-217.
9. Vijayanarayanan.R, Rupen Goswami and C.V.R.Murty-Special class of open ground storey RC buildings built in india unsafe during earthquakes 67Department of Civil Engineering, IIT-Madras. pp. 0147.
10. Agarwal Pankaj, Shrikhande Manish (2009),Earthquakeresistant design of structures PHI learning private limited, New Delhi.
11. Duggal S K (2010), “Earthquake Resistance Design of Structure”, Fourth Edition, Oxford University Press, New Delhi.
12. Criteria for Earthquake Resistant design of structures,Part1: General provisions and buildings, IS 1893:2002, Bureau of Indian Standards, New Delhi.
13. IS 875 (Part-I) Bureau of Indian Standards (1987) Code of Practice for Design Loads (Other than Earthquake) for Buildings and Structures: Dead Loads-Unit Weights of Building Materials and Stored Materials (Second Revision). UDC 624.042: 006.76.