© 2015, IRJET ISO 9001:2008 Certified Journal Page
739
Key Performance Indices for Sugar Industry
Balagounda S. Patil
1, Vinayak Kulkarni
2, Dr. M. M. Nadakatti
31
PG Student, Department of Mechanical Engineering, Gogte Institute of Technology, Belagavi, India
2
Asst. Professors, Department of Mechanical Engineering, Gogte Institute of Technology, Belagavi, India
3
professors, Department of Mechanical Engineering, Gogte Institute of Technology, Belagavi, India
---***---Abstract -
This project mainly deals with theapplication of the key performance indices. As a support
to the preventive maintenance in any of the industries,
the main purpose is to study the performance of
machine with respect to another machine, where in the
human intelligence is considered. The process of
preventive maintenance in any industry can be
maintained using the software packages like MATLAB
(Matrix Laboratory). The main purpose is to study
implementation of the key performance indices for
industries
Key Words:
KPI, MATLAB, Sugar Industry, Breakage
of Machine, Failure Mode and Effect Analysis .etc…
1.
INTRODUCTION
In order to run a manufacturing company, continuous development should be considered and must be applied in the regions of quality, safety and dependability. To accomplish the aim, one of the maximum significant processes which should be subjected for growth is maintenance process. Development of safety, reliability, quality and reliability in the plant is straight related to the maintenance scheme in the industry.
“KPI A set of quantifiable measures that a company or
industry uses to gauge or compare performance in terms of
meeting their strategic and operational goals. Key
performance indices vary between companies and
industries, depending on their priorities
or performance criteria.[1]”
2.
METHODOLOGY
2.1 Survey of Industries 1
Ugar Sugar Works Ltd. Ugar Khurd:As there are various sugar industrial plants in our country at both medium and large scales & there is a good commercial effect to the nation. There are few difficulties that may cause effect in the performance of the sugar industry. This loss can be prevented by proper performance and maintenance procedures.
Our main aim is to solve the problems of the performance. As mentioned earlier of the failure mode and effect analysis (FMEA) method and it is consider as a tool for maintenance or performance and to imply this in the sugar industry the GUI of industry is predicted by using the MATLAB software. As consider some of the machine where the stoppages or breakages are taking place and it directly affect to the performance are mentioned:
2.2 MAT-LAB 2
© 2015, IRJET ISO 9001:2008 Certified Journal Page
740
MATLAB is broadly used in universities and colleges inpreliminary & advanced courses in science, mathematics and especially in engineering. In industry the software is used in development, research and design. The standard MATLAB program has functions that can be used to solve common difficulties. In addition, MATLAB has elective toolboxes that are a gathering of specified programs designed to solve particular types of problems.
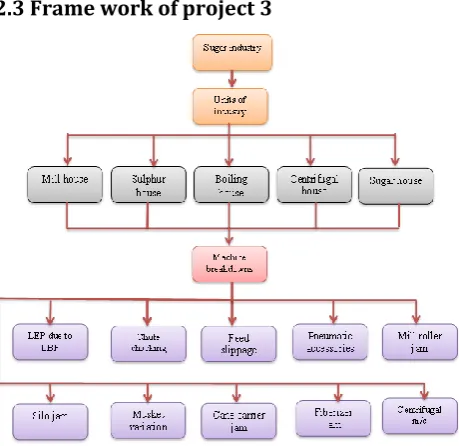
[image:2.595.39.269.256.479.2]2.3 Frame work of project 3
Fig no 4.12 framework of the project in sugar industry
2.4 Failure Mode & Effect Analysis (FMEA) 4
FMEA is an analytical paper test (technique) that associates the technology and knowledge of people in distinguishing predictable failure modes of a process or product and planning for its removal.“It is a before-the-event action demanding a group effort to simply & cheaply alleviate changes in production & design”.
The functions of FMEA
• Identify & evaluate the potential failure of a
process or product & its result
• To minimize or remove the chance of potential
failures and Recognize the actions
• Document the process.
There are many types of FMEA: process, design, environment, concept, equipment, system, service FMEA, and others. However, for all intents & purposes, all of the types can be broadly categorized under either process or design. For occurrence, service, ecological & equipment FMEA are just somewhat adapted forms of process & system is a grouping of design and process FMEA.
General FMEA Process description:
Process Potential failure
mode
Potential effect of
failure
Potential cause of
failure KPI Avg
KPI
LEP due to LBP
Max moisture in fuel and
fuel quantity
Process hamper and
it effects to the turbine
Due to variations in turbine and boiling
will be reduced
6.3 3
Mill roller jamming
Improper mixture of bagasse and water
supply to roller
The jamming of bagasse has
to be reduced
Due to overload supply of bagasse
6.4 5
Musket variation
Damage in rotating
part or variation
in speed
m/c stoppage
and variation occurs in compressor
Due to variation in
Continues supply of cooling
water
6.2 2
Centrifugal m/c
Breakage of bearing
Stoppage of m/c
Breakage of ball due to
Less lubrication
supply
6.1 1
Cane carrier jam
Due to breakage of lifting blade
The over flow of moisture
bagasse
Due to bridging action of cane in the
carrier
6.3 4
© 2015, IRJET ISO 9001:2008 Certified Journal Page
741
3. RESULT AND DISCUSSION
3.1 The stoppage or breakage priority analysis
based on a process with respect to interlinked
process.
NOTE: By taking in consideration, the maximum
priority of KPI is set to 5 and the least priority is set to
1. Process LE P d u e to LB P M ill r o lle r ja mmi n g M u sk et va ri at io n Ce n tr if u ga l m/ c Ca n e ca rr ie r ja m av g kp i K P I
LEP due to LBP 5 4 3 3 3 3.6 5
Mill roller jamming 4 5 1 2 4 3.2 4
Musket variation 2 1 5 4 2 2.8 2
Centrifugal m/c 3 2 4 5 1 3 3
Cane carrier jam 1 3 2 1 5 2.4 1
Table no 3.1 KPI priority analysis table
3.2 A reason for FMEA depends on stoppage
problems, with respect to their priority no
.
FMEA reasons for LEP due to LBP
Process L E P due to L B P M il l r ol le r ja mmin g M us k et va ria tion C en tr ifuga l m/ c C an e ca rr ie r ja m avg k pi KPI
LEP due to LBP 5 4 2 3 1 3.6 5
i. LEP due to LBP with respect to mill roller jam the
priority will be 4
Reason Due to low boiling pressure it affects to
the separation of raw juice and bagasse
ii. LEP due to LBP with respect to musket variation
the priority will be 2
Reason due to variation in boiling pressure the
musket variation will be taking place
iii. LEP due to LBP with respect to centrifugal
machine the priority will be 3
Reason it directly affect to purification or
filtration of a raw sugar
iv. LEP due to LBP with respect to cane carrier jam
the priority will be 1
Reasonreduce the supply of sugar cane
Conclusion: the average key performance index for LEP due to LBP in sugar industry was calculated to be 3.6 but the value of KPI was rounded out to be 10 by considering other machines for calculations
FMEA Reasons for mill roller jam
Process L E P due to L B P M il l r ol le r ja mmin g M us k et va ria tion C en tr ifuga l m/ c C an e ca rr ie r ja m avg k pi KPI
Mill roller jam 4 5 1 2 3 3.2 4
i. Mill roller jam with respect to LEP due to LBP the
priority will be 4
Reason because as the less supply of bagasse
from mill roller tends to low boiling as well as low exhausts pressure
ii. Mill roller jam with respect to musket variation
the priority will be 1
Reason because due to shortage of sugar cane
juice
iii. Mill roller jam with respect to centrifugal machine
the priority will be 2
Reason because due to shortage raw sugar to
the m/c it will affect to the purification of sugar
iv. Mill roller jam with respect to cane carrier jam the
© 2015, IRJET ISO 9001:2008 Certified Journal Page
742
Reason because the supply of sugar cane has to
be stopped
Conclusion: the average key performance index for mill roller jam in sugar industry was calculated to be 3.2 but the value of KPI was rounded out to be 4 by considering other machines for calculations
FMEA Reasons for musket variation
Process
L
E
P
due
to
L
B
P
M
il
l r
ol
le
r
ja
mmin
g
M
us
k
et
va
ria
tion
C
en
tr
ifuga
l m/
c
C
an
e
ca
rr
ie
r
ja
m
avg k
pi
KPI
Musket
variation 3 1 5 4 2 2.8 2
i. Musket variation with respect to LEP due to LBP
the priority will be 3
Reason because due to low boiling pressure the
variations are taking place
ii. Musket variation with respect to mill roller jam
the priority will be 1
Reason because the juice level reduces from mill
roller
iii. Musket variation with respect to centrifugal
machine the priority will be 4
Reason because due to variation in musket the
large amount of molasses obtained
iv. Musket variation with respect to cane carrier jam
the priority will be 2
Reason because due to over load supply of the
sugar cane
Conclusion: the average key performance index for musket variation in sugar industry was calculated to be 6.1 but the value of KPI was rounded out to be 7 by considering other machines for calculations
FMEA Reasons for centrifugal machine
Process
L
E
P
due
to
L
B
P
M
il
l r
ol
le
r
ja
mmin
g
M
us
k
et
va
ria
tion
C
en
tr
ifuga
l
m/
c
C
an
e
ca
rr
ie
r
ja
m
avg k
pi
KPI
Centrifugal
machine 3 2 4 5 1 3 3
i. Centrifugal machine with respect to LEP due to LBP
the priority will be 3
Reason because need to stop the supply of steam
vapor
ii. Centrifugal machine with respect to mill roller jam
the priority will be 2
Reason because the reduction in removing juice
from moisture bagasse
iii. Centrifugal machine with respect to musket
variation the priority will be 4
Reason because the large amount of molasses are
obtained due to this musket variation is taking place
iv. Centrifugal machine with respect to cane carrier
jam the priority will be 1
Reason because the crushing of sugarcane has to
be reduces
Conclusion: the average key performance index for centrifugal machine in sugar industry was calculated to be 3 but the value of KPI was rounded out to be 3 by considering other machines for calculations
FMEA Reasons for cane carrier jam
Process
L
E
P
due
to
L
B
P
M
il
l r
ol
le
r
ja
mmin
g
M
us
k
et
va
ria
tion
C
en
tr
ifuga
l
m/
c
C
an
e
ca
rr
ie
r
ja
m
avg k
pi
KPI
© 2015, IRJET ISO 9001:2008 Certified Journal Page
743
i. Cane carrier jam with respect to LEP due to LBP
the priority will be 3
Reason because it reduces the supply of bagasse
to the boiler
ii. Cane carrier jam with respect to mill roller jam the
priority will be 4
Reason because the reduction in removing juice
from moisture bagasse
iii. Cane carrier jam with respect to musket variation
the priority will be 2
Reason because reduction in syrup level
iv. Cane carrier jam with respect to centrifugal
machine the priority will be 1
Reason because it reduce the purification of raw
sugar
Conclusion: the average key performance index for cane carrier jam in sugar industry was calculated machines for calculations to be 2.4 but the value of KPI was rounded out to be 1 by considering other
3. CONCLUSION:
The Key Performance Index was given the individual machine and then were stimulated on MATLAB with quick references for maintenance management.
The Key Performance Index which are assigned to individual machine were validated with maintenance people of that sugar industry minor changes were made and Key Performance Index were recognized and hence it was validated with less modification.
Also it helps the maintenance department of the company to plan the maintenance schedule according to criticality of the machine which has been assignment with respective Key Performance Index.
REFERENCES
1. http://cenew.idnet.net/pdf/kpizone/KPI_Man agement_Tool.pdf. Key Performance
Indicators, Management Tool a simple to use on-line performance measurement collection and reporting system.
2. “R. Rodriguez Rodriguez, J. J. Alfaro Saiz, and A. Ortiz Bas, ―Quantitative relationships
between key performance indices for
supporting decision-making processes‖,
Computers in Industry, vol. 60, no. 2, pp. 104–113, 2009.
3. Berges, L., Galar, D. and Stenström, C. (2013) ‘Qualitative and quantitative aspects of
maintenance performance measurement: a
data fusion approach’, Int. J. Strategic
Engineering Asset Management, Vol. 1, No. 3, pp.238–252
4. Staniškis, J., Arbačiauskas, V. Sustainability
Performance indices for Industrial Enterprise
Management. Environmental Research, Engineering and Management = Aplinkos tyrimai, inžinerija ir vadyba. 2009. Vol. 48, No. 2. pp. 42-50. Kaunas, Technologija. ISSN 1392-1679.
5. Katerina Konsta1 & Evi Plomaritou2, Key Performance Indicators (Key performance
indices) and Shipping Companies Performance
Evaluation: The Case of Greek Tanker Shipping
Companies Doctorate Researcher, University of
Plymouth, UK, European University, Geneva,
Switzerland. Received: December 11, 2011