A Study of Validity and Reliability on the
Instructional Capacity Scale
Mehmet Tufan Yalçın1,*, Figen Ereş2
1Ankara Provincial Directorate of National Education, Turkey 2Gazi Faculty of Education, Gazi University, Turkey
Copyright©2018 by authors, all rights reserved. Authors agree that this article remains permanently open access under the terms of the Creative Commons Attribution License 4.0 International License
Abstract
The aim of this study is to develop a valid and reliable measurement tool that can determine the instructional capacity, according to teacher opinions. In the academic year of 2016-2017, 1011 teachers working in the public high schools and vocational technical schools in Ankara participated in the study. The total number of items on the scale was 43. The scale is arranged in 5-point likert type scale format, with options ranging from 5 (Extremely) to 1 (Not at all). As a result of the analysis made, it consists of 6 factors. Sub-dimensions of the prepared scale are instructional management practices, teacher quality, curriculum-material quality and quantity, instructional climate, availability of learners to learn and financial resources. According to the findings, internal consistency reliability coefficients of scale factors were found high. Validity and reliability were provided by using descriptive factor analysis followed by confirmatory factor analysis. The developed scale can be used to measure instructional capacity.Keywords
Instructional Capacity, Secondary School, Teacher, Validity, Reliability1. Introduction
It can be argued that increasing quality and strengthening learning in education is at the center of the post-2015 universal development framework. The United Nations Educational, Scientific and Cultural Organization (UNESCO) has six objectives set on an international level for children, young people and adults to be realized by 2015. The sixth of these objectives was defined as "the development of all aspects of educational qualifications and the excellence of these qualities in order to achieve acceptable and measurable outcomes, in particular literacy, numeracy and skills necessary for life [50]". Seeking of educational qualifications at international level is also seen in Turkey. Despite these reform efforts aimed at ensuring
quality in education, according to the report of UNESCO 11 EFA Global Education Monitoring Report [49], it is emphasized that the low quality of education hinders learning even for the ones who attend school. According to the report, one-third of the primary school students can not learn basic skills when they go to school. The existing structure in Turkey can not provide the 17% of the children with learning basic mathematics. The results of Turkey's PISA in 2015 and TIMMS in 2011 also support these findings. This can be interpreted as the fact that the reforms carried out have not had much effect on the quality of education. For this reason, the educational capacity of the high schools in Turkey needs to be examined for the development of the quality of service.
Instructional capacity is the ability that schools have for ensuring learning for all students and improving instruction [46]. Newmann, King, and Youngs [34] have expressed the instructional capacity as the collective strength of all staff in school in order to increase student achievement. Crawford [10] defines instructional capacity as the development of understanding, experience and skills to achieve the specified curricular achievements and school goals at the expected level. More recently, instructional capacity has been regarded as an instrumental variable between the stages of development of student outputs at the national level [8, 12, 45]. Spillane and Louis [42] stated that the adoption of a pedagogical capacity model, which characterizes the key elements of instruction and the interaction between these elements, would be more useful for reform efforts to to resolve the relationship between school development efforts and classroom teaching. Sayre [41] emphasizes that the first goal of developing instructional capacity is to increase the success of the students' classes. In this context, it can be said that there is a positive relation between educational capacity and student achievement.
the class level by the knowledge, skills and preparation of the teachers, the motivation of the learners and the ready availability for learning, the curriculum materials for teachers and students, the quality and quantity of school personnel, the quality and number of social relations, material resources and school and district resources. Cohen and Ball [7] have taken the interaction between teachers, students, and educational materials at the center of instructional capacities and have combined these three elements in the classroom to form the teaching unit. Reviewing the literature on the components of instructional capacities, it appears that there is an emphasize on qualifications and quantities of instructional resources, including the intellectual knowledge, skills and abilities of teachers and other employees, including staff level, instructional time and class size and on social organisation of instruction or instructional culture [8, 12, 35, 45].
Another factor influencing the construction of instructional capacity is school management and school leaders. Four resources are needed for a school to build instructional capacity, which include instructional information including content, pedagogy and student knowledge; instructional tools and materials including curriculum, instructional materials and evaluation; educational relationships that characterize mutual respect and trust; organizational structure that can be interpreted as promoting the use of various instructional resources such as formal instructional leadership roles and co-learning time for teachers [22]. Massell and Goertz [30] state that school principals can improve their schooling with the help of three basic strategies that involve increasing their professional knowledge and skills in their schools, setting up and strengthening instructional guidance, and using data in instructional development efforts.
One of the important factors affecting quality in education is the provision of financial resources. The resources that have been allocated to education in recent years are increasing rapidly in almost every country of the world, but the increased resources do not lead to meaningful changes and transformations in the training output at the same rate. The main reason for this is that resources are not used efficiently by shifting them to the areas with the highest marginal productivity [1] There are a number of studies in micro- and macro-level that find the weak link between the quality of education and the resources allocated to education [18, 19, 31]. However, there are many studies [3, 14, 39] that measure the effects of educational input on student achievement and find positive relationships.
Although there have been numerous reform initiatives towards public high schools in Turkey over the last sixty years, these high schools continue to remain a permanent concern in educational research and practice [15]. When the studies on the determination of the instructional capacity which is seen as an important factor in the achievement of the reforms are examined; although the
importance of formation of the instructional capacity [21, 46, 47], on which the qualitative studies are predominant, on educational reforms and the decision-making processes required to be achieved is intensely emphasized in the literature [6, 25, 46] it seems that empirical studies on the present situation of the instructional capacity at the schools, and in determining the relationship between instructional capacity and student achievement are limited. However, there is no national or international scale to measure instructional capacity in schools. The purpose of this study, in this context, is to develop a valid and reliable measurement tool that can determine the instructional capacity of secondary schools according to the teachers' views. Thus, the developed scale will help determine the instructional capacity of secondary schools with teacher views.
2. Materials and Methods
2.1. Population and Sample
The population of the study consisted of the teachers who worked in official, common and vocational technical
high schools in the provinces of Altındağ, Çankaya, Gölbaşı, Keçiören, Mamak and Yenimahalle in the city of Ankara in 2016-2017 academic year. The current list of the existing secondary schools in these six provinces was reached through the school list page on the website of the Ministry of National Education Information Systems [32]. Within this scope, it was determined that there were 170 secondary schools in the population of the study. Teachers from all branches working in secondary schools were included in the study.
Table 1. Population and Sample Size
Provinces
Population Sample School Teacher School Teacher A B A B A B A B Altındağ 15 9 1.098 422 6 7 141 148 Çankaya 19 31 1.294 1.574 1 2 37 60
Gölbaşı 7 4 293 201 3 1 56 17 Keçiören 12 15 1.193 792 2 1 61 32 Mamak 13 14 1.023 643 4 7 129 149 Yenimahalle 14 17 1.404 1.021 5 2 148 67
Total 80 90 6.305 4.653 21 20 572 473 Note. A= Vocational Secondary Schools B= Common Secondary Schools
While determining the sample, the total number of schools from each kind was determined as 30 [26] in terms of the normal distribution of the data, by using the purposeful sampling method. In this context, the sample number of common high schools and of vocational and technical high schools are 41 schools in total. The number of common high school teachers in the sample is 473, and the number of vocational and technical high school teachers is 572. A total of 1045 teachers were reached in the study, but when the data were analyzed in terms of lost value, extreme value and normality, a total of 1011 data were determined to be suitable for analysis.
When the relevant literature is examined, it seems that there is no consensus on the size of the sample required for validity studies on scales [36]. It is stated in some sources [40] that a sample size of 100 persons is sufficient to reveal the factor structure of the scale, whereas in other sources [38] the sample size should be between 100-250. In this study, it was found that the number of participants from which data gathered in order to be able to carry out factor analysis of the scale met the absolute criterion defined, and the relative criterion, in which the number of items sholud be at least twice, specified by Kline [23]. For the collected data, factor structure and construct validity of the scale were examined first, then item analysis and reliability value were calculated.
The study was conducted on different sample groups consisting of teachers working in common high schools and vocational technical high schools in 2016-2017 Academic Year. The reason for using different samples is that the factor structure, validity and reliability obtained on small samples compared to the others are tested in a wider sample. First purposeful sampling method was used and then main sample was determined among teachers selected by using stratified sampling method.
2.2. Development of the Scale
In the process of developing the Instructional Capacity Scale, researches examining the educational capacities of schools were surveyed while analyzing the literature and constructing an item pool. In this respect, “The Principal Instructional Management Rating Scale (PIMRS)” [16, 17], "Instructional Leadership Scale (ILS)" [43] and the scales used in the PISA and TIMMS surveys were utilized. On the other hand, measurement tools used in research to determine the instructional capacity of various schools have also been evaluated in the study [6, 21, 25, 33, 46, 47]. On the basis of these studies, behaviors to determine the instructional capacity of schools are discussed in terms of the process. In this context, the scale consists of a total of six dimensions: (a) instructional management practices, (b) teacher quality, (c) curriculum-material quality and quantity, (d) instructional climate, (e) students’ learning readiness, and (f) financial resources. 52 items were included in the prepared draft scale. Draft scale was
prepared by making a literature review. Later, the draft form of the scale was first presented to the opinions of 10 experts. 10 experts with at least doctoral education in the field of education management examined the draft scale and recommended the necessary changes. From the 75 items, the experts identified the ones that evaluate similar areas and the ones which are hard to understand and made suggestions for these items. After this study, 23 items were removed such as “This school has enough financial resources to carry out the education reforms that are required.” and “The technology infrastructure of this school offers opportunities for technological applications in education.” and some items were rearranged. Based on the information obtained from the expert opinion, a 52-item scale was created after the necessary corrections were made. The scale items were arranged in a 5-point likert type scale format. Degrees of agreement on the items in the scale are: Extremely (5), Very (4), Moderately (3), Slightly (2) and Not at all (1). The research data were collected during the spring term of 2016-2017.
2.3. Analysis Techniques Used
The draft scale was applied to a total of 1011 teachers; to 486 of whom for exploratory factor analysis and to 525 of whom for confirmatory factor analysis. Cronbach Alfa
(α) to measure the reliability of the developed scale;
Kaiser-Meyer-Olkin (KMO) and Barlett's Test of Sphericity (SAS) to determine the suitability of the sample, the suitability and factorability of the data set for the analysis of key components; item total test correlations for testing the validity of the item; exploratory factor analysis to ensure structure validity; and confirmatory factor analysis [48] to test whether the construct obtained by exploratory factor analysis yielded the same results in similar groups were used.
3. Findings
3.1. Exploratory Factor Analysis
Bartlett test was χ2 (52, N = 486) = 18908.52. After the reliability analysis performed before the exploratory factor analysis, the Cronbach Alpha value of 52 items was found to be 97. The fact that this coefficient for the scale is .70 or above is considered sufficient in terms of reliability [9]. In addition, item-total statistics were examined before factor analysis. Truxillo [48] stated that the fact that the total value of an item is below 0.30 indicates that the substance does not conform to the scale structure. In this context, when item-total statistics are examined, it is seen that there is no item containing value below the specified criteria.
In the exploratory factor analysis, an action is taken to find the factor based on the relations between the variables [13]. KMO and Barlett tests and varimax rotation were applied before the exploratory factor analysis. The KMO test is used to determine the suitability of the sample, the Barlett test is used to determine whether the data come from a highly variable normal distribution. As a result of the KMO and Barlett tests, the Kaiser-Meyer-Olkin (KMO) coefficient was found to be 0.97. The KMO coefficient varies from 0 to 1 and 0.50 for factor analysis is appropriate [37]. The value of KMO is evaluated as moderate between 0.5-0.7, good between 0.7-0.8, very good between 0.8-0.9, excellent above 0.9 [51]. The KMO coefficient obtained in this case is 0.97, an excellent value. In addition, Barlett's test was found as significant (p <0.001). The fact that the KMO coefficient (0.97) is excellent value and the the Bartlett test (p <0.001) is significant indicate that the dataset is suitable for analysis of key components, its factorability and sample size are excellent [2].
After the exploratory factor analysis performed, it was seen that the items gathered around six factors. The total variance explanatory rate of the six factors whose eigenvalue are above 1 is 66%. The data about the total explained variance are presented in Table 2.
After deciding on the six-factor scale structure, the
factor loading values of each item in the scale were examined. It is preferred that the factor load value is 0.45 or higher, but this limit can be lowered to 0.30 for some items [27]. In addition, it is necessary that the items have a high loading value in one factor and a low loading value in the other factors. It has been noted that the difference between the higher two loading values is at least 0.10 [24]. As a result of the analyzes made, items with factor loading value of less than 0.45 and those with factor loading value difference of less than 0.10 in both factors were excluded. After each item was removed, the item factor loads were re-examined. On the other hand, although 26th item has .385 loading value, it has been decided to take part in the curriculum-material quality and quantity dimension on the scale because of being the opinions of teachers on the teaching program based on the literature, and 32nd item has .444 loading value but it has been decided to include this item in terms of instructional climate, because it is related to measuring teachers' perceptions of establishing relationships based on respect and trust. This is supported by the significance of the t value in the confirmatory factor analysis and the load values generated by the promax method of the oblique rotation methods. In this context, it is necessary to take out 9 items from the scale as a result of the analysis.
As a result, the scale was formed in a structure of six factors. The first factor, instructional management practices, has 12 items; second factor, students’ learning readiness, has 6 items; third factor, financial resources, has 6 items; fourth factor, teacher quality, has 8 items; fifth factor, instructional climate, has 6 items; and sixth factor, curriculum-material quality and quantity, has 5 items. The internal reliability of each factor (Cronbach Alfa) was calculated. The first factor was .94, the second factor was .94, the third factor was .94, the fourth factor was .87, the fifth factor was .89, and the sixth factor was .84.
Table 2. Total Variance Explained
Eigenvalues Sums of Squared Factor Loadings Factors Total Variance % Cumulative % Total Variance % Cumulative %
1 18,714 43,521 43,521 7,433 17,287 17,287
2 3,599 8,370 51,891 5,228 12,157 29,444
3 2,122 4,934 56,825 4,964 11,545 40,989
4 1,799 4,184 61,009 4,853 11,287 52,276
5 1,204 2,799 63,808 3,661 8,515 60,791
3.2. Confirmatory Factor Analysis
In confirmatory factor analysis, the previously established hypothesis or theory of the relationship between variables is tested [4]. The validity of the scale obtained by exploratory factor analysis was tested by confirmatory factor analysis. According to the exploratory factor analysis, the scale shows 43 items and six factors. After identifying the factors by exploratory factor analysis, the appropriateness of the identified factor structures was tested by confirmatory factor analysis. The purpose of confirmatory factor analysis is to verify the previously determined structure. Based on the results of the exploratory factor analysis, the structure of 6 dimensions and 43 items was tested by confirmatory factor analysis. Accordingly, the final application process was implemented and the responses of 525 participants, ten times the number of items, were taken into consideration. The research data were collected during the spring term of 2016-2017.
Prior to the confirmatory factor analysis, Kaiser-Meyer-Olkin (KMO) and Barlett's Test of Sphericity were applied. As a result of the review, KMO value was 0.96 and the Barlett test was significant (p <0.001). These values show that the data are suitable for factor analysis. After the reliability analysis performed before the confirmatory factor analysis, the Cronbach Alpha value of 43 items was calculated 0.96. In addition, item-total statistics were examined before factor analysis. It has been checked whether item-total statistics is less than 0.30 and it is seen that no value less than the value stated in any item is found.
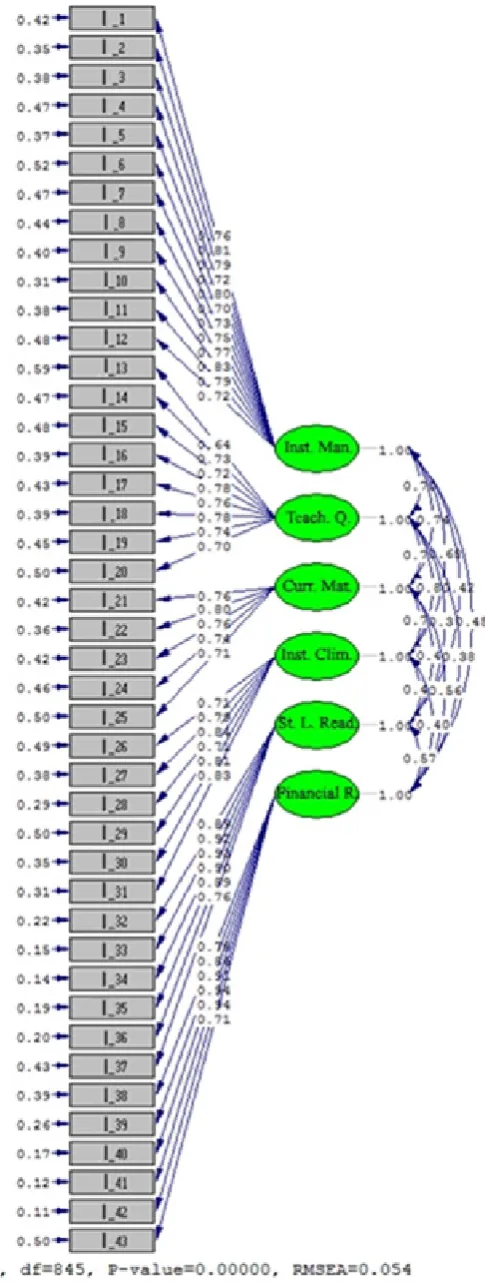
In this context, the initially controlled value was the significance level of the t value of items (observed variables). Accordingly, the parameter estimates were found to be significant at the .01 level as the t values exceeded 2.56. On the other hand, the p-value of the path diagram (Figure 1) obtained as a result of first-level confirmatory factor analysis is significant at .01. According to [20], it is stated that, while p-value should not be significant, it is normal for the value of the sample
to be significant in cases arising from the size of the sample. For this reason, other fit indices are evaluated and the results are presented in Table 3.
The second fit indice taken into account for compatibility is the ratio of chi-square/df. Since chi-square is not a statistic that is evaluated on its own, it was evaluated by being compared with the degree of freedom (df) and this ratio was calculated as 2.27. The value of chi-square/df less than 3 means excellent fit, while the value of chi-square/df less than 5 is moderate fit [5]. It has been understood from the obtained values that chi-square/df corresponds to perfect fit. The second value for the model fit has been The Root Mean Square Error of Approximation (RMSEA). This index is between 0 and 1 and 0 indicates perfect fit, indicating that there is no difference between the population and sample covariances [11]. RMSEA value found in the analysis was .054. This value, which is between .05 and .08, indicates a good fit.
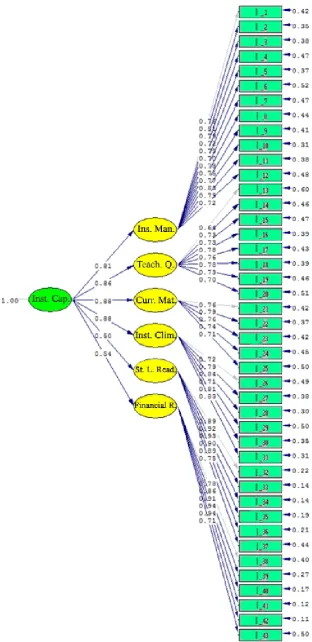
However, for the model of fit, the Goodness of Fit Index (GFI), also known as the sample variance, which indicates the measure of the covariance matrix in the sample, and the Adjusted Goodness of Fit Index (AGFI), which is an improved type of GFI for the number of parameter estimates, were examined. These values give more robust values in large samples [11]. GFI and AGFI values range from 0 to 1, with a perfect fit of over .95 and a good fit of .90. GFI and AGFI values were found as .84 and .82 respectively. Accordingly, it is understood that GFI and AGFI have poor fit. In addition, the standardized RMR fit indice was calculated as .058, which can be said to be in good fit as it is below .08. On the other side, the NFI and CFI values were calculated as .98. When these values are taken into consideration, the fact that the two indexes are above .95 indicates perfect fit. It can be said that the model is confirmed in accordance with the data listed above. Second-level path analysis as a result of confirmatory factor analysis is given in Fig. 2. In addition, the CFA results for the second level are given in Table 3. When the fit indices according to the results in Table 3 are examined, it can be said that the model is confirmed. Table 3. Confirmatory Factor Analysis Results for ICS
Factor Structure X2 X2/sd RMSEA GFI AGFI CFI NFI NNFI RMR SRMR
6 Dimensions 43 Items:
First Level CFA 2149.40 2.27 .054 .84 .82 .99 .98 .98 .043 .045 6 Dimensions
43 Items:
The internal reliability (Cronbach Alfa) of each factor was calculated after the analysis made. The first factor was .94, the second factor was .90, the third factor was .95, the fourth factor was .94, the fifth factor was .90, and the sixth factor was .87.
4. Conclusions
In this study, it was intended to develop a valid and reliable measurement tool which can determine the instructional capacity of high schools by teacher opinions. When the reform studies carried out by the countries are examined, the studies they implement for the improvement of the instructional capacity are remarkable. Corcoran and Goertz [8] indicate that the lack of identification of instructional capacity in schools negatively affects educational policies and reforms. In this context, this study is thought to contribute to the reforms to be made and the policy to be determined with the understanding of the existing instructional capacity in the schools.
This scale, being prepared to measure the instructional capacity of high schools, is considered as important because it will provide useful data to academicians and competent authorities in determining the instructional capacity of schools. Another contribution is that, as it has been found after a literature survey that there is no scale development study to evaluate the instructional capacity of schools, this scale can fulfil such a need.
The results of the analysis revealed that the scale had six factors and the total number of items was 43. Sub-dimensions of the scale are instructional management practices, teacher quality, curriculum-material quality and quantity, instructional climate, students’ learning readiness and financial resources. It is possible to say based on the findings that the Instructional Capacity Scale of High Schools is a reliable and valid measuring instrument. The reliability of the scale was tested using the internal consistency reliability coefficient. Internal consistency reliability coefficients of scale factors were 94; 90; 95; 94; 90 and 87, respectively and these were considered high. The validity and reliability of the scale were provided by using exploratory factor analysis followed by confirmatory factor analysis. Findings about the validity and reliability of the scale indicate that the scale can be used to determine the instructional capacity of high schools based on the teachers’ views (Appendix 1).
Appendix 1
Instructional Capacity Scale
ITEMS Not at all Slightly Moderately Very Extremely Degrees of Agreement 1. School management sets instructional goals with us to increase student achievement. ① ② ③ ④ ⑤ 2. School management conducts the professional development studies of teachers according to the
instructional needs of our school. ① ② ③ ④ ⑤
3. School management obtains information about teachers' knowledge, skills and competence. ① ② ③ ④ ⑤ 4. School management monitors teachers' instructional practices in the classroom. ① ② ③ ④ ⑤ 5. School management implements practices to raise expectations of families about academic
achievement levels of students. ① ② ③ ④ ⑤
6. School management creates high expectations for success in students. ① ② ③ ④ ⑤ 7. School management brings good examples of other schools related to academic studies to the
school. ① ② ③ ④ ⑤
8. The school administration ensures that the education and instruction areas in the school are ready
for use every day. ① ② ③ ④ ⑤
9. School management prepares areas for the students to study. ① ② ③ ④ ⑤ 10. School management provides feedback related the lessons by meeting with the teachers. ① ② ③ ④ ⑤ 11. School management monitors the academic development of students. ① ② ③ ④ ⑤ 12. School management takes precautions against situations (discipline problem, noise, etc.) that will
disrupt the instruction time in the school. ① ② ③ ④ ⑤
13. The teachers in this school respond to student questions about the subjects taught in the lessons. ① ② ③ ④ ⑤ 14. Teachers at this school use instructional strategies that enable students to build their own
knowledge. ① ② ③ ④ ⑤
15. Teachers in this school use strategies to cope with unwanted student behavior. ① ② ③ ④ ⑤ 16. Teachers in this school get in the class as being prepared for the lesson. ① ② ③ ④ ⑤ 17. Teachers in this school participate in studies aimed at ensuring their professional development
(in-service training, graduate, etc.). ① ② ③ ④ ⑤
18. The teachers in this school run the instructional activities at the speed they are planning. ① ② ③ ④ ⑤ 19. Teachers at this school constitute a positive role model for their students. ① ② ③ ④ ⑤ 20. Teachers in this school have up-to-date legislation regarding their duties and responsibilities. ① ② ③ ④ ⑤ 21. There are materials for instructional activities that are to be carried out in this school. ① ② ③ ④ ⑤ 22. This school has a curriculum that facilitates learning. ① ② ③ ④ ⑤ 23. All the furnishing materials in this classroom are suitable for the age of students. ① ② ③ ④ ⑤ 24. In this school the curriculum is adapted to the student's level. ① ② ③ ④ ⑤ 25. In this school the technological infrastructure provides opportunities for technological
applications in education. ① ② ③ ④ ⑤
26. Relations in this school are based on mutual respect and trust. ① ② ③ ④ ⑤ 27. In this school, all staff take joint responsibility for student learning. ① ② ③ ④ ⑤ 28. In this school, teachers are eager to develop instruction together. ① ② ③ ④ ⑤ 29. In this school, teachers organize extracurricular activities for instructional purposes. ① ② ③ ④ ⑤ 30. In this school, teachers share their teaching experiences with each other. ① ② ③ ④ ⑤ 31. In this school, teachers cooperate to carry out effective teaching. ① ② ③ ④ ⑤ 32. In this school, students are concerned with lessons. ① ② ③ ④ ⑤ 33. In this school, students have willingness to take their own learning responsibilities according to
their age. ① ② ③ ④ ⑤
34. In this school, students are eager to complete their previous learning deficiencies. ① ② ③ ④ ⑤ 35. In this school, students do extra study to keep their grades high. ① ② ③ ④ ⑤ 36. In this school, students have the prerequisite knowledge and skills to perform learning. ① ② ③ ④ ⑤ 37. In this school, students meet their basic needs (health, nutrition, sleep, etc.) for learning. ① ② ③ ④ ⑤ 38. In this school, teachers can provide financial support for the instructional activities they want to
perform. ① ② ③ ④ ⑤
39. This school has financial resources that can operate staff when needed. ① ② ③ ④ ⑤ 40. In this school, financial support is provided for teachers to undertake professional development
studies. ① ② ③ ④ ⑤
REFERENCES
[1] Altınsoy, M. Quality and Resource Relationship in Education, Online available from
http://esagev.org/FileStorage/Article/69D79DBB-E092-426 B-A8A8-B719B6317A96.pdf, 2015.
[2] Bentler, P. M., & Kano, Y. (1990). On the Equivalence of Factors and Components. Multivariate Behavioral Research, 25(1), 67-74.
[3] Boissiere, M. Determinants Of Primary Education Outcomes in Developing Countries: Background Paper for the Evaluation of the World Bank’s Support to Primary Education, Operations Evaluation Department, The World Bank, Washington, D. C. Online available from http://documents.worldbank.org/curated/en/1110114681625 50538/pdf/391570educatio1eterminants01PUBLIC1. pdf 2004.
[4] Brown, T. Confirmatory Factor Analysis for Applied Research, Guilford Publication, New York, 2015.
[5] Child, D. The Essentials of Factor Analysis, Continuum International Publishing, New York, 2006.
[6] Coggins, C. T., Stoddard, P., & Cutler, E. Improving Instructional Capacity Through School-Based Reform Coaches, Online available from
http://files.eric.ed.gov/fulltext/ED478744.pdf, 2003. [7] Cohen, D. K., & Ball, D. L. Instruction, Capacity, and
Improvement. CPRE Research Report Series RR-43. Philadelphia, PA: Consortium for Policy Research in Education, University of Pennsylvania, 1999.
[8] Corcoran, G., & Goertz, H. Instructional Capacity and High Performance Schools. Educational Researcher, Vol.19, No.9, 27–31, 1995.
[9] Costello, A.B., & Osborne, J.W. Best Practices in Exploratory Factor Analysis: Four Recommendations for Getting the Most from Your Analysis. Practical Assessment, Research & Evaluation, Vol.10, No.7, 1-9, 2005.
[10] Crawford, S. Instructional Capacity Building, Lulu, Texas, 2016.
[11] Çokluk, Ö., Şekercioğlu, G., & Büyüköztürk, Ş. Multivariate Statistical SPSS and Lisrel Applications for Social Sciences, Pegem A, Ankara, 2014.
[12] Darling-Hammond, L. Changing Conceptions of Teaching and Teacher Development. Teacher Education Quarterly, Vol.22, No.4, 9-26, 1995.
[13] Fabrigar, L., & Wegener, D. Exploratory Factor Analysis: Understanding Statistics, Oxford University Press, Oxford, 2012.
[14] Finn, J. D., & Achilles, C. M. Tennessee's Class Size Study: Findings, Implications, Misconceptions. Educational Evaluation and Policy Analysis, Vol.21, No.2, 97-109, 1999 [15] Green, T. L. Leading for Urban School Reform and
Community Development. Educational Administration Quarterly, Vol.51, No.5, 679–711, 2015.
[16] Hallinger, P. Assessing the Instructional Management Behavior of Principals. Unpublished Doctoral Dissertation, Stanford University, Stanford, CA, 1983.
[17] Hallinger, P., & Murphy, J. The Social Context of Effective Schools. American Journal of Education, Vol.94, No.3, 328-355, 1985.
[18] Hanushek, E. A. The Failure of Input‐based Schooling Policies. The Economic Journal, 113(485), F64-F98. Online available from
http://hanushek.stanford.edu/sites/default/files/publi cations/Hanushek%202003%20EJ%20113(485).pdf, 2003. [19] Hanushek, E. A., Kain, J. F., & Rivkin, S. G. Teachers,
Schools and Academic Achievement (No.w6691). National Bureau of Economic Research, Online available from http://www.nber.org/papers/w6691.pdf, 1998.
[20] Harrigton, D. Confirmatory Factor Analysis, Oxfor University Press, Oxford, 2009.
[21] Jackson, J. K. School Leadership That Develops Teachers' Instructional Capacity. Unpublished Doctoral Dissertation. University of Illinois at Chicago, 2010.
[22] Jaquith, A. Building Instructional Capacity, Online available from
http://tqsource.airws.org/webcasts/2012ELL/FinalResearch %20Brief_Instructional%20capacity%20building.pdf, 2012. [23] Kline, P. An Easy Guide to Factor Analysis, Routledge
Publishing, New York, 1994.
[24] Lorenzo-Seva, U., & Ferrando, P.J. Factor: A Computer Program to Fit the Exploratory Factor Analysis Model. Behavior Research Methods, Vol.38, No.1, 88-91, 2006. doi:10.3758/BF03192753.
[25] Lyons, W. E. How do we do it? Resolving Role Issues by Building Instructional Capacity, Unpublished Doctoral Dissertation. Regina University, 2009.
[26] MacCallum, R. C., Widaman, K. F., Zhang, S. B., & Hong, S. H. Sample Size in Factor Analysis. Psychological Methods, Vol.4, No.1, 84-99, 1999.
[27] Majors, M. S., & Sedlacek, W. E. Using Factor Analysis to Organize Student Services. Journal of College Student Development, Vol.42, No.3, 2272-2278, 2001.
[28] Massell, D. State Strategies for Building Capacity in Education: Progress and Continuing Challenges. CPRE Research Report Series RR-41, 1998.
[29] Massell, D. State Strategies for Building Local Capacity: Addressing the Needs of Standards-Based Reform. CPRE Policy Briefs, 1998.
[30] Massell, D., & Goertz, M. District Strategies for Building Instructional Capacity. In A. Hightower, M. S. Knapp, J. A. Marsh, & M. W. McLaughlin (Eds.), School Districts and Instructional Renewal (pp. 43–60), Teachers College Press, New York, 2002.
[31] McKinsey & Company. How the World’s Best Performing School Systems Come Out On Top, Online available from http://mckinseyonsociety.com/downloads/reports/Education /Worlds_ School_Systems_Final, 2007.
Systems). Institution List, Online available from https://mebbis.meb.gov.tr/kurumlistesi.aspx, 2016.
[33] Neufeld, B., & Roper, D. Growing Instructional Capacity in Two San Diego Middle School, Mass: Education Matters, Cambridge, 2003.
[34] Newmann, F. M., King, M. B., & Youngs, P. Professional Development That Addresses School Capacity: Lessons from Urban Elementary Schools. American Journal of Education, 259-299, 2000.
[35] O'Day, J., Goertz, M.E., & Floden, R.E. Building Capacity for Education Reform. CPRE Policy Briefs: Reporting on Issues and Research in Education Policy, (RB-18). New Brunswick, NJ: Rutgers University, 1995.
[36] Osborne, J. W., & Costello, A. B. Sample Size and Subject To Item Ratio in Principal Components Analysis. Practical Assessment. Research & Evaluation, 9(11). Online available from http://PAREonline.net/getvn.asp?v=9&n=11, 2004. [37] Osborne, J.W. & Banjanovic, E.S. Exploratory Factor
Analysis with SAS. SAS Institute Inc, Cary, 2016.
[38] Preacher, K. J., & McCallum, R. C. Exploratory Factor Analysis in Behavior Genetics Research: Factor Recovery with Small Sample Size. Behavior Genetics, Vol.32, No.2, 153-161, 2002.
[39] Pritchett, L., & Filmer D. What Education Production Functions Really Show: A Positive Theory of Education Expenditures. Economics of Education Review, Vol.18, No.32, 223-239, 1999.
[40] Sapnas, K. G. Letters to the editor: Determining Adequate Sample Size, Journal of Nursing Scholarship, Vol.36, No.1, 4-9, 2004.
[41] Sayre, C. W. The Superintendent's Maintenance and Influence on Classroom Instructional Capacity: A Mixed Method Study. Doctoral Dissertation, University of Missouri, Columbia, 2007.
[42] Spillane, J. P., & Louis, K. S. School Improvement Processes and Practices: Professional Learning For Building Instructional Capacity. Yearbook of the National Society for the Study of Education, Vol.101, No.1, 83-104, 2002. [43] Şişman, M. Instructional leadership. Pegem A, Ankara.
2002.
[44] Tabachnick, B. G., & Fidell, L. S. Using Multivariate Statistics. (6th Edition). Pearson, Boston, 2013.
[45] Talbert, J. E. McLaughlin, M.W., & Rowan, B. Understanding Context Effects in Secondary School Teaching. Teachers College Record, Vol.95, No.1, 45–68, 1993.
[46] Talley, W. K. Building Instructional Capacity through School Councils. Unpublished Doctoral Dissertation. Louisville University, 2002.
[47] Talley, W. K., & Keedy, J. L. Assessing School Council Contribution to the Enabling Conditions for Instructional Capacity Building An Urban District in Kentucky. Education and Urban Society, Vol.38, No.4, 2006.
[48] Truxillo, C. Multivariate Statistical Methods: Practical Research Applications Course Notes, SAS Institute, Cary, N.C., 2003.
[49] UNESCO. 2013 Education for All Global Monitoring Report. Online available from
http://abdigm.meb.gov.tr/meb_iys_dosyalar/2014_04/0812 1624efa201314raporuesrah.pdf, 2013.
[50] UNESCO. 2015 Education for All Goals. Online available from
http://www.unesco.org.tr/dokumanlar/egitim/2015hedef.pdf, 2015.