Characterization of Superstrate-Loaded Resistive
Rectangular Patch Antenna
Amel Boufrioua
Electronics Department, Technological Sciences Faculty, University Constantine 1, Ain El Bey Road, 25000, Constantine, Algeria *Corresponding Author: [email protected]
Copyright © 2014 Horizon Research Publishing All rights reserved.
Abstract
The scattering radar cross section (RCS) of asuperstrate loaded resistive rectangular microstrip patch which is printed on isotropic or uniaxial anisotropic substrate are investigated, where an accurate design based on the moment method technique in the spectral domain is developed. Entire domain sinusoid basis functions without edge condition and roof top sub-domain basis functions are introduced to expand the unknown current on the metal patches. The integral equation includes a superstrate resistive boundary condition on the surface of the patch and the effects of anisotropic substrate are developed. The necessary terms for representing the surface resistance on the patch were derived and were included in the equation in the form of a resistance matrix. Comparative study between our results and those available in the literature is done and showed a very good agreement.
Keywords
Superstrate, Anisotropy, Resistive, Patch,Antenna
1. Introduction
Microstrip antennas have been widely used in the range of microwave frequencies over the past twenty five years and are now extensively used in various communication systems due to their compactness, economical efficiency, light weight, low profile and conformability to any structure. However, microstrip patch antenna is limited by its inherent narrow bandwidth. Therefore, this problem has been addressed by researchers and many configurations have been proposed for bandwidth enhancement [1-6].
The study of the superstrate layer is of interest, it can affect the performance of printed circuits and antennas and may prove beneficial or detrimental to the radiation characteristics, depending on the thicknesses of the substrate and superstrate layer, as well as relative dielectric constants [1]. In this paper we extend our study [2, 3] to the case of a superstrate-loaded resistive rectangular microstrip structure, where the superstrate layer loaded on the microstrip structure is often used to protect printed circuit antennas from
environmental hazards, or may be naturally formed during flight or severe weather conditions [1, 4].
For the analysis and the design of microstrip antennas there are several techniques developed like cavity model transmission line model, however, the accuracy of these approximate models (simple analytical methods) is limited and only suitable for analysing simple, regularly shaped antenna or thin substrates. The full-wave moment method has been applied extensively and is now a standard approach for analysis of microstrip geometry [1-4]. In such approach, the spectral dyadic Green’s function which relates the tangential electric fields and currents is developed.
The radar cross section of a microstrip patch has recently been treated [7], although, there has been very little work on the radar cross section of patch antennas in the literature. The solution of the electric field integral equation via the method of moments has been a very useful tool for accurately predicting the radar cross section of arbitrarily shaped in the frequency domain [8]. In this paper we will consider only mono-static scattering.
The boundary condition for the electric field on a thin resistive sheet has been examined by Senior and is valid as long as the sheet is electrically thin. Using this type of boundary condition, several authors have examined the scattering response of resistive strips and tapered resistive strips. This approach has also been used in order to study frequency selective surfaces [9]. This paper will describe spectral domain analysis of superstrate-loaded imperfectly conducting microstrip patch antennas printed on isotropic or uniaxial anisotropic substrate by using entire domain sinusoid basis functions without edge condition and roof top sub-domain basis functions to model the patch current density.
It is worth noting that the effects of non-zero surface resistance and the uniaxial anisotropy on the scattering properties of a superstrate loaded rectangular microstrip structure has not yet been treated. A novel proposed structure pertaining to this case will be presented in this paper.
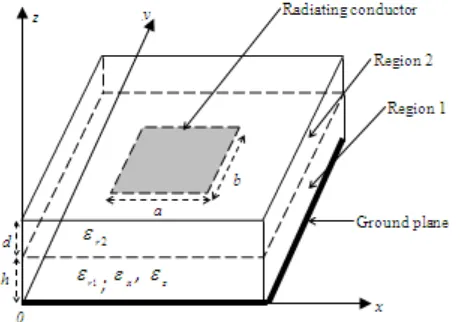
The geometry for the superstrate-loaded resistive rectangular patch antenna is shown in Figure 1. The resistive patch with length a and width b printed on the grounded substrate, which has a uniform thickness of h and having a relative permittivity εr1 (region 1). The superstrate of thickness d with relative permittivity εr2 is obtained by depositing a dielectric layer on the top of the substrate (region 2).
Figure 1. Resistive rectangular patch in a substrate superstrate geometry
The resistive boundary condition at the surface of the patch is given by [3, 10]:
J R E
Escat + inc = s⋅ (1) s
R Surface resistance on microstrip patch antenna.
inc
E Tangential components of incident electric field.
scat
E Tangential components of scattered electric field. JSurface current on the patch.
The study is performed by using a full wave analysis and Galerkin’s moment method in the spectral domain to examine the scattering properties of a superstrate loaded rectangular patch antenna with a surface resistance, in which we extend our study [2, 3] to the case of this proposed geometry.
In the spectral domain the relationship between the patch current and the electric field on the patch is given by:
( )
s( ) ( )
s ss k Gk Jk
E~ = ⋅~ (2) Where Gis the spectral dyadic Green’s function and
( )
ks J~ is the current on the patch.
The designers should, however, carefully check for the anisotropic effects in the substrate material with which they will work, and evaluate the effects of anisotropy.
In the case of a uniaxially anisotropic substrate εr1 can be represented by a tensor or dyadic of this form [2]:
[
x x z]
r ε ε ε ε
ε1= 0.diag , , (3) ε0 is the free-space permittivity; all the dielectric materials are assumed to be nonmagnetic with permeabilityµ0.
z
ε
is the relative permittivity in the direction of the optical axis.x
ε is the relative permittivity in the direction perpendicular
to the optical axis.
Based on [4] we have included the effect of the superstrate in the Green’s function formulation as:
h k T D k T D k i G G e e m m TE TM s 1 2 0 1 0 sin 0 0 0 0 ) ( ⋅ − = = ωε k G (4) Where
[
]
+ + − = h k k k k i h k k d k i h k ik h k k d k Tm 1 2 3 1 2 1 2 2 1 2 1 1 1 3 1 2 sin cos sin sin cos cos ε ε ε ε (5)[
]
+ + − = h k ik h k k k k d k i h k ik h k k d k Te 1 2 1 2 3 1 2 1 3 1 1 2 sin cos sin sin cos cos (6) d k k i d k kDm 2
2 2 2
3cos + ε sin
= (7)
d k k k i d k
De 2
2 3
2 sin
cos +
= (8)
2 2 0 2 s i
i k k
k =
ε
− , i= ,12,3, ε3=1.0 (9.a)2 2 2
y x
s k k
k = + , 0 0
2 2
0 =
ω
µ
ε
k (9.b)
An integral equation can be formulated by using this Green’s function to determine the electric field at any point. The details of the solution of the transformed integral equation are presented in [1-3].
The surface current on the patch can be expanded into a series of known basis functions Jxn and Jym
( )
∑
( )
∑
( )
= = + = Mm m ym s
N
n
s xn n
s b J
J a 1 1 0 0 r r r
J (10)
Where an and bm are the unknown coefficients to be
determined in the x and y direction respectively.
The Fourier transforms for (10) are expressed by [3, 4]:
( )
ks rsF(
ks, rs) ( )
JrsJ =
∫∫
−∞
∞ −
d
~ (11)
(
k
s,
r
s)
F
−
is the kernel of the vector Fourier transforms.(
)
i s sx y y x s s
s k k e
k k k r k r k F ⋅ − = 1
, ,rs =xxˆ+yyˆ. (12)
kx and ky are the spectral variables corresponding to x and y respectively.
introduced to expand the unknown current on the metal patches [2, 3] of this proposed antenna.
2.1. Entire-Domain Sinusoid Basis Function without Edge Condition
Entire domain expansion currents lead to fast convergence and can be related to a cavity model type of interpretation [11]. The currents can be defined using a sinusoidal basis function defined on the whole domain, without the edge condition [4, 12]. The currents are associated with the complete orthogonal modes of the magnetic cavity. Both x
and y directed currents were used, with the following forms [13]:
( )
+ + = 2 cos 2sin 1 2 y b
b n a x a n Jxn π π s r (13.a)
( )
+ + = 2 sin 2cos 1 2 y b
b m a x a m Jym π π s r (13.b)
The transforms of these basis functions (13. a) and (13. b) can be written as:
( )
∫
∫
− − − − + × + = 2 / 2 / 2 2 / 2 / 1 2 cos 2 sin ~ b b y ik a a x ik xn b y b n e dy a x a n e dx J y x π π s k (14.a)( )
∫
∫
− − − − + × + = 2 / 2 / 2 2 / 2 / 1 2 sin 2 cos ~ b b y ik a a x ik ym b y b m e dy a x a m e dx J y x π π s k (14.b)2.2. Roof Top Sub-Domain Basis Functions
Roof top functions are characterized by their triangular shape along the direction of current flow and rectangular cross section in the orthogonal direction, mathematically, the sub-domain basis functions for the components of the current are described in [14] as:
( )
I( ) ( )
x yJ m n
M m N n mn x
x =
∑∑
Λ = + = 1 1 1 s
r (15.a)
( )
I( ) ( )
y xJ n m
M m N n mn y
y =
∑∑
Λ +
= =
1
1 1
s
r (15.b) Where, the functions Λand are "triangle" and "pulse" functions, respectively.
The transforms of the current densities of (15. a) and (15. b) can be written as:
( )
( )
smn x M 1 m 1 N 1 n mn x s
x k I K k
J~
∑∑
~= +
=
= (16.a)
( )
mny( )
s 1 M 1 m N 1 n mn y sy k I K k
J ~
~
∑∑
+= =
= (16.b)
Where
( )
2 1sin 2 sin 8 ~ 2 2 A k y k k x k x K y y x x mn x × ∆ ∆ ∆ = s
k (17.a)
( )
2 1sin 2 sin 8 ~ 2 2 A k y k k x k y K y y x x mn y × ∆ ∆ ∆ = s
k (17.b)
(
)
(
/2)
exp
1 jk x jk y jk y
A = − x m − y n+ y ∆
(
+1)
=
∆x a M and∆y=b
(
N+1)
Note that the rectangular patch is divided into (m+1)×
(n+1) cells along the x and y directions, with each cell having the dimensions of ∆xand∆y.
Using Galerkin’s method, the electric field integral equation which enforces the boundary condition must vanish on the patch surface, can then be discretized into a matrix form as [3]:
( ) ( )
( ) ( )
( )
( )
( )
( )
( )
( )
1 1 1 10
0
0
N N N M N
M
M N M M
N N N
M M M × × × × × × × × × ×
⋅
+
⋅
=
1 2 3 4 1 4Z
Z
a
b
Z
Z
R
a
b
R
(18)( )
Zi The impedance matrix terms, i = 1, 2, 3, 4.( )
Rj Resistance matrix terms representing surfaceresistance on the patch j = 1, 4.
( )
aN×1,( )
b M×1are the unknown current modes on the patch.Since that we have included the effect of uniaxial anisotropic substrate and the effect of superstrate in the Green’s functions, and the effect of the non-zero surface resistance at the resistance matrix and consequently at the impedance matrix, the different antenna characteristics beginning by the resonant frequency can be obtained similar to [1-4]. It is worth noting that the resonant frequencies are defined to be the frequencies at which the field and the current can sustain themselves without a driving source. Therefore, for the existence of nontrivial solutions, the determinant of the characteristic equation [Z] must be zero. The roots of this [Z] matrix are complex, therefore, Muller’s algorithm has been employed to compute the roots and hence to determine the resonant frequency, consequently the other different antenna characteristics can be easily obtained.
Stationary phase evaluation yields convenient and useful results for the calculation of antenna patterns or radar cross section[15].The radar cross section computed from [7, 8], for a unit amplitude incident electric field is given by:
( )
θθ 10 σ log 10RCS= (19)
θθ
σ isθˆ polarized backscatter from a unit amplitude θˆ
3. Numerical Results
The moment method technique with entire domain sinusoid and roof top sub-domain basis functions has developed to examine the resonant frequency and the scattering properties of a rectangular patch antenna.
To ensure that the computer programs are correct, comparisons are shown in Table. 1 for a perfectly conducting patches of different sizes without dielectric substrates (air). It is important to note that the normalization is with respect to
f0 of the magnetic wall cavity. The calculated results for the
[image:4.595.59.302.321.491.2]two sets of basis functions shown in table 1 agree very well with experimental results obtained by other authors [16], computations show that the roof top sub-domain basis functions provides a significant improvement in the computations time with less iterations in the evaluation of the resonant frequency of a microstrip patch compared to the entire domain sinusoid basis functions [3].
Table 1. Measured and calculated resonant frequencies of rectangular microstrip antennas.
a
(cm) (cm) b (cm) h (f/f[16] 0)
Our results (f/f0)
Roof top domain Entire
5.70 3.80 0.317 0.893 0.854 0.882 4.55 3.05 0.317 0.897 0.839 0.863 2.95 1.95 0.317 0.841 0.801 0.816 1.95 1.30 0.317 0.773 0.761 0.765 1.40 0.90 0.317 0.705 0.718 0.710 1.20 0.80 0.317 0.673 0.707 0.693 1.05 0.70 0.317 0.651 0.691 0.672 1.70 1.10 0.152 0.881 0.815 0.834 1.70 1.10 0.317 0.761 0.741 0.739
[image:4.595.319.543.346.709.2]In table 2 we have compared our results with those of Wong and Row deduced from [Figure. 3. a, 13] for εz=2.35, h=0.1 cm, a=1.5cm, b=1.0cm, a good agreement between our results and those of Wong and Row is achieved, also the results show that the resonant frequency is slightly increased due to the positive uniaxial anisotropy when εxchange.
Table 2. Resonant frequency for the isotropic, positive and negative uniaxial substrate
type of substrate
ε
x Resonant frequency (f/f0) Results of [13] Our results negative uniaxial 2.82 0.910 0.9161isotropic 2.35 0.915 0.9213 positive uniaxial 1.88 0.925 0.9269
Table 3 shows the scattering radar cross section RCS for an imperfectly conducting patch with the surface resistance
Rs=30 Ω compared to a perfectly one and printed on a
substrate of thickness h=0.2 cm, where isotropic, positive and negative uniaxial anisotropic substrates are considered. The patch dimensions are: a= 1.5cm, b=1.0 cm. It can be
seen clearly that the permittivity εz has a stronger effect on
the scattering radar cross section than the permittivityεxfor
both cases.
Table 3. Effects of the surface resistance on the radar cross section for isotropic, negative and positive uniaxial substrates, a=1.5cm, b=1.0cm,
h=0.2cm,θ=60°, φ=0.
x
ε εz AR RCS (dBsm)
Rs(Ω)=30 Rs (Ω)=0
2.32 2.32 1 -29.27 -28.57 4.64 2.32 2 -29.39 -28.82 2.32 1.16 2 -29.12 -28.05 1.16 2.32 0.5 -29.25 -28.68 2.32 4.64 0.5 -29.64 -29.50
The substrate has a relative permittivity of εr1=2.35 with a
uniform thickness of h=0.1cm and the patch dimension is 6.0cm x5.0cm. For all our computations the mode that we will be studying is the TM01 mode with the dominant component of the current in the y direction. To simplify the analysis, the antenna feed will not be considered.
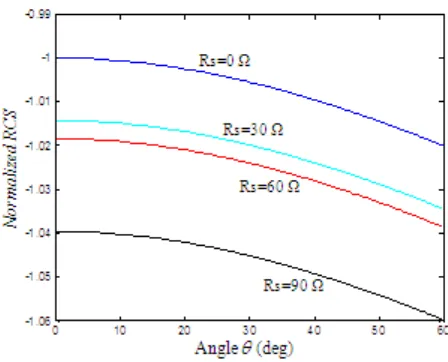
[image:4.595.59.300.601.676.2]Figure 3. Radar cross section versus angle for different surface resistance Rs of a superstrate loaded rectangular microstrip patch; h=0.2cm,
d=0.159cm εr1=εr2 =2.35 at
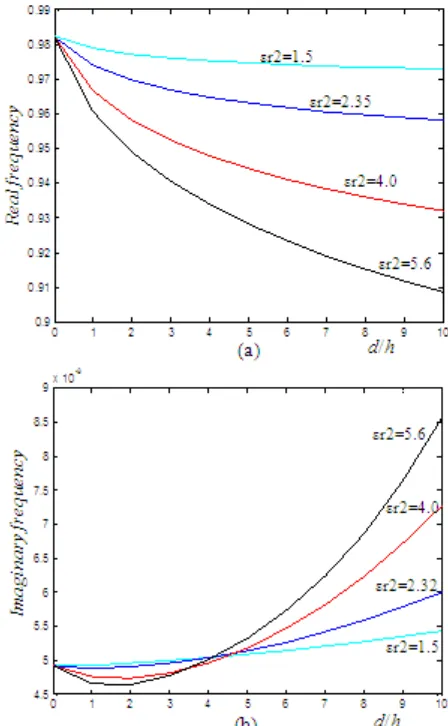
In figures 2 (a, b), the real and imaginary part of the complex resonant frequency versus the superstrate thickness for different dielectric constants of the superstrate are shown. The obtained results show that when the superstrate thickness is increased, the real part of the complex resonant frequency decreases.
The variation of the imaginary part of the complex resonant frequency is very small for d less than about 5h. As the superstrate thickness increases (5h<d) the variation becomes significant for high superstrate permittivities.
We conclude that the obtained results show that the complex resonant frequency varies more significantly when the superstrate permittivity is greater than that of the substrate. It is worth noting that for these three figures the normalization is with respect to that of the perfectly patch (Rs=0 Ohm) with no superstrate (d=0).
Figure 3 shows the normalised scattering radar cross section RCS of a superstrate-loaded rectangular microstrip versus the angle θ for different surface resistance Rs, the normalization is with respect to that of the perfectly patch (Rs=0 Ohm) with no superstrate (d=0)
We observe that when the surface resistance is increased, the level of the radar cross section decreases. Consequently the addition of a resistance on the surface of a microstrip patch antenna has been shown to decrease the scattered energy from the antenna.
4. Conclusion
The moment method technique has been developed to examine the complex resonant frequency and the radar cross section (RCS) of a superstrate loaded resistive rectangular microstrip patch which is printed on isotropic or uniaxial anisotropic substrate with the optical axis normal to the patch. We have included the effect of the superstrate in the Green’s function formulation which is carried out in the spectral domain. The choice of roof top subdomain basis functions
and the entire domain defined in the field of the patch were illustrated to develop the unknown currents on the patch. The necessary terms for representing the surface resistance on the patch are derived and are included in the equation in the form of a resistance matrix.
To ensure that the computer programs are correct, numerical results of our proposed antenna for perfectly conducting patches are shown and the accuracy of the computed technique is presented and compared with other computed results found in the literature which are in close agreement. Since that the effect of non-zero surface resistance and the uniaxial anisotropy on the scattering properties of a superstrate loaded rectangular microstrip structure has not yet been treated, a number of results pertaining to this case are presented in this paper.
The numerical results show that the complex resonant frequency of a superstrate loaded resistive rectangular microstrip patch varies more significantly when the superstrate permittivity is greater than that of the substrate, The obtained results show also that when the superstrate thickness is increased, the real part of the complex resonant frequency decreases. Also the addition of a resistance on the surface of a superstrate rectangular microstrip patch antenna has been shown to decrease the level of the radar cross section.
REFERENCES
[1] N. G. Alexopoulos, D. R. Jackson. Fundamental superstrate (cover) effects on printed circuit antennas, IEEE Trans. Antennas Propagat. Vol. 32, No. 8, 807–815, 1987.
[2] A. Boufrioua. Analysis of a rectangular microstrip antenna on a uniaxial substrate, Chapter 2, in the Book entitled ‘‘Microstip Antennas, Editor: Nasimuddin’’; InTech Publishers, 27
-
42, Croatia, 2011.[3] A. Boufrioua. Resistive rectangular patch antenna with uniaxial substrate, Chapter 6 in the Book entitled ‘‘Antennas: Parameters, Models and Applications, Editor: Albert I.Ferrero’’ Nova Publishers, Inc. 163
-
190, New York, 2009. [4] J-S. Row, K. L. Wong. Resonance in a superstrate-loadedrectangular microstrip structure, IEEE Trans. Antennas Propagat. Vol. 41, No. 8, 1349–1355, 1993.
[5] J. A. Ansari, P. Singh, S. K. Dubey, R. U. Khan B. R. Vishvakarma, I. T. Bhu. H-shaped stacked patch antenna for dual band operation, Progress in Electromagnetic Research B, Vol. 5, 291-302, 2008.
[6] A. Deshmukh, G. Kumar. Formulation of resonant frequency for compact rectangular microstrip antennas, Microwave and Optical Technology Letters, Vol. 49, No. 2, 498-501, 2007. [7] E. F. Knott, J. F. Shaeffer, M. T. Tuley. Radar Cross Section,
Publisher SciTech, Raleigh, NC, 2004.
[8] V. M. Reddy, D. Deshpand, C. R. Cockrell, F. B. Beck. Fast RCS Computation Over a Frequency Band Using Method of Moments in Conjuction with Asymptotic Waveform
θ
0 =
Evaluation Technique, IEEE Transactions on Antennas and Propagation, Vol. 46, No. 8, 1229-1233, 1998.
[9] R. Mittra, R. C. Hall, and C. H. Tsao. Spectral domain analysis of circular patch frequency selective surfaces, IEEE Trans Antennas Propagat. Vol. 32, No. 5, 533–536, 1984. [10] D. Shively. Scattering from Perfectly Conducting and
Resistive Strips on a Grounded Dielectric Slab, IEEE Trans. Antennas Propagation, Vol. 42, No. 4, 552-556, 1994. [11] D. M. Pozar and S. M. Voda. A rigorous analysis of a
microstripline fed patch antenna, IEEE Trans. Antennas Propagat. Vol. 35, No. 12, 1343–1350, 1987.
[12] E. Newman, D. Forrai. Scattering from a microstrip patch, IEEE Trans Antennas Propagat., Vol. 35, No. 3, 245–251, 1998.
[13] K-L Wong and J-S Row. Resonance of a rectangular microstrip patch on a uniaxial substrate, IEEE Transactions on Microwave Theory and Techniques. Vol 41, No. 4, 698–701, 1993.
[14] B. S. Park, C. A. Balanis. C. R. Birtcher. Analytical evaluation of the asymptotic impedance matrix of a grounded dielectric slab with roof top functions, IEEE Trans Antennas Propagat., Vol. 46, No. 2, 251–259, 1998.
[15] D. M. Pozar. Radiation and Scattering from a Microstrip Patch on a Uniaxial Substrate, IEEE Transactions on Antennas and Propagation, Vol. 35, No. 6, 613-621, 1987. [16] W. C. Chew and Q. Liu. Resonance frequency of a