International Journal of Emerging Technology and Advanced Engineering
Website: www.ijetae.com (ISSN 2250-2459, Volume 2, Issue 4, April 2012)358
Application of Taguchi Method in process improvement of
peeling of SS-202
Nikul D. Patel,
1Prof. Satyam P. Patel,
2Aniskhan Pathan
31M.E. Mechanical (Production) Mech. Engg. Dept L.D.R.P. Inst. Of Tech. & Research Gandhinagar, India 2M.Tech. Mechatronics L.D.R.P. Inst. Of Tech. & Research Gandhinagar, India
3M.Tech(Machine design) Mech.Engg.Dept. O.I.S.T, Bhopal
1
2[email protected] 3[email protected]
.
Abstract—The demand for high quality focuses attention on the surface condition of the product, especially the roughness of the machined surface, because of its effect on product appearance, function, and reliability. Surface quality is one of the specified customer requirements for machined parts. There are many parameters that have an effect on surface roughness such as cutting speed, feed rate, and depth of cut are known to have a large impact on surface quality. The present work studies these aspects of the peeling process applied on hardened steel using carbide inserts. Bar peeling is a method which is used to remove oxide scale, mill scale, surface cracks etc. from hot rolled or forged blanks. During peeling operation, the bar is passed through a rotating peeling head, with a radial direction of cut. The influence of cutting parameters on surface roughness was analyzed for one insert and the influence of these parameters was obtained.
Keywords-Peeling; bright bar; cutting parameters; surface roughness; insert
I. INTRODUCTION
Surface roughness has received serious attention for many years. It has formulated an important design feature in many situations such as parts subject to fatigue loads, precision fits, fastener holes, and aesthetic requirements. In addition to tolerances, surface roughness imposes one of the most critical constraints for the selection of machines and cutting parameters in process planning. A considerable number of studies have investigated the general effects of the speed, feed, and depth of cut on the surface roughness[1].
A greater attention is given to accuracy and surface roughness of product by the industry these days. Surface finish has been one of the most important considerations in determining the machinability of materials. Surface roughness and dimensional accuracy are the important factors required to predict machining performances of any machining operations[2].
In cold drawing process, the material being drawn is at room temperature (i.e. cold-drawn). The pointed/reduced end of the bar or coil, which is smaller than die opening, is passed through the die where it enters a gripping device of the drawing machine. The drawing machine pulls or draws the remaining unreduced section of the bar or coil through the die. The die reduces the cross section of the bar or coil , shapes the profile of the product and increases the length of the original product. In cold drawing process the bars are produced in range of 20 to 75 mm.
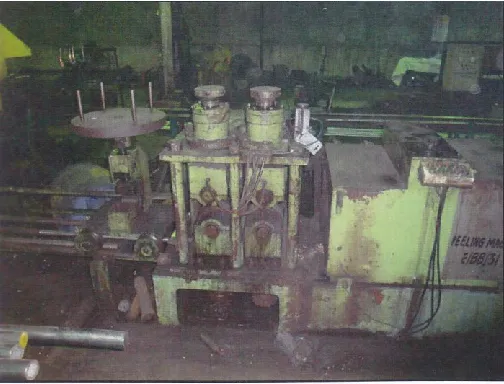
[image:1.612.316.568.501.693.2]In peeling machine, the black bars are passed through the rotating cutter head containing cutting inserts. Due to the relative motion between the bar and insert , the bar material is removed from periphery and thus we get required size of bright bar. In peeling machine the black bars are peeled off to get the bright bars of the required size.
International Journal of Emerging Technology and Advanced Engineering
Website: www.ijetae.com (ISSN 2250-2459, Volume 2, Issue 4, April 2012)359 During the peeling operation the bars getting a helical pattern, “ringing”, on their surface. So, more tolerance is to be provided on the peeled bars (around 0.1 – 0.5 mm). After peeling operation, the bars are taken on the centre less grinding machines, at where the grinding is done on the bars to achieve the required size. This is done with the help of 3-4 grinding passes. So the operation cost is affected adversely.
II. PROCESS PARAMETERS
In turning operation the resultant force is divided into three components, feed force Ff, radial force Fr and cutting force Fc. Usually, in finishing operations the radial force, Fr, is the largest of all, since the doc is very small, compared to the tool nose radius. When cutting speed increases both, radial and feed forces tend to decrease, for most of the metallic parts cut with carbide tools. Trent (1991) attributes such behavior partly to the softening effect of the work piece material, due to temperature increase, and partly to the decreasing of the chip-tool contact length. Additionally, the depth of cut (doc) apparently has an influence larger than the cutting speed, and feed rate has a moderate effect on forces[3][5].
One of the most important phenomena occurring during the machining process is the heat generation in the cutting zone. Many researchers, Shaw (1984), Komanduri-Hou (2001), and Stephenson (1993), among them, agree that most of the energy applied to the cutting process is converted into heat in the main zone of plastic deformation, the shearing plane, where the workpiece material turns itself into chip and in the secondary zone of plastic deformation, where chip slides on the rake face. Finally, some heat also arises on the tertiary zone, where the tool relief face slides on the newly machined surface. This last source is, however, not considered in most cases, either for simplicity, or because the heat generated is very small when using sharp cutting edges[4].
The heat generated in those zones is distributed among the tool, the workpiece, the chip, and after that to the environment. Heat generated at the shearing plane can make the cutting action easy, but it can flow into the cutting edge and that will negatively affect tool life by shortening it.
In general, the most important point in machining processes is the productivity, achieved by cutting the highest amount of material in the shortest period of time using tools with the longest lifetime. Combining all the parameters involved in the machining process to maximize productivity is, nevertheless, a very complex task and becomes much more difficult when working at high speed cutting in hardened steels[2].
In general, when machining steel with coated carbide tools different tool wear mechanisms occur, such as: abrasion, adhesion, oxidation and even some diffusion, which act simultaneously and in proportions depending mainly on the
temperature, (Usui, 1998). The task of defining which of those mechanisms is the predominant one has become a very complex task. However, some researches relating wear mechanisms to the cutting speed have been made and some important results have been published. For example, the raise in temperature at the cutting zone occurs basically due to the cutting speed increase[6].
The abrasion phenomenon occurs predominantly at low cutting speeds, adhesion at medium ones, and oxidation/diffusion at high ones. The limit of growing for cutting speed depends on several other factors, such as tool-workpiece combination, contact time between them and the presence of cutting fluids. However, those findings are only indications and may not offer more than recommendations for practical applications. By superimposing wear mechanisms and their relations with cutting speed, it is possible to explain most of the tool wear observed in practice; although in some cases the causes may depend on some other factors occurring at the cutting zone and tool/workpiece contact area, (Arsecularatne et al., 2005).
The present work intends to clarify some points relating tool wear, forces and surface roughness when peeling hardened steels at high cutting speeds.
III. DESIGN OF EXPERIMENT
“The technique of defining and investigating all possible conditions in an experiment involving multiple factors is known as the design of experiments”
Design of experiments refers to the process of planning, designing, and analyzing the experiment so that valid and objective conclusions can be drawn effectively and efficiently .in order to draw statistically sound conclusions from the experiment, it is necessary to integrate simple and powerful statistical methods in to the experimental design methodology. The success of any industrially designed experiment depends on sound planning appreciate choice of design stastical analysis of data and team work skills.
International Journal of Emerging Technology and Advanced Engineering
Website: www.ijetae.com (ISSN 2250-2459, Volume 2, Issue 4, April 2012)360 IV. METHODS
The design of experiment based on
Taguchi method,
Factorial design,
Response surface method.
In the present experiment, the factorial design methods is used. For a full factorial design , if the numbers of levels are same then the possible design N is N =Lm
Where l=number of levels for each factor, and M= number of factor
Fractional factorial designs are good alternatives to a full factorial design, especially in the initial screening stage of a project. It is used to simplify the experiment.
Fractional factorial experiments investigate only a fraction of all the possible combinations. This approach saves considerable time and also money in case of costly materials, but requires rigorous mathematical treatment, both in the design of experiment and in the analysis of the results
Each experimenter may design a different set of fractional factorial experiments. Taguchi simplified and standardized the fractional factorial designs in such a way two engineers conducting tests thousands of miles apart, will always use similar designs and tends to obtain similar results. Taguchi developed a family of fractional factorial experiments matrics which can be utilized in various situations. These matrics reduce the experimental number but still obtain reasonably rich information. In taguchi methodology specially designed tables known as orthogonal array’s are used. The use of these tables makes the design of experiments very easy and consistent.
[image:3.612.311.574.135.699.2]The experiment has been performed and readings are taken for the insert at different cutting speed, feed and depth of cut to find out the surface roughness in each case. Three values of cutting speed are utilized and for each of these three values, three different feed rates are employed. Again for each feed rate three different Depth of Cuts are introduced. The value of surface roughness is measured for every time and the results show that roughness is affected by all these three parameters. Table 1 shows the data obtained in the experiment.
TABLE I. VARIATION OF SURFACE ROUGHNESS WITH OTHER
PARAMETERS
Sr. No.
Cutting speed (m/min)
Feed (mm/rev)
Depth of cut (mm)
Surface roughness
(µm)
1 24.976 5.341 1.0 3.67
2 24.976 5.341 1.5 3.74
3 24.976 5.341 2.0 3.77
4 24.976 7.0986 1.0 4.10
5 24.976 7.0986 1.5 4.26
6 24.976 7.0986 2.0 4.47
7 24.976 8.6201 1.0 4.72
8 24.976 8.6201 1.5 4.88
9 24.976 8.6201 2.0 4.92
10 60.633 5.341 1.0 4.95
11 60.633 5.341 1.5 5.12
12 60.633 5.341 2.0 5.23
13 60.633 7.0986 1.0 5.30
14 60.633 7.0986 1.5 5.62
15 60.633 7.0986 2.0 5.77
16 60.633 8.6201 1.0 5.82
17 60.633 8.6201 1.5 5.93
18 60.633 8.6201 2.0 6.03
19 66.916 5.341 1.0 4.97
20 66.916 5.341 1.5 6.38
21 66.916 5.341 2.0 6.45
22 66.916 7.0986 1.0 5.1
23 66.916 7.0986 1.5 6.66
24 66.916 7.0986 2.0 6.71
25 66.916 8.6201 1.0 5.83
26 66.916 8.6201 1.5 6.85
International Journal of Emerging Technology and Advanced Engineering
Website: www.ijetae.com (ISSN 2250-2459, Volume 2, Issue 4, April 2012)361 V. RESULTS AND DISCUSSION
The following plots show the results of interaction between speed, feed, Depth of Cut (DOC) and surface roughness which are obtained from the experiment.
Fig. 2 shows the relation between the cutting speed, feed and surface roughness. Here initially surface roughness increases with increase in speed but at certain speed it becomes stable or reduces.
Figure 2. Interaction curve – Cutting Speed-Feed
Fig. 3 shows the relation between Speed, depth of cut and surface roughness. Here surface roughness increases with increase in speed.
Figure 3. Interaction curve – Cutting Speed-DOC
Fig. 4 shows the relation between Feed, Speed and surface roughness. Here surface roughness increases with increase in speed.
Figure 4. Interaction curve – Feed-Cutting Speed
Fig. 5 shows the relation between DOC, Speed and surface roughness. Here surface roughness increases slightly with increase in depth of cut.
Figure 5. Interaction curve – DOC-Cutting Speed
Fig. 6 shows the relation between DOC, Feed and surface roughness. Here surface roughness increases slightly with increase in depth of cut.
Figure 6. Interaction curve – DOC-Feed
Fig. 7 shows the relation between Feed, depth of cut and surface roughness. Here surface roughness increases gradually with increase in feed.
International Journal of Emerging Technology and Advanced Engineering
Website: www.ijetae.com (ISSN 2250-2459, Volume 2, Issue 4, April 2012)362 CONCLUSION
The experimental results show that the surface roughness is affected by all the three cutting parameters viz. Cutting speed, feed rate and Depth of Cut. It can also be found that cutting speed has the maximum impact on the surface roughness than the other parameters. This analysis can be utilized for selecting proper value of cutting parameters.
REFERENCES
[1] Chang – xue (jack) feng. “An experimental study of impact of turning parameter on Surface roughness,” proceedings of the 2001 industrial Engineering’s research larendon, 1892, pp.68–73.
[2] Federico m. Aneiro, Reginald T.Coeho and Lincoln C.
Brandao,”Turning hardened steel using coated carbide at high cutting speeds”, journal of Brazilian society of mechanical science and Engineering, vol.XXX April-June
[3] E.Danial Kirb,”A Parametric design study in a turning operation using the Taguchi Method”, the technology interface, Fall 2006
[4] Dr. S.s mahapatra, Amar Patnaik, prabina Ku. Patnaik, “Parametric analysis and optimization of cutting parameters for turning operation based on Taguchi method”, proceeding of the international conference on global manufacturing and innovation,july-2006
[5] Dr.S.S chaudhari, S.S Khedkar, N.B Borkar “optimization of process parameters using taguchi approach with minimum quantity lubrication for turning” proceeding of the international journal of engineering research and applications(IJERA)