Journal of Chemical and Pharmaceutical Research, 2014, 6(9):370-375
Research Article
CODEN(USA) : JCPRC5
ISSN : 0975-7384
Reverse phase high performance liquid chromatographic method
for estimation of metronidazole in tablet dosage form
Amit Kumar De
1, Ashok Kumar Bera
2and Biswajit Pal*
31
R & D Division, Dey’s Medical Stores (Mfg) Ltd., 62 Bondel Road, Kolkata, India
2Shri Ritam Vidyapith, 293/1 Raja Rammohan Roy Road, Kolkata, India
3Department of Chemistry, St. Paul’s C. M. College, 33/1 Raja Rammohan Roy Sarani, Kolkata, India
____________________________________________________________________________________________
ABSTRACT
A simple, accurate, precise, reproducible and selective chromatographic technique for the estimation of metronidazole from bulk and tablet dosage form has been described in this study. The chromatographic technique was developed using a C18 column and a mobile phase consisting of phosphate buffer of pH 3.5 and acetonitrile in ratio 60:40 and at a flow rate 1.0 ml.min-1. The method was validated as per ICH Q2 guidelines on the basis of accuracy, precession, linearity, ruggedness, robustness and selectivity. The method was found to be linear in the concentration range 10.56 to 80.74 µg/ml (r2 = 0.999) and limit of quantisation 5.28 µg/ml. A recovery of 99.88% was observed for the method with sufficient precession and reproducibility. The results of the described RP-HPLC method therefore present successful application of this method for routine quality control analysis of metronidazole in marketed formulations.
Keywords: Amoebiasis; Crohn’s Disease; RP-HPLC; Nitroimidazole.
____________________________________________________________________________________________
INTRODUCTION
Metronidazole (MTZ) is a 5- nitroimidazole derivative with activity against anaerobic bacteria and protozoal infections [1, 2]. It also has radiosensitizing effect and has been tried in the treatment of malignant neoplasms. Chemically it is 2-(2-Methyl-5-nitroimidazole -1-yl) alcohol [Fig. 1] and its mechanism of action is thought to involve interference with DNA by a metabolite in which the nitro group of metronidazole gets reduced [1-3].
Fig. 1 Structure of Metronidazole
acute necrotising ulcerative gingivitis, bacterial vaginosis, pelvic inflammatory disease, urethritis (nongonococal), tetanus, and antibiotic associated colitis [1, 12], in the treatment of Crohn’s Disease [13, 14], etc.
The drug is readily absorbed following oral administration and several types of formulations containing MTZ are available in the market. Extensive literature survey presents several techniques like spectrophotometic [15-16] and chromatographic techniques [18-20] for the estimation of MTZ from marketed formulations (separate and combined dosage forms) and biological fluids [20, 21]. The chromatographic techniques used either methanol or acetonitrile as organic phase and water or a phosphate buffer solution as a polar modifier [19-23]. A C18 column was used as stationary phase and a mobile phase flow rate of 1 ml/min [24, 25]. Most of these methods are less specific and more time consuming. In the current study we have developed a chromatographic technique for the estimation from tablet dosage forms. The newly developed method is less time consuming and more specific for the quantification of MTZ from marketed formulations.
EXPERIMENTAL SECTION
2.1. Chemicals, reagents and instrumental conditions:
Standard metronidazole (99.8%) was obtained from Central Drug Laboratory, Kolkata and was used as reference standard without further purification. Metronidazole tablets (Metrogyl 400) were purchased from local pharmacy. All other reagents were analytical grade and all solvents were of HPLC grade. AR grade potassium dihydrogen phosphate and dipotassium hydrogen phosphate, HPLC grade acetonitrile and phosphoric acid were purchased from Merck Ltd., Mumbai. Purification of water up to HPLC grade was made by Aurium 611 UV water purification system of Sartorius, Germany. Chromatographic separation was carried out on a waters Alliance e2695 separation module with double pump, rheodyne injector with 10 µl loop and 2489 dual lambda absorbance detector. A reverse phase C18 (250 mm × 4 mm, 5 µm) was used for separation. The mobile phase comprising of a mixture of 5.3 mM
phosphate buffer solution adjusted to pH 3.5 ± 0.1 with orthophosphoric acid and acetonitrile in the ratio of 60:40 with a flow rate of 1.0 ml /min [24, 25]. The injection volume was 10 µl and the UV detection was made at 318 nm at ambient temperature (24 ± 2°C). All data were analysed by using Empower 3 software.
2.2. Preparation of stock, working standard and sample solutions:
To prepare standard solution of metronidazole, 25 mg of the drug was taken in volumetric flask along with 10 ml HPLC grade water and one drop of conc. HCl followed by sonication for 15 minutes and the final volume was made by mobile phase. Final working standard solution was made by diluting the above stock solution to 0.04 mg/ml of metronidazole in mobile phase. An appropriate amount of powder mass which was obtained by crushing 20 tablets, equivalent to 25 mg of metronidazole was weighed accurately and transferred to a 25 ml volumetric flask. About 10 ml of HPLC grade water and 1 drop of conc. HCl were added to it and sonicated for 15 mins and volume was made up to the mark by mobile phase. This solution is further diluted finally to 0.04 mg/ml of metronidazole in mobile phase after filtration through Whatman filter paper no. 1. The content of standard and sample solution was filtered through 0.45 µm syringe filter before each injection.
RESULTS AND DISCUSSION
3.1 Analysis of formulation:
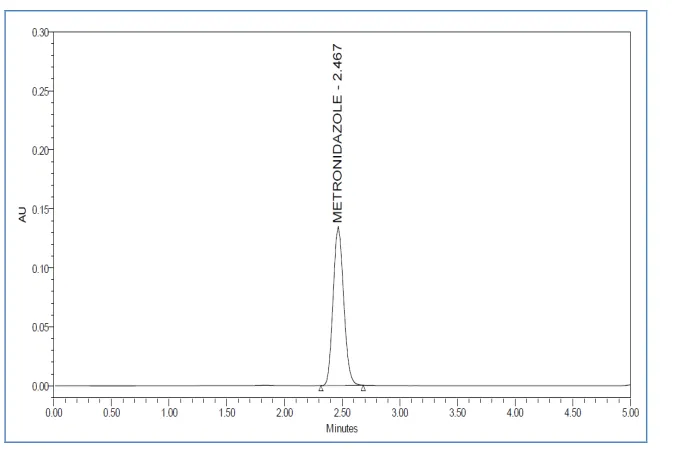
With the optimized chromatographic conditions, the 10 µl of standard solution was injected (n=6) and the chromatograms were recorded. A typical chromatogram was presented in Fig. 2. The retention time was 2.467 min.
This procedure was repeated for the sample solution obtained from the formulation. The average peak area of the standard (n=6) and of the sample (n=2) solution was obtained from the software and the concentration of the drug in formulation was calculated by comparing these areas (Table 1).
Table 1: Sample formulation
Tablet Formulation Drug
Amount of Drug
Fig. 2 Chromatogram of Metronidazole (retention time = 2.467)
3.2 Method validation:
The linearity, precision, accuracy, robustness, ruggedness, LOD, LOQ and system suitability parameters were studied systematically to validate the proposed RP-HPLC method as per USP [26] and ICH guidelines [27].
3.2.1 System suitability:
[image:3.595.227.384.436.511.2]The column efficiency, resolution and peak asymmetry were determined by making six replicate injections of the standard solution. The retention time, tailing factor, theoretical plates, area relative standard deviation were determined (Table 2).
Table 2: System suitability parameter
Parameters Metronidazole
Wavelength maxima (nm) 318
Retention Time (mins) 2.467
Tailing factor 0.4123
Theoretical Plate 215489
LOD (µg/ml) 1.74
LOQ (µg/ml) 5.28
3.2.2 Linearity:
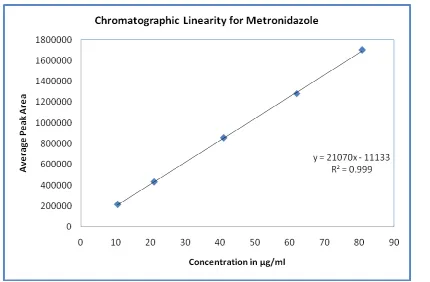
Every 10 µl of the working standard solution of metronidazole in the mass concentration range of 10.56 to 80.74 µl /ml were injected into chromatographic system. The chromatograms were developed and the peak area was determined for each concentration of the drug solution. Calibration curves of metronidazole were obtained by plotting the peak area versus the applied concentrations of metronidazole (Fig. 3). The linear regression coefficient was found to be 0.999 (Table 3).
Table 3: Linearity parameters
Parameters Metronidazole
Linearity range (µg/ml) (10.56- 80.74)µg/ml Regression coefficient 0.999
Intercept 11133
[image:3.595.216.380.621.672.2]Fig. 3 Linear relationship between peak areas versus concentrations
3.2.3 Precession:
[image:4.595.99.529.68.350.2]The precession of the proposed method was checked by repeatedly injecting (n=6) standard solutions of metronidazole without changing the parameters. The intraday and inter-day precisions of the proposed method were determined by estimating the corresponding responses six times on the same day and on three consecutive days [28]. The results were reported in Table 4, in terms of percent relative standard deviation (% RSD) with respect to peak area, peak retention time and the amount.
Table 4: Precision parameters
Parameters Intra-day % RSD Inter-day
Day1 Day2 Day3 % RSD
Peak Area 855291 0.09 855097 854912 854109 0.06
Peak RT 2.467 0.14 2.465 2.461 2.466 0.11
Amount (mg/Tab) 400.02 0.09 399.93 399.83 399.47 0.06
3.2.4 Accuracy
The accuracy of the method was determined by calculating the recoveries of metronidazole by the standard addition method. Known amounts of standard solutions of metronidazole were added at 90, 110 and 120 % level of pre-quantified sample solutions and the amounts were estimated by using the proposed method. The percentage recovery and standard deviation of the percentage recovery were calculated and given in Table 5.
Table 5: Accuracy parameters (recovery study)
Tablet
Formulation Drug
Labeled Amt. (mg/tab)
Assay amount (mg/tab)
% label claim (n =3)
Recovery Studies (n = 3) Total
Amt. after spiking
(mg)
Amt recovered (mg) Mean ±
SD
% Recovery
% Mean Recover
% RSD
[image:4.595.157.454.473.528.2]The ruggedness of the developed method was established by determining metronidazole in different instruments by different operator’s using similar type of column of different make.
3.2.6 LOD and LOQ:
Limit of detection (LOD) and limit of quantification (LOQ) were calculated as 3.3 δ/s and 10 δ/s respectively as per ICH guidelines [27] where δ in the standard deviation of response (y intercept) and s is the slope of the calibration plot. The results were found to be 1.74 µg/ml and 5.38 µg/ml (Table 2).
The proposed method gave best resolution and peak shape within short analysis time. A good linear relationship was observed in the concentration ranges of 10.56 µg/ml – 80.74 µg/ml. The correlation coefficient for metronidazole was found to be 0.999. The intra-day and inter-day precision results were good enough to indicate the proposed method was precise and reproducible. High percentage recovery of drug shows the method was free from interference of excepients present in the formulation. The change in flow rate, pH of mobile phase, composition of mobile phase did not affect the percent assay of drug confirming the robustness of the method. Robustness of the method was confirmed as no significant changes were observed on analysis using different instrument.
CONCLUSION
The developed HPLC method was simple, linear, precise and accurate and could be conveniently used for the routine quality control analysis of metronidazole from its pharmaceutical formulation and bulk drug.
Acknowledgments
The authors gratefully acknowledge Dey’s Medical, Kolkata for providing necessary facilities for carrying out this study.
REFERENCES
[1] Martindale: the complete drug reference, edited by Brayfield A., ed 38, 936-941.
[2] DJ Abraham, Burger’s medicinal chemistry and drug discovery, 6th ed., John Wiley and Sons., 2003, 5, 583-587.
[3] DA Williams; TL Lamke, Foye’s principles of medicinal chemistry. Lippincott Williams and Wilkins. USA., 5th ed., 829-830.
[4] B Swami; D Lavakusulu; CS Devi, Curr. Med. Res. Opin., 1977, 5, 152-156. [5] Y Noguchi; T Tanaka, Drugs., 1978, 15 Suppl 1, 10-15.
[6] A Garcia-Laverde; L de Bonilla, Am. J. Trop. Med. Hyg., 1975, 24, 781-783. [7] DD Moghaddam; E Ghadirian; M Azami, Parasitol. Res., 2005, 96, 273-275. [8] L Jokipii; AMM Jokipii, Infection, 1978, 6, 92-94.
[9] DA Rocha; I de Andrade Rosa; JA Urbina; W de Souza; M Benchimol, Parasitol. Res., 2014, 113, 2185-2197. [10]A Anthwal; UC Rajesh; MS Rawat; B Kushwaha; JP Maikhuri; VL Sharma; G Gupta; DS Rawat, Eur. J. Med.
Chem., 2014,79, 89-94.
[11] PL Lin; V Dartois; PJ Johnston; C Janssen; L Via; MB Goodwin; E Klein; CE 3rd Barry; JL Flynn, Proc. Natl.
Acad. Sci. U S A., 2012, 109, 14188-14193.
[12]S Koido; T Ohkusa; T Kajiura; J Shinozaki; M Suzuki; K Saito; K Takakura; S Tsukinaga; S Odahara; T Yukawa; J Mitobe; M Kajihara; K Uchiyama; H Arakawa; H Tajiri, PLoS One., 2014, 9(1), e86702. doi: 10.1371/journal.pone.0086702.
[13] LF McElhiney, Int. J. Pharm. Compd., 2013, 17, 380-383.
[14] A Rosmaninho; M Sanches; M Salgado; R Alves; M Selores, An Bras. Dermatol., 2013, 88, 71-74. [15] AK Mishra; A Kumar; A Mishra; HV Mishra, J. Nat. Sci. Biol. Med., 2014, 5, 261-264.
[16] E Vega; N Solá, J. Pharm. Biomed. Anal., 2001, 25, 523-530.
[17] MA Mahrouse; EF Elkady, Chem. Pharm. Bull. (Tokyo), 2011, 59, 1485-93. [18] A Mishal; D Sober, J. Pharm. Biomed. Anal., 2005, 39, 819-823.
[19] DK Bempong; RG Manning; T Mirza; L Bhattacharyya, J. Pharm. Biomed. Anal., 2005, 38, 776-780. [20] TG Venkateshwaran; JT Stewart, J. Chromatogr. B Biomed. Appl., 1995, 672, 300-304.
[21] MJ Galmier; AM Frasey; M Bastide; E Beyssac; J Petit; JM Aiache; C Lartigue-Mattei, J. Chromatogr. B
Biomed. Sci. Appl., 1998, 720, 239-243.
[22] AK Bera; AK De; B Pal, J. Chem. Pharm. Res.,2014, 6(5), 1214-1218.
[23] AK Bera; AK De; B Pal, Int. J. Pharm. Sci. Res.,2014, 5 (2), 563-567.
[26] United States Pharmacopeia. USP Convention, Rockville, MD, 2008, 1225.
[27] ICH (Q2, R1).Note for guidance on validation of analytical methods: Definitions and terminology. International conference on harmonisation, 1994, 9-13.