iii
ONE-DIMENSIONAL SIMULATION OF A RETROFITTED MEDIUM DUTY ENGINE RUNNING USING COMPRESSED NATURAL GAS
MUHAMMAD YUSRI BIN ISMAIL
A thesis submitted in
fulfillment of the requirement for the award of the Degree of Master of Mechanical Engineering
viii
ABSTRACT
Environmental improvement and energy issues are recently becoming one of the worldwide concerns due to the increasing demand for petroleum usage especially from the automotive sector. This situation had lead to encounter for a new
technology and reliable alternative fuel. A potential alternative fuel for compression ignition (C.I.) engine is the compressed natural gas (CNG). For C.I. engines to operate using CNG, or to be converted as a retrofitted CNG engine, further modifications are required. Previous works reported loss in brake power (BP) and increase in hydrocarbon (HC) emission for C.I. engine retrofitted with CNG fuelling. Analysis of performance and exhaust emissions characteristics for CNG retrofitted engine through experimental analysis requires high cost and very time consuming. Thus, a One –Dimensional simulation software, was introduced in this study to reduce the experimental process and setup. In this study a medium duty 4.3L, 4-cylinder, 4-stroke retrofitted compression ignition engine (RE) model were used in this simulation work over various operational conditions at low engine speed. At the beginning of this study, the model was first compared with a medium duty 4.3L, 4-cylinder, 4-stroke C.I. engine (DE) in order to predict the engine model capabilities running with different fuel types at low speed condition. The most significant finding in this simulation configuration is the RE model was able to reduce the fuel consumption (BSFC) and experience lower; brake power (BP), brake torque (BT) and brake thermal efficiency (BTE) by 18.1%, 30.3%, 30.7%, and 14.6% respectively. For emissions results the model generated higher unburned
hydrocarbon emissions (HC) and lower; oxides of nitrogen (NOx), carbon dioxides
ix
ABSTRAK
Penambahbaikan alam sekitar dan isu-isu tenaga telah menjadi salah satu kebimbangan kepada dunia yang disebabkan oleh peningkatan permintaan terhadap pengunaan petroleum terutama daripada sektor automotif. Situasi ini membawa kepada pencarian teknologi baru dan sumber bahan api alternatif. Salah satu bahan api yang berpotensi untuk enjin mampatan pencucuh (C.I.) adalah gas asli termampat (CNG). Bagi sebuah C.I. enjin untuk beroperasi mengunakan CNG, atau ditukar menjadi retrofit CNG enjin, beberapa perngubahsuaian diperlukan. Beberapa kajian sebelum ini melaporkan kehilangan kuasa brek (BP) dan peningkatan pelepasan hidrokarbon (HC) bagi C.I. enjin yang dipasang dengan CNG. Analisis bagi ciri-ciri prestasi dan ekzos pelepasan untuk retrofit CNG enjin melalui eksperimen memerlukan kos yang tinggi dan memakan masa. Oleh itu, satu perisian Satu– Dimensi, telah diperkenalkan untuk mengurangkan proses uji kaji dan penyelengaraan. Dalam kajian ini enjin model bersaiz sederhana 4-silinder, 4-stroke retrofit C.I. (RE) telah digunakan dalam kerja simulasi dalam pelbagai operasi pada kelajuan enjin yang rendah. Pada awal kajian ini model itu telah dibandingkan dengan enjin model bersaiz sederhana 4-silinder, 4-stroke C.I (DE) bagi meramalkan keupayaan enjin berjalan dengan mengunakan bahan api yang berbeza pada kelajuan enjin yang rendah. Penemuan yang paling penting dalam konfigurasi simulasi ini adalah model RE itu mampu mengurangkan penggunaan bahan api tertentu (BSFC) dan mengalami pengurangan; BP , tork brek (BT) dan kecekapan terma brek (BTE) masing-masing sebanyak 18.1 %, 30.3 %, 30.7 %, dan 14.6 %. Bagi jenis pelepasan keputusan yang dihasilkan oleh enjin model adalah peningkatan HC dan pengurangan; nitrogen oksida (NOx), karbon dioksida (CO2), dan karbon monoksida
x
CONTENTS
CHAPTER TITLE PAGE
CONFIRMATION i
TITLE PAGE iii
DECLARATION iv
SUPERVISOR CONFORMATION v
DEDICATION vi
ACKNOWLEDGEMENT vii
ABSTRACT viii
ABSTRAK ix
CONTENTS x
LIST OF SYMBOL xv
LIST OF ABBREVIATIONS xvii
LIST OF TABLES xviii
LIST OF FIGURES xix
LIST OF EQUATION xxi
LIST OF APPENDIX xxii
I INTRODUCTION 1
1.1 Background of the Study 2
1.1.1 Prospect of natural gas 4
1.1.1.1 Properties of natural gas 5 1.1.1.2 Advantages and disadvantages of
xi 1.1.2 An overview of the medium and heavy
duty engine 6
1.1.3 Retrofitting technology 7
1.1.4 Potential of retrofitting CNG fuel for
medium and heavy duty vehicle 8
1.1.5 The need of simulation for automotive study 9
1.2 Problem statement 10
1.3 Scope of the study 10
1.4 The objectives of the study 11
1.5 Significance of the study 11
II LITERATURE REVIEW 12
2.1 Spark ignition engine 12
2.2 Compression ignition engine 13
2.3 Engine emissions types 14
2.3.1 Carbon monoxides 14
2.3.2 Carbon dioxides 15
2.3.3 Oxides of nitrogen 15
2.3.4 Unburned hydrocarbon 16
2.4 Conversion characteristics related to natural gas
Engine 17
2.4.1 Combustion system 17
2.4.2 Compression ratio 19
2.5 CNG engine characteristics 21
2.5.1 Air-fuel ratio 21
2.5.2 Ignition timing 23
2.6 One-Dimensional engine simulation modelling software 24 2.6.1 Cylinder heat transfer model (EngCylHeatTr) 25 2.6.2 General fluid flow model in pipes 26 2.7 Progress in natural gas engine development 28
2.7.1 Spark ignition engine 28
xii
2.9 Summary 34
III METHODOLOGY 39
3.1 Analysis flow chart 40
3.2 RE and DE model specifications 41
3.3 Production methodology for RE and DE
One-Dimensional model 42
3.3.1 Inlet and outlet Environment model 44 3.3.2 Intake and exhaust system model 44
3.3.2.1 Cam lift profile 46
3.3.2.2 Temperature measurement 47 3.3.3 Fuel injection system model 50
3.3.3.1 AFR measurement 51
3.3.4 Engine system model 53
3.3.5 Single cylinder combustion model 54 3.3.5.1 Data acquisition tool for in-cylinder
pressure measurement 56
3.4 RE and DE model arrangement 58
3.5 Simulation setup for different operating
conditions 60
3.5.1 Simulation setup for in-cylinder pressure
profile 62
3.5.2 Simulation setup RE and DE performance and
emissions characteristics 63
3.5.3 Simulation setup for different AFR operating
conditions 64
3.6 Final One-Dimensional simulation configuration 65
IV RESULTS AND DISCUSSION 66
4.1 Simulation results for in-cylinder pressure profile 67 4.2 Simulation results: RE and DE One-Dimensional model
xiii
4.2.1 Brake power 72
4.2.2 Brake torque 73
4.2.3 Brake specific fuel consumption 74
4.2.4 Brake thermal efficiency 75
4.2.5 Oxides of nitrogen 76
4.2.6 Carbon monoxides 77
4.2.7 Carbon dioxides 78
4.2.8 Unburned hydrocarbon 79
4.3 Simulation results: RE One-Dimensional model
optimization at different AFR 80
4.3.1 Brake power 81
4.3.2 Brake specific fuel consumption 82
4.3.3 Oxides of nitrogen 83
4.3.4 Carbon monoxides 84
4.3.5 Carbon dioxides 85
4.3.6 Unburned hydrocarbon 86
4.4 Simulation validation for RE One-Dimensional model 87
4.4.1 Brake power 88
4.4.2 Brake torque 89
4.4.3 Brake specific fuel consumption 90
4.4.4 Oxides of nitrogen 91
4.4.5 Carbon monoxides 92
4.4.6 Carbon dioxides 93
4.4.7 Unburned hydrocarbon 94
4.5 Summary 95
V CONCLUSION AND RECOMMENDATIONS 99
5.1 Conclusion from different simulation setup 99 5.1.1 Production of One-Dimensional
simulation model 100
5.1.2 RE and DE One-Dimensional performance
xiv 5.1.3 RE One-Dimensional model optimization
at different AFR 101
5.1.4 Validation for RE One-Dimensional model 101 5.2 Potential contributions to knowledge 102 5.3 Recommendations for future research 102
5.4 Final note 103
REFERENCES 104
xv
LIST OF SYMBOLS
A Flow area
As Heat transfer surface area
(A/F) Air-fuel ratio
Stoichiometric air-fuel ratio Actual air-fuel ratio
B Bore
Cf Skin friction coefficient
CO Carbon monoxides
CO2 Carbon dioxides
Cp Pressure loss coefficient
D Equivalent diameter
Dx Length of mass element in the flow direction
dp Pressure differential acting across dx
E Total internal energy (internal energy + kinetic
energy)/mass
H Total enthalpy
LHV for blended fuel LHV for gasoline
LHV for butanol
HC Unburned hydrocarbon
h Heat transfer coefficient
Heat transfer coefficient
m Mass of the volume
̇ Air flow rate
̇ Fuel flow rate
xvi Number of cylinder
NOx Oxides of Nitrogen
ø Equivalence ratio
p Cylinder pressure
ρ Density
Butanol density
Gasoline denstity
Boundary mass flux into volume,
S Stroke
T Gas temperature
Fluid temperature
Wall temperature
u Velocity at the boundary
Torque
V Volume
Clearance volume (combustion chamber)
Displacement volume Volume fraction of butanol
Volume fraction of gasoline
xvii
LIST OF ABBREVIATIONS
AFR Air-fuel ratio
BDC Bottom dead centre
BP Brake power
BSFC Brake specific fuel consumption
BT Brake torque
bTDC Before top dead centre
BTE Brake thermal efficiency
CA Crank angle
CNG Compressed natural gas
CNG-BI 4-cylinder, 4-stroke retrofitted petrol engine CNG-DI 4-cylinder, 4-stroke CNG direct injection engine DE Medium duty 4-cylinder, 4-stroke C.I. engine
GHG Greenhouse gasses
LHV Lower heating value
LNG Liquid natural gas
MPI Multiport injection
NGV Natural gas vehicle
PG Pure gasoline
RCM Rapid compression machine
RE 4-cylinder, 4-stroke retrofitted compression ignition engine
RPM Revolution per minute
xviii
LIST OF TABLES
TABLES TITLE PAGE
1.1 Natural gas production and consumption 3
1.2 Advantages and disadvantages of natural gas engine 5
1.3 Description of vehicle class 6
2.1 Diesel conversion concept 18
2.2 Diesel engine model setup 33
2.3 Summary on the current progress in natural gas engine
development 35
2.4 Summary on the recent study in One-Dimensional engine
modelling software 37
3.1 One-Dimensional engine model engine specifications 41
3.2 Engine data considerations 42
3.3 Simulations and experimental variables 43
3.4 Temperature data for RE model by object parts 49
3.5 Diesel fuel properties 50
3.6 CNG fuel properties 51
4.1 Percentage of difference between measured and simulated
in-cylinder profile 94
4.2 Agreement with previous study for retrofitted CNG engine 97
xix
LIST OF FIGURES
FIGURE TITLE PAGE
1.1 Malaysia crude oil production and consumption by year 2
1.2 TAGP project connection 4
1.3 Natural gas engine classifications 7
2.1 Flow discretization illustration 26
3.1 Research methodology flow chart 40
3.2 Discretizing manifold concept 45
3.3 Valve lift profile 45
3.4 Cam lift profile test bench 46
3.5 Raytek Raynger ST thermometer 47
3.6 Thermocouple K- Type 48
3.7 Wide band commander dyno-jet 52
3.8 Single cylinder engine model 54
3.9 Dewe-201 56
3.10 Charge amplifier 5018 57
3.11 DE One-Dimensional model 58
3.12 RE One-Dimensional model 59
3.13 Starting the simulation setup 60
3.14 Combustion profile setup 62
3.15 DE One-Dimensional simulation setup 63
3.16 RE One-Dimensional simulation setup 63
3.17 AFR simulation setup 64
4.1 Measured and simulated in-cylinder pressure profile
at various engine speeds 70
xx
4.3 BT at various engine speeds 73
4.4 BSFC at various engine speeds 74
4.5 BTE at various engine speeds 75
4.6 NOx at various engine speeds 76
4.7 CO at various engine speeds 77
4.8 CO2 at various engine speeds 78
4.9 HC at various engine speeds 79
4.10 BP vs engine speed at various AFR 81
4.11 BSFC vs engine speed at various AFR 82
4.12 NOx vs engine speed at various AFR 83
4.13 CO vs engine speed at various AFR 84
4.14 CO2 vs engine speed at various AFR 85
4.15 HC vs engine speed at various AFR 86
4.16 BP at various engine speeds 88
4.17 BT at various engine speeds 89
4.18 BSFC at various engine speeds 90
4.19 NOx at various engine speeds 91
4.20 CO at various engine speeds 92
4.21 CO2 at various engine speeds 93
xxi
LIST OF EQUATIONS
EQUATION TITLE PAGE
2.1 Compression ratio 19
2.2 Displacement volume 19
2.3 Air/fuel ratio 21
2.4 Fuel/air ratio 21
2.5 Equivalence ratio 21
2.6 Woshni coefficient 25
2.7 Mass continuity equation 26
2.8 Conservation of momentum 26
2.9 Conservation of energy 27
2.10 Enthalpy 27
2.11 Lower heating value 30
3.1 Valve lift 46
xxii
LIST OF APPENDIX
APPENDIX TITLE PAGE
A Table of data and results 112
B Required parameter of simulating GT-Power 122
xxiii
“For him who embarks on the path of seeking knowledge,
Allah will ease for him the way to paradise”.
-
Prophet Muhammad (PBUH) -
CHAPTER 1
INTRODUCTION
In 1997 an international summit was held at Kyoto, Japan to discuss on environmental issues. The main card is to stabilize the atmospheric concentration of Greenhouse gases (GHG) which causes global warming. One of the main factor is the combustion of hydrocarbon from crude oil (Clémençon, 2008; Prins & Rayner, 2008; Vlachou & Konstantinidis, 2010). The current emission pollution has focused
the world attention to develop alternative fuel and reduce dependency on fossil fuel. An approach have been made which seen the usage of natural gas appears to be
suitable candidate in order to overcome emission problem caused by internal combustion engine.
Natural gas is a fossil fuel primary consists of methane and is one of the cleanest burning alternative fuels (Cascetta et al., 2008). It can be used in the form of compressed natural gas (CNG) and liquefied natural gas (LNG) to fuel car and truck. According to the Cascetta et al., (2008) use of natural gas as in a CNG engine propose several advantages; high octane number thus allowing high compression ratio in otto-cycle; promoting clean burning; negligible sulphur/toxic content and less CO2 unit of energy than gasoline or diesel. (Cascetta, Rotondo, & Musto, 2008)
2 during 2008 as the fuel subsidies were removed which seen an increase price of diesel and petrol fuel.
1.1 Background of the study
[image:19.595.114.516.412.662.2]For the past 20 years, Malaysia crude oil production is at the stage of low output production since reaching the highest peak of 755 thousand barrels/day in 2004. The downside of Malaysia production in crude oil began at 2005, however at that year Malaysia still manage to produce excess crude oil production up to 40 thousand barrels/day. However, starting from 2008 until 2011, Malaysia unfortunately has consumed excess crude oil at least 8 thousand barrels/days and forecasted consumed more crude oil until a new discovery of petroleum (Malaysia Crude Oil Production and Consumption by Year, 2013). This scenario based on Figure 1.1 indicates that Malaysia is now facing higher energy demand.
Figure 1.1: Malaysia crude oil production and consumption by year (Malaysia Crude Oil Production and Consumption by Year, 2013)
3 One of the solution to reduce the energy demand is by utilising the natural gas as an alternative fuel. Malaysia is regarded as one of the luckiest country in this
world due to the abundance of natural gas reserves. Based on Figure 1.2, the proven natural gas reserves stand on 83 trillion cubic feet at 2013 and expected to rise by years. In Asia-Pacific region, Malaysia is the fourth natural gas reserves holder after Australia, China and Indonesia (Malaysia Natural Gas Reserves, 2013). Most of the natural gas resources were found in the region of east Malaysia which is Sabah and Sarawak.
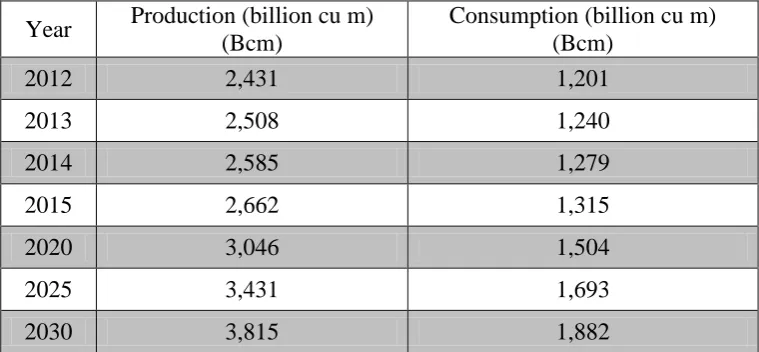
[image:20.595.129.509.464.640.2]Based on the study from Rahim & Liwan (2012), the production and consumption of natural gas in Malaysia is approximately directly proportional with, production exceeding consumption and the difference is widening through years as shown in Table 1.1. This indicates that if the trend continues the export of natural gas will be increased. At the current production rate even though there were no new discoveries of natural gas field, current reserve are still sufficient for 24 years until 2036, however if the slower rate of development in natural gas consumption continues Malaysia‟s natural gas reserve can last until 2053.
Table 1.1: Natural gas production and consumption (Rahim & Liwan, 2012)
Year Production (billion cu m) (Bcm)
Consumption (billion cu m) (Bcm)
2012 2,431 1,201
2013 2,508 1,240
2014 2,585 1,279
2015 2,662 1,315
2020 3,046 1,504
2025 3,431 1,693
4 1.1.1 Prospect of natural gas
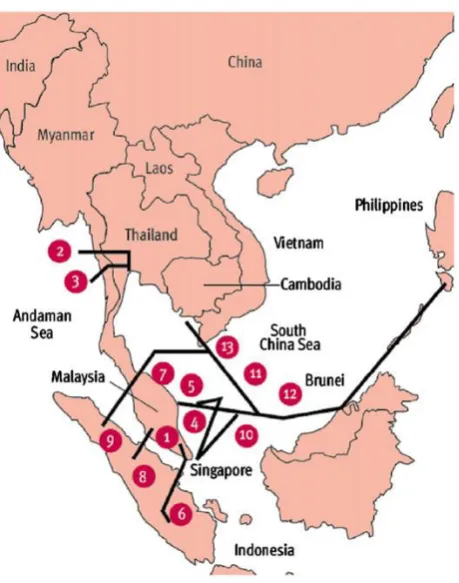
The Association of South East Asian Nation (ASEAN) was established on August 8th, 1967 with one of the task to promote a single product that can raise economic growth to all ASEAN members. Ever since, ASEAN was regarded as one of the most abundant natural gas, ASEAN had been moving forward to build an integrated natural gas pipeline to supply the gas across the border. In January 15th 2007, a “Cebu Declaration on East Asian Energy Security” was held at Cebu, Philippines
with the agenda to support a multibillion dollar project Trans-Asia Gas Pipeline (TAGP). Figure 1.2 illustrates the mega project connection involving the ASEAN country.
[image:21.595.206.436.439.731.2]According to Sovacool (2009) ASEAN had already invested $14.2 billion for 3452 km gas pipeline to supply 3095 million cubic feet (mcf) of gas per day. Two operational cross border projects that currently involving Malaysia are Trans-Thailand-Malaysia (TTM) and PETRONAS-Keppel which connects Gulf of Thailand to Changlun, Malaysia and Peninsular Gas Utilisation Johor, Malaysia to Jurong Island, Singapore that cost USD 2.42 billion and USD 4 million respectively.
5 1.1.1.1 Properties of natural gas
Fossil fuels occur in three fundamental of states: in solid form as coal, in liquid form as oil, and in gaseous form as natural gas. Natural gas is a non-renewable fuel and similar to other fossil fuel. The formation of natural gas occurs when the buried plants and animal were exposed to the heat for thousands of years. The composition of Natural gas is made up primarily of methane ethane, propane, nitrogen, helium, carbon dioxide, hydrogen sulphide, and water vapor with normally 95% of natural gas composition is methane. The physical chemical properties taken from (Ibrahim, 2006) described natural gas as; colourless, and odourless; lighter than air with a specific gravity about 0.6 – 0.8; inflamed during range 5 – 15% by volume of gas in air; self-ignition temperature is 537 – 540°C; lower environmental impact compare to other fuel; octane number of 130.
1.1.1.2 Advantages and disadvantages of Natural gas
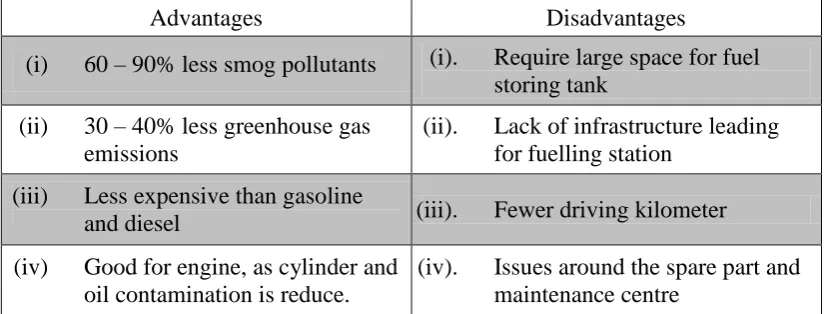
The advantages of natural gas over other fuels include the following; it has fewer impurities, it is less chemically complex, and its combustion generally results in less pollution. In most application, using natural gas produces less of the following
[image:22.595.113.527.589.746.2]substances than oil or coal. Table 1.2 shows the advantages and disadvantages of using natural gas engine based on report from Agee et al., (2009).
Table 1.2: Advantages and disadvantages of natural gas engine (Agee et al., 2009)
(Agee, Dasgupta, & Caron, 2009)
Advantages Disadvantages
(i) 60 – 90% less smog pollutants (i). Require large space for fuel storing tank
(ii) 30 – 40% less greenhouse gas emissions
(ii). Lack of infrastructure leading for fuelling station
(iii) Less expensive than gasoline
and diesel (iii). Fewer driving kilometer
(iv) Good for engine, as cylinder and oil contamination is reduce.
6 1.1.2 An overview of the medium and heavy duty engine
Medium and heavy duty engine are typically used for haul goods over long distances. The engine has been using diesel fuel burned in compression-ignition engines. These types of engine comprises of high fuel consumption and GHG emissions thus restricted to stringent emissions legislation. This relatively has long dominated the medium and heavy duty engine sector because it provides essential attributes to the manufacturers and their main commercial customers. Despite these strong attributes of diesel engine, it burns large volumes of diesel fuel and emit high levels of two harmful air pollutants which is particulate matter, (PM) and oxides of nitrogen,
(NOx). In term of noise pollution, the engine yield considerably higher sound levels
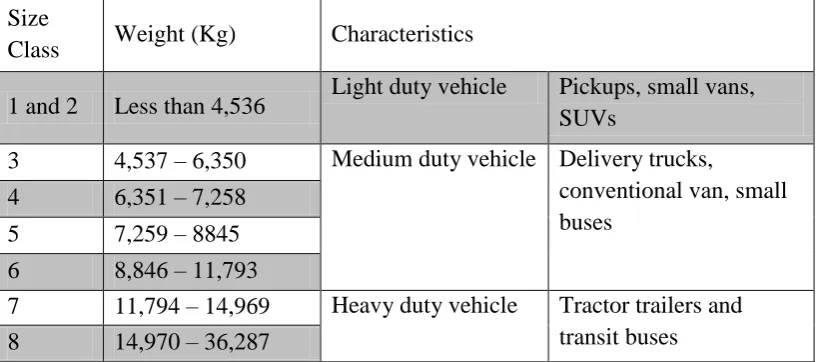
[image:23.595.116.525.489.670.2]at all speeds compared to typical cars. Continuous sounds are also contributed from tires rolling on the roadway, compressor and braking system (Sandberg, 2001). Table 1.3 depicts the description based on vehicle class. Medium-duty vehicles are those vehicles with a gross vehicle weight of 4,537 to 11,793 Kg. The largest of this group (Class 6 trucks) are also referred to as medium heavy-duty trucks. Heavy-duty vehicles have a gross vehicle weight over 11,794 Kg.
Table 1.3: Description of vehicle class (Ramachandran et al., 2012)
Size
Class Weight (Kg) Characteristics
1 and 2 Less than 4,536 Light duty vehicle Pickups, small vans, SUVs
3 4,537 – 6,350 Medium duty vehicle Delivery trucks,
conventional van, small buses
4 6,351 – 7,258 5 7,259 – 8845 6 8,846 – 11,793
7 1.1.3 Retrofitting technology
The retrofit engine term represent the engines that undergo several modifications from the older system. Retrofit is a system that usually applies to any type of vehicle in order to improve the engine durability and reliability. Normally implementing retrofit system to an engine required added component as well as some mechanical changes. Retrofit engine also often related to reduction of performance and low emissions production. The current technology existed for retrofitting natural gas engine is based on Figure 1.3.
Figure 1.3: Natural gas engine classifications
A dedicated engine uses natural gas as its only fuel source. The engine has the advantage of being optimised to operate on natural gas, thus ensuring maximum efficiency and optimum emissions results. Diesel engines converted to natural gas engine are considered as dedicated engine due to removal of direct injection system
thus the engine only capable to running single fuel type. For a spark ignition engine to work by bi-fuel mode required no major changes because the combustion cycle (otto cycle) remains the same. Most of the engine will be equipped with gas carburettor or gas injection system to be ignited with the air mixture. The engine can be running in switchable mode either by main fuel (gasoline) or gas (Jahirul et al.,
2010). In the dual fuel operation the cycle are based on compression ignition engine. The air-to-natural gas mixture from the intake processed is introduced into the cylinder, with a leaner air-to-fuel ratio. When the piston is closed to the end of the compression stroke, diesel fuel is injected, just as it would be in a traditional compression ignition engine. The diesel fuel ignites, and the diesel combustion causes the natural gas to burn (Bassi et al., 1993; Papagiannakis & Hountalas, 2003).
Natural gas engine
8 1.1.4 Potential of retrofitting CNG fuel for medium and heavy duty vehicle
The potential of retrofitting medium and heavy duty engine are no more questionable due to the various study successfully implemented the retrofitted technology for various size of engine. Previously (Pang et al., 2013; Papagiannakis & Hountalas, 2003; Poompipatpong & Cheenkachorn, 2011; Wong, 2005) are among the researcher who successfully converted the engine from compression ignition engine to natural gas engine.
Today, more than 11.3 million of natural gas vehicles (NGV) are on the road and about 16.5 thousand of refuelling stations are in operation worldwide (Ong
et al., 2012). Medium and heavy duty vehicles is a small percentage of the vehicles on the road, however they consume large amount of petroleum. By using CNG fuel the vehicle was able to reduce the dependency on the conventional fuel. Malaysia government currently has ensured that CNG is priced at one-third the cost of petrol and diesel fuel. Presently the diesel fuel price stand at MYR 2.00 compared to the CNG fuel at MYR 0.62 (as of date 10th October 2013).
Although the process of converting the engine is expensive, but that is not been much of a bother considering the savings making in terms of fuel purchases. Moreover, reduction of taxation schemes price introduced by Malaysia government has helped the development and entrance into the market of the NGV technology for
any type of engine capacity.
9 1.1.5 The need of simulation for automotive study
Perhaps simulation methodology is still new in the Malaysian automotive industry. Currently, there are no such an intensive research done by our car manufacturer e.g. Proton, Perodua, and DRB-Hicom. However, major international automotive industry e.g. Mercedes, Volvo, Mitsubishi, and Toyota has been widely use the simulation tool at various operating conditions with respect to the simulation capabilities. This proves that simulation analysis is equally important as the experimental approaches.
In this research study, the application of one of the leading automotive engineering One-Dimensional simulation software will be extensively used to predict the capabilities of the retrofitted medium duty engine. A key and unique element in One-Dimensional software is the ability it offers users to build integrated models of systems, including integration across sub-systems being modelled, physical domains and modelling levels.
By using the software a large amount of saving is possible by considering the modification of the engine. Furthermore simulation took less time to run the case study compared to the experimental and also can be done repeatedly without considering the fuel needed for the actual engine. The model is also was able to analyse the engine condition based on the actual measured experimental analysis;
10 1.2 Problem statement
Presently natural gas engine offer numerous of advantages over conventional fuel e.g. petrol and diesel especially in term of economic and environmental perspectives. However in Malaysia, the use of natural gas fuel are mostly limited to spark ignition and light duty vehicles with less attention paid to the medium duty engine. It is therefore a medium duty 4.3L engine capacity, 4-cylinder, 4-stroke retrofitted C.I. engine was modelled using One-Dimensional simulation software in order to predict the performance and emissions characteristics capability of the engine fuelled with CNG. This study also intended to investigate the influential parameters; in-cylinder pressure, engine geometry and fuel injection that able to improve the reliability and accuracy of the One-Dimensional simulation software. Nowadays computational modelling methodology offers; reduction in time, repeatable analysis, not dependent to fuel constraint, and capable of running various operating conditions simultaneously; compared to the experimental approach. Thus by considering the advantages of natural gas and simulation capabilities, it will be a very fruitful endeavour to be explored.
1.3 Scope of the study
This study will focus on the following below
(i) 4-cylinder, 4-stroke medium duty engine with capacity of 4.3L.
(ii) Engine operating at steady state varied from engine speed 850, 1000, 1150, 1300, 1500 and 1650 RPM.
(iii) Various AFR operations varied from rich (AFR = 15), stoichiometric (AFR = 17.2) and lean (AFR = 19).
(iv) The engine performance and emissions; brake power (BP), brake torque (BT), brake specific consumption (BSFC), brake thermal efficiency
(BTE) oxides of nitrogen (NOx), carbon monoxides (CO), carbon
11 1.4 The objectives of the study
The main objectives of the study are to:
(i) Produce a One-Dimensional model for 4.3L, 4-cylinder, 4-stroke retrofitted compression ignition engine fuelled with CNG.
(ii) Investigate the performance and emissions characteristics between RE (medium duty 4-cylinder, 4-stroke retrofitted C.I. engine fuelled with CNG) and DE (medium duty 4-cylinder, 4-stroke direct injection diesel engine) model at low engine speed condition.
(iii) Investigate the effects of various AFR to the RE model at low engine speed condition.
(iv) Study the reliability and accuracy of the One-Dimensional simulation software in predicting the engine performance and emissions characteristics.
1.5 Significance of the study
The One-Dimensional model designed is based on actual engine where as far as the
12
CHAPTER 2
LITERATURE REVIEW
This chapter presents the literature reviews related to engine parameters that affected the engine performance and emissions, and existing type of retrofitted CNG engine. The methodology used for previous researcher in modelling One-Dimensional simulation software were also been discussed in term of; fuel properties, engine layout design, and modelling accuracy achieved by the researcher.
2.1 Spark ignition engine
The actions in the spark-ignition engine can be divided into four parts. Each part consists of a piston stroke. This is the movement of the piston from bottom dead centre (BDC) to top dead centre (TDC), or from TDC to BDC. The complete cycle of events in the engine cylinder requires four piston strokes. These are intake, compression, power and exhaust. The crankshaft makes two complete revolutions to complete the four piston strokes. This makes the engine a four-stroke-cycle engine.
13 piston. on the power stroke, the exhaust valve opens. After passing through BDC, the piston moves up again. The burned gases escape through the open exhaust port
(Heywood, 1988; Salazar, 1998; Pulkrabek, 2004).
2.2 Compression ignition engine
Compression ignition engine concept is difference from spark ignition engine in a variety of ways but the most obvious one being the way in which the air and fuel mixture is ignited. In a compression ignition engine there is no spark to create the flame but rather high temperatures and pressures in the combustion chamber cause a flame to initiate at different sites of the combustion chamber.
The intake stroke in a diesel engine is used to draw in a new volume of charge air into the cylinder by moving the piston from TDC to BDC. The compression stroke begins as the inlet valve closes and the piston is driven upwards in the cylinder bore by the momentum of the crankshaft and flywheel. The purpose of the compression stroke in a diesel engine is to raise the temperature of the charge air to the point where fuel injected into the cylinder spontaneously ignites. Ignition takes place when the fuel from the high pressure fuel injector spontaneously ignites in the cylinder, thus moving the piston from TDC to BDC. As the rapidly burning
14 2.3 Engine emission types
A complete combustion of diesel and gasoline in the engine, produce only water (H2O), CO2 and unaffected nitrogen emissions in the exhaust. However, there is no 100% of efficiency for any mechanical being, therefore resulting to incomplete combustion. The typical type of pollutant in the exhaust emissions are CO, CO2,
uHC, NOx and PM.
Complete combustion:
Fuel + Air (Oxygen + Nitrogen) → Carbon dioxide (CO2) + Water (H2O) +
unaffected nitrogen (United States Environmental Protection Agency, 2009)
Typical engine combustion:
Fuel + Air (Oxygen + Nitrogen) → Unburned hydrocarbon (uHC) + Nitrogen
oxides (NOx) + Carbon monoxide (CO) + Carbon dioxide (CO2) + Water (H2O)
(United States Environmental Protection Agency, 2009)
2.3.1 Carbon monoxides
15 2.3.2 Carbon dioxides
Carbon dioxides is the most anthropogenic GHG. About three-quarters of CO2
emitted to the atmosphere during the past 20 years due to fossil fuel burning. The rest is predominantly due to land-use change, especially deforestation (Fong et al., 2007). Since the starting of the industrial revolution in 1850, the average atmospheric
concentration of CO2 trapped are in between 280 ppm to 370 ppm resulted to the average global temperature between 0.6℃ and 1℃. The International Panel on
Climate Change (IPCC) expect that, by the year 2100, the atmosphere will comprised
of 570 ppm CO2, causing arise in the mean global temperature up to 1.9℃ (Liu et al., 2013). Continuous increments in CO2 emissions lead to the increases of sea level and
species extinction due to temperature rise.
2.3.3 Oxides of nitrogen
Oxides of nitrogen (NOx) commonly consists of nitrogen oxide (NO) and nitrogen
dioxide (NO2) which is formed from combination of oxygen (O2) and nitrogen (N2)
in the air at high temperature when the fuel is burned. Almost half of the NOx
emissions are produced from automotive sector followed by industrial boilers, incinerators, gas turbines, cement manufacturer, petroleum refineries and nitric acid manufacture (United States Environmental Protection Agency, 1999). These various
sources leading to different type of chain chemical reaction involving the NOx
emissions. The NO2 emissions are able to react with the atmosphere surrounding to
form ozone (O3) and acid rain. It is vital to reduce the amount of ozone formation
16 2.3.4 Unburned hydrocarbon
17 2.4 Conversion characteristics related to natural gas engines
The characteristics of the CNG engine is determine by the feasibility of the conversion process. A defective conversion resulted to; higher exhaust emissions, losses of unacceptable brake power, increase of fuel consumption and maintenance cost. In order to avoid such drawbacks, natural gas engine have to essentially consider two main characteristics which is combustion system and compression ratio.
2.4.1 Combustion system
Substituting the conventional fuel to natural gas in an engine system can be achieved by converting the engine. In order to convert the engine, the following options are possible (United States Environmental Protection Agency, 2009; York, 1993):
(i) Modification of a gasoline (otto cycle) engine to CNG combustion (so called conversion to a dedicated fuel;
(ii) Modification of gasoline engine to either CNG or gasoline (bi-fuel combustion);
(iii) Conversion of diesel engine to dedicated CNG (spark ignition)
combustion; and
(iv) Conversion of a diesel engine to dual fuel (gas and diesel mixture) combustion
18 In the dual fuel system (option iv) the quantity of diesel is reduced to a pilot injection to initiate the combustion. Dual fuel engines remain diesel, i.e.
self-ignition, engines for which the energy deficit, caused by reduced diesel injection, is at any given throttle setting compensated for by natural gas mixed with the induction air. Constructional changes are minor: the injection system has to be modified to reduce diesel flow, supplemented by a gas mixer in the induction tract to supply the balancing quantity of gas to the engine (Korakianitis et al., (2011); Zheng et al.,
(2009).
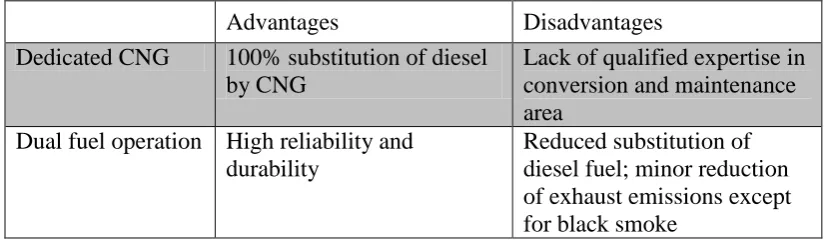
[image:35.595.112.525.333.454.2]A brief description of the advantages and disadvantages of the two diesel engine conversion concepts is given in the following overview:
Table 2.1: Diesel conversion concept (Reproduced from York, 1993)
Advantages Disadvantages
Dedicated CNG 100% substitution of diesel by CNG
Lack of qualified expertise in conversion and maintenance area
Dual fuel operation High reliability and durability
19 2.4.2 Compression ratio
Compression ratio (CR) is the ratio of the total volume of the combustion chamber when the piston is at the BDC to the total volume of the combustion chamber when piston is at the TDC. The formula expressing the definition of compression ratio is based on equation 2.1 and 2.2
Equation 2.1: Compression ratio (Pulkrabek, 2004)
c d c c V V V r
Equation 2.2: Displacement volume (Pulkrabek, 2004)
S B N
Vd c 2
4
B = Bore
S = Stroke
c
N = Number of cylinder
c
V = Clearance volume (combustion chamber)
d
V = Displacement volume
c
r = Compression ratio
20 Damrongkijkosol (2006) investigate the effect of CR on the performance and emissions in a CNG dedicated engine. The result indicates that increasing the CR
gave more power output. The NOx emissions showed a trend of increasing and decreasing which is unstable. The overall HC emissions are higher as the increase of CR and reflected to lower CO emissions.
Based on study by Zheng et al., (2009) the increase of CR resulted to higher BTE. For exhaust emissions, CO decreases while NOx increases with increase of CR. The HC concentration shows a decreasing trend and then an increasing trend with increasing compression ratio.
Different case studied by Poompipatpong & Cheenkachorn (2011) investigated the effect of converted indirect diesel engine to CNG engine at increasing CR 9.0 : 1, 9.5 : 1, 10.0 : 1 and 10.5 : 1 for 4-cylinder, 4-stroke 2197cc engine capacity. In order to operate the engine with CNG fuel, the engine must undergo several modifications by reducing the engine initial condition from CR 22: 1 to 9.0: 1, 9.5: 1, 10.0: 1 and 10.5: 1, substitute the fuel injector to spark plug and new piston geometry. Throughout the testing, CNG engine was able to improve the engine BP approximately from 5.7% to 13%. He also observes that increasing the
compression ratio lead to higher generation of NOx emissions. (Poompipatpong &
21 2.5 CNG engine characteristics
The characteristics of the CNG engine are highly depending on the engine setup; air fuel ratio and ignition timing. Thus in this section the mentioned characteristics is discussed briefly.
2.5.1 Air-fuel ratio
Air-to-fuel (A/F) ratio is the mass ratio of the A/F mixture trapped inside a cylinder before combustion begins, and it affects engine emissions, fuel economy, and other performances (Diesel, 2011; Pace & Zhu, 2013). The formula expressing the definition of compression ratio is based on equation 2.3, 2.4 and 2.5.
Equation 2.3: Air/fuel ratio (Pulkrabek, 2004)
f a
m m F A
/
Equation 2.4: Fuel/air ratio (Pulkrabek, 2004)
a f
m m A F
/
Equation 2.5: Equivalence ratio (Pulkrabek, 2004)
AFStoichiomeActualtric AF22 The purpose of AFR control is to maintain stoichiometry between the mass of air and fuel entering the combustion chamber. This is important because if
stoichiometry is not achieved, the engine will not be able to oxidize or reduce harmful exhaust emissions. For natural gas fuel, the stoichiometric air/fuel mixture is approximately 17.2 (Heywood, 1988) equal to the mass of air to fuel. Any mixture less than 17.2 to 1 is considered to be a rich mixture, and any more than 17.2 is a lean mixture.
Saidur et al., (2007) study the variation of brake power (BP) with air fuel ratio for diesel engine running by natural gas fuel. Based on the analysis that BP decrease as air fuel ratio increases. The BP increase is caused by increased fuel supply. At lower AFR, air-fuel mixture is rich that facilitates more burning and therefore engine power (kW) is higher at lower AFR. BP gradually decreases with increasing AFR, because at higher AFR lean mixture causes reduced burning.
A reviewed done by Korakianitis et al., (2011) conclude that the combustion of a lean-fuel mixture of natural gas engine
1
result in low NOxemissions this also can result to reduction of power output. Meanwhile running the
engine on fuel-rich
1
is also undesirable. However if the NOx is high during leancondition the engine are currently experience high exhaust temperature due to lack of oxygen.(Korakianitis et al., 2011)
A study conducted by Pang et al., (2013) the effect of excess air ratio on turbocharged lean burned 6 cylinder retrofitted diesel engine running with CNG fuel. The output torque of each condition decreases slightly with the increase of the λ from
1.25, 1.35, 1.45, 1.55 and 1.6. When the excess air ratio exceeds 1.5, HC emissions
23 2.5.2 Ignition timing
Fuel injection timing is the process of setting the ignition to occur in the combustion chamber during the compression stroke relatively to the piston and crankshaft position.
If the fuel injection timing take place earlier (advance), the initial air temperature and pressure are inferior thus increasing the time for ignition delay. Meanwhile if the injection timing starts later (retard) the temperature and pressure are superior but reducing in ignition delay period. In a study done by Ali et al.,
(2005) for CNG direct injection type observe that advance injection shows a slower burn in the initial stage and a faster burn in the late stage. In contrast to this, the late injection showed a faster burn in the initial stage and a slower burn in the late stage. Faster burn at the initial stage is caused by moderately strong turbulence and faster burn at the late stage is caused by moderately proceeding mixture formation.
An experimental work to investigate the natural gas combustion characteristics under various fuel injection timings was done by Huang et al., (2003) using Rapid Compression Machine (RCM). The RCM showed that natural gas result in fast combustion due to the shortening of time interval. The NOx emissions remain high but the CO level decrease of a wide range. By using natural gas better combustion efficiency can achieve due to the gaseous state of natural gas.
24 2.6 One-Dimensional engine simulation modelling software(Ali et al., 2005) (Huang et al., 2003)
104
References
Abianeh, O. S., Mirsalim, M., & Ommi, F. (2009). Combustion Development of a BI-Fuel Engine. International Journal of Automotive Technology, 10(1), 17–25. doi:10.1007/s12239
Agee, S. C., Dasgupta, S., & Caron, A. (2009). Natural Gas Vehicles : A Feasibility Study. In Economic Research and Policy Institute (pp. 1 – 16). Oklahama City University.
Aina, T., Folayan, C. O., & Pam, G. Y. (2012). Influence of Compression Ratio on the Performance Characteristics of a Spark Ignition Engine. Advances in Applied Science Research, 3(4), 1915–1922.
Ali, Y., Muhammad, Z., & I-khamas, M. (2005). Valve Timing and Ignition Issues in Fuel System for Compressed Natural Gas, Direct Injection (CNGDI). In The Asia Pacific Natural Gas Vehicles Association (ANGVA) 1st Conference & Exhibition (ANGVA2005) (pp. 1–5).
Bakar, R. A., Kadirgama, K., Rahman, M. M., & Sharma, K. V. (2007). Application of Natural Gas for Internal Combustion Engines. Advances in Natural Gas Technology, 5(5), 1–27. doi:ISBN 978-953-51-0507-7
Bassi, A., Srl, S. A., & Bodoni, G. B. (1993). Natural Gas Vehicle for a Clean Environment An Overview and the Trends for the Future. In Clean Combustion Technologies: Proceedings of the Second International Conference, Part B (Energy, Combustion and the Environment Series , Vol 2) (pp. 739–749). Milan: Gordon and Breach Science Publishers.
Bos, M. (2007). Validation Gt-Power Model Cyclops Heavy Duty Diesel Engine, Master Thesis. Technical University of Eindhoven.
Cascetta, F., Rotondo, G., & Musto, M. (2008). Measuring of Compressed Natural Gas in Automotive Application: A Comparative Analysis of Mass Versus Volumetric Metering Methods. Flow Measurement and Instrumentation, 19(6), 338–341. doi:10.1016/j.flowmeasinst.2008.05.003
Clémençon, R. (2008). The Bali Road Map A First Step on the Difficult Journey to a Post-Kyoto Protocol Agreement. The Journal of Environment & Development,
17(1), 70–95. doi:10.1177/1070496508314223
105 Das, a, & Watson, H. C. (1997). Development of a Natural Gas Spark Ignition
Engine for Optimum Performance. Proceedings of the Institution of Mechanical Engineers, Part D: Journal of Automobile Engineering, 211(5), 361–378. doi:10.1243/0954407971526506
Deng, B., Yang, J., Zhang, D., Feng, R., Fu, J., Liu, J., … Liu, X. (2013). The challenges and strategies of butanol application in conventional engines: The sensitivity study of ignition and valve timing. Applied Energy, 108, 248–260. doi:10.1016/j.apenergy.2013.03.018
Diesel, B. (2011). Diesel Tuning and Air-Fuel Ratios. Old Huma Hwy, Nsw 2577: Industry Corner.
Fong, W.-K., Matsumoto, H., Ho, C.-S., & Lun, Y.-F. (2007). Energy Consumption and Carbon Dioxide Emissions Considerations in the Urban Planning Process in Malaysia. Skudai Johor Baharu.
Gamma Technologies, I. (2009a). GT-SUITE: Flow Theory Manual. 601 Oakmont Lane,Suite 220 Westmont.IL 60559 USA.
Gamma Technologies, I. (2009b). GT-SUITE: Engine Performance Tutorials. 601 Oakmont Lane,Suite 220 Westmont.IL 60559 USA.
Gamma Technologies, I. (2009c). GT-SUITE. 601 Oakmont Lane,Suite 220 Westmont.IL 60559 USA: Gamma Technologies.
Gamma Technologies, I. (2009d). GT- Suite Engine Performance Application Manual Version 7.0. 601 Oakmont Lane,Suite 220 Westmont.IL 60559 USA.
Gatts, T., Liu, S., Liew, C., Ralston, B., Bell, C., & Li, H. (2012). An experimental investigation of incomplete combustion of gaseous fuels of a heavy-duty diesel engine supplemented with hydrogen and natural gas. International Journal of Hydrogen Energy, 37(9), 7848–7859. doi:10.1016/j.ijhydene.2012.01.088 Geok, H. H. (2009). Experimental Investigation of Performance and Emission of a
Sequential Port Injection Natural Gas Engine. International Journal of
Engineering and Innovative Technology, 30(2), 204–214. doi:ISSN: 2277-3754 Hammill, D. (2002). How to Choose Camshafts and Time Them for Maximum Power
(1st Editio., pp. 1 – 53). London: Veloce Publishing.
Heywood, J. B. (1988). Internal Combustion Engine Fundamentals (McGraw Hil.). New York: McGraw-Hill International Edition.
Huang, Z., Shiga, S., Ueda, T., Jingu, N., Nakamura, H., & Ishima, T. (2003). A Basic Behavior of Machine, NG DI Combustion in a Spark-Ignited Rapid Compression. JSME International Journal Series B, 45, 891–900.
106
Environmental Science and Development, 4(4), 375–378. doi:10.7763/IJESD.2013.V4.374
Ibrahim, N. K. (2006). 4th Year/Petroleum Refinery Engineering Branch.
Industrial Accident Prevention Association. (2008). Carbon Monoxide in The Workplace. United State of America.
Ismail, M. Y., Alimin, A. J., & Osman, S. A. (2012). Mono-Gas Fuelled Engine Performance and Emissions Simulation using GT-Power. In 4th International Conference on Mechanical and Manufacturing Engineering (pp. 125 – 129). doi:10.4028/www.scientific.net/AMM.465-466.125
Jahirul, M. I., Masjuki, H. H., Saidur, R., Kalam, M. A., Jayed, M. H., & Wazed, M. A. (2010). Comparative engine performance and emission analysis of CNG and gasoline in a retrofitted car engine. Applied Thermal Engineering, 30(14-15), 2219–2226. doi:10.1016/j.applthermaleng.2010.05.037
Kalam, M A, Masjuki, H. H., Maleque, M. A., Amalina, M. A., Abdesselam, H., Mahlia, T. M. I., … Varman, M. (2009). Power Improvement of a Modified Natural Gas Engine.
Kalam, M.A., & Masjuki, H. H. (2011). An Experimental Investigation of High Performance Natural Gas Engine with Direct Injection. In Energy (Vol. 36, pp. 3563–3571). Elsevier Ltd. doi:10.1016/j.energy.2011.03.066
Korakianitis, T., Namasivayam, a. M., & Crookes, R. J. (2011). Natural-gas fueled spark-ignition (SI) and compression-ignition (CI) engine performance and emissions. Progress in Energy and Combustion Science, 37(1), 89–112. doi:10.1016/j.pecs.2010.04.002
Liu, H., Werst, M., Strank, S., Osara, J., & Hebner, R. (2010a). Combustion Emissions Modeling Testing of Conventional Diesel Fuel. In ASME 2010 4th International Conference of Energy Sustainability (pp. 1–10). Austin, Texas, USA.
Liu, H., Werst, M., Strank, S., Osara, J., & Hebner, R. (2010b). Combustion Emissions Modeling And Testing of Neat Biodiesel Fuels. In ASME 2010 4th International Conference of Energy Sustainability (pp. 1–10). Austin, Texas, USA.
Liu, J. Y., Zhang, X. F., Zhang, J. F., Liu, H., & Li, F. Q. (2013). Development Status and Energy Penalty of Carbon Dioxide Capture Technologies. In
Advanced Materials Research (Vol. 864–867, pp. 1598–1601). doi:10.4028/www.scientific.net/AMR.864-867.1598
107 Maji, S., Sharma, P. B., & Babu, M. k G. (2005). Experimental Investigation on
Performance and Emissions Characteristics in a Spark Ignition Engine. In SAE Technical Paper NO. 2005-26-344 (pp. 1–6).
Malaysia Crude Oil Production and Consumption by Year. (2013). United States Energy Information Administration, Retrieved on 09 Disember 2013, http://www.indexmundi.com/energy.aspx?country=my.
Malaysia Natural Gas Reserves. (2013). EIA Administration Independent Statistic & Analysis U.S. Energy Information , retrieved on 08 Disember 2013, from http://www.eia.gov/countries/country-data.cfm?fips.
Martinez, P. a., Caba, F. M., Alvarado, S. a., & Caceres, D. D. (2011). Indoor and Personal Carbon Monoxide Exposure Risk Assessment in Sample of Apartment Buildings in Santiago, Chile. Indoor and Built Environment, 21(3), 474–480. doi:10.1177/1420326X11411501
Meyer, J. (2007). Engine Modeling of an Internal Combustion Engine Master Thesis. The Ohio State University.
Morrissey, C. G. (2008). Experimental Validation of an All Inclusive Small Engine Carburetor Model in One-Dimensional Engine Software, Master Thesis. University of Wisconsin Madison.
Nerkar, A. (2013). Optimization and Validation for Injector Nozzle Hole Diameter of a Single Cylinder Diesel Engine using GT-Power Simulation Tool.
saefuel.saejournals.org, Volume 5(Issue 3), 1372–1381. doi:10.4271/2012-01-2306
Numata, A., Nagae, Y., Kumagai, T., & Osafune, S. (2001). Increase of Thermal Efficiency and Reduction of NOx Emissions in DI Diesel Engines. Mitsubishi Heavy Industries, 38(3), 136–140.
Ogawa, H., Miyamoto, N., Kawabe, T., & Tosaka, S. (2014). Characteristics of Unburned Hydrocarbon Emissions in a Low Compression Ratio DI Diesel Engine. In SAE Technical Paper 2009-01-1526 (pp. 1 – 7).
Ong, H. C., Mahlia, T. M. I., & Masjuki, H. H. (2012). A review on energy pattern and policy for transportation sector in Malaysia. Renewable and Sustainable Energy Reviews, 16(1), 532–542. doi:10.1016/j.rser.2011.08.019
Osman, S. A., Alimin, A. J., Ismail, M. Y., & Hui, K. W. (2013). Performance and Emission Characteristics of Direct Injection C.I Engine Retrofitted with Mono-CNG System. In Applied Mechanics and Materials (Vol. 446–447, pp. 443– 447). doi:10.4028/www.scientific.net/AMM.446-447.443
108 Pang, J. X., Qu, D. W., Lu, X., & Liu, G. Y. (2013). Experimental Research on the
Effect of Excess Air Ratio on Turbocharged Lean-Burned CNG Engine. In
Advanced Materials Research (Vol. 724–725, pp. 1422–1426). doi:10.4028/www.scientific.net/AMR.724-725.1422
Papagiannakis, R. G., & Hountalas, D. T. (2003). Experimental Investigation Concerning the Effect of Natural Gas Percentage on Performance and Emissions of a DI Dual Fuel Diesel Engine. In Applied Thermal Engineering
(Vol. 23, pp. 353–365).
Poompipatpong, C., & Cheenkachorn, K. (2011). A modified diesel engine for natural gas operation: Performance and emission tests. Energy, 36(12), 6862– 6866. doi:10.1016/j.energy.2011.10.009
Prins, G., & Rayner, S. (2008). The Kyoto Protocol. In Bulletin of the Atomic Scientists (Vol. 64, pp. 45–58). doi:10.2968/064001011
Rahim, K. A., & Liwan, A. (2012). Oil and gas trends and implications in Malaysia.
Energy Policy, 50, 262–271. doi:10.1016/j.enpol.2012.07.013
Rahim, R., Mamat, R., Taib, M. Y., & Abdullah, A. A. (2012). Influence of Fuel Temperature on a Diesel Engine Performance Operating with Biodiesel Blended, 43.
Rahman, M. M., Mohammed, M. K., & Bakar, R. A. (2008). Effect of Engine Speed on Performance of Four-Cylinder Direct Injection Hydrogen Fueled Engine. In
4th BSME-ASME International COnference on Thermail Engineering (pp. 500– 505).
Ramachandran, K., Suneetha, Kanchustambham, Wingerden, V., Ladipo, O., Aggarwal, S., & Rucker, A. (2012). Road Transport: Unloacking Fuel Saving Technologies In trucking and Fleets (pp. 1–28).
Said, M. F. M. (2006). Performance and Emissions Tests of Biodiesel Fuels Using a Conventional Diesel Engine Master Thesis. Universiti Teknologi Malaysia. Saidur, R., Jahirul, M. I., Moutushi, T. Z., Imtiaz, H., & Masjuki, H. H. (2007).
Effect of partial substitution of diesel fuel by natural gas on performance parameters of a four-cylinder diesel engine. Proceedings of the Institution of Mechanical Engineers, Part A: Journal of Power and Energy, 221(1), 1–10. doi:10.1243/09576509JPE182
Salazar, F. (1998). Internal combustion engines. Department of Aerospace and Mechanical Engineering.
Semin, Ismail, A. R., & Bakar, R. A. (2008). Investigation of CNG Engine Intake Port Gas Flow Temperature Based on Steady-State and Transient Simulation.
109 Sovacool, B. K. (2009). Energy policy and Cooperation in Southeast Asia: The
History, Challenges, and Implications of the Trans-ASEAN Gas Pipeline (TAGP) Network. Energy Policy, 37(6), 2356–2367.
doi:10.1016/j.enpol.2009.02.014
Suardi, M., Zahedi, G., & Belyamin, B. (2013). Modeling of Diesel Engine Emission Running on Biodiesel. Proceeding of the International Conference on Process Systems Engineering (PSE ASIA), (June), 25–27.
Tony Sandberg. (2001). Heavy Truck Modelling for Fuel Consumption Simulations and Measurements. Linkoping University Sweden.
Tziourzioumis, D. (2010). Simulation and Experimental Validation of Steady State Operation of a Turbocharged, Common Rail HDI Diesel Engine Runnging on Biodiesel Blends. University of Thessaly.
United States Environmental Protection Agency. (1999). Technical Bulletin: Nitrogen Oxides ( NOx ), Why and How They Are Controlled. Research Triangle Park, North Carolina 27711: Information Transfer and Program Integration Division.
United States Environmental Protection Agency. (2009). Automobile Emissions : An Overview. Plymouth Road: EPA National Vehicle and Fuel Emissions
Laboratory.
Vlachou, A., & Konstantinidis, C. (2010). Climate Change: The Political Economy of Kyoto Flexible Mechanisms. Review of Radical Political Economics, 42(1), 32–49. doi:10.1177/0486613409357179
Vudumu, S. K., & Koylu, U. O. (2011). Computational Modeling, Validation, and Utilization for Predicting the Performance, Combustion and Emission
Characteristics of Hydrogen IC engines. Energy, 36(1), 647–655. doi:10.1016/j.energy.2010.09.051
W.Pulkrabek, W. (2004). Engineering Fundamentals of the Internal Combustion Engine (Second Edi., p. 478). Pearson Prentice-Hall.
Wang, X., & Stone, C. R. (2008). A Study of Combustion, Instantaneous Heat Transfer, and Emissions in a Spark Ignition Engine During Warm-Up. In
Proceedings of the Institution of Mechanical Engineers, Part D: Journal of Automobile Engineering (Vol. 222, pp. 607–618).
doi:10.1243/09544070JAUTO610
Wong, W. L. (2005). Compressed Natural Gas as an Alternative Fuel in Diesel Engine. Master Thesis, University of Southern Queensland.
110 Xiao, Y., & Zhou, P. (2011). Investigation of Emission Characteristic of a Diesel
Engine by Simulation. Applied Mechanics and Materials, 80-81, 752–756. doi:10.4028/www.scientific.net/AMM.80-81.752
Xinguang, L., & Jianguo, Y. (2010). Research on NOx Emissions of the Engine Fueled with M15. 2010 International Conference on Intelligent Computation Technology and Automation, 49–52. doi:10.1109/ICICTA.2010.729
Yeh, S. (2007). An empirical analysis on the adoption of alternative fuel vehicles: The case of natural gas vehicles. Energy Policy (Vol. 35, pp. 5865–5875). doi:10.1016/j.enpol.2007.06.012
York, U. N. N. (1993). Guideline for Conversion of Diesel Busses to Compressed Natural Gas (pp. 1–39).
Zheng, J. (2009). Use of An Engine Cylcle Simulation to Study a Biodiesel Fueled Engine. Texas A&M University.
Zheng, J.-J., Wang, J.-H., Wang, B., & Huang, Z.-H. (2009). Effect of the
compression ratio on the performance and combustion of a natural-gas direct-injection engine. Proceedings of the Institution of Mechanical Engineers, Part D: Journal of Automobile Engineering, 223(1), 85–98.